SlideShare une entreprise Scribd logo
1  sur  64
Télécharger pour lire hors ligne
CHAPTER 9 
Plant Assets, Natural Resources, 
and Intangible Assets 
ASSIGNMENT CLASSIFICATION TABLE 
Study Objectives Questions 
Brief 
Exercises Do It! Exercises 
A 
Problems 
B 
Problems 
1. Describe how the cost principle 
applies to plant assets. 
1, 2, 3 1, 2 1 1, 2, 3 1A 1B 
2. Explain the concept of 
depreciation. 
4, 5 2 4 
3. Compute periodic depreciation 
using different methods. 
6, 7, 8, 24, 
25, 26 
3, 4, 5, 
6, 7 
5, 6, 7, 8 2A, 3A, 
4A, 5A 
2B, 3B, 
4B, 5B 
4. Describe the procedure for 
revising periodic depreciation. 
9, 10 8, 9 9, 10 4A 4B 
5. Distinguish between revenue 
and capital expenditures, and 
explain the entries for each. 
11, 27 10 
6. Explain how to account for 
the disposal of a plant asset. 
12, 13 11, 12 3 11, 12 5A, 6A 5B, 6B 
7. Compute periodic depletion 
of extractable natural 
resources. 
14, 15 13 4 13 
8. Explain the basic issues 
related to accounting for 
intangible assets. 
16, 17, 18, 
19, 20, 
21, 22 
14, 15 4 14, 15 7A, 8A 7B, 8B 
9. Indicate how plant assets, 
natural resources, and 
intangible assets are 
reported. 
23 16, 17 16 5A, 7A, 
9A 
5B, 7B, 9B 
*10. Explain how to account 
for the exchange of plant 
assets. 
28, 29 18, 19 17, 18 
Copyright © 2011 John Wiley & Sons, Inc. Weygandt, IFRS, 1/e, Solutions Manual (For Instructor Use Only) 9-1
ASSIGNMENT CHARACTERISTICS TABLE 
Problem 
Number Description 
Difficulty 
Level 
Time 
Allotted (min.) 
1A Determine acquisition costs of land and building. Simple 20–30 
2A Compute depreciation under different methods. Simple 30–40 
3A Compute depreciation under different methods. Moderate 30–40 
4A Calculate revisions to depreciation expense. Moderate 20–30 
5A Journalize a series of equipment transactions related to 
purchase, sale, retirement, and depreciation. 
Moderate 40–50 
6A Record disposals. Simple 30–40 
7A Prepare entries to record transactions related to acquisition 
and amortization of intangibles; prepare the intangible 
assets section. 
Moderate 30–40 
8A Prepare entries to correct errors made in recording and 
amortizing intangible assets. 
Moderate 30–40 
9A Calculate and comment on asset turnover ratio. Moderate 5–10 
1B Determine acquisition costs of land and building. Simple 20–30 
2B Compute depreciation under different methods. Simple 30–40 
3B Compute depreciation under different methods. Moderate 30–40 
4B Calculate revisions to depreciation expense. Moderate 20–30 
5B Journalize a series of equipment transactions related to 
purchase, sale, retirement, and depreciation. 
Moderate 40–50 
6B Record disposals. Simple 30–40 
7B Prepare entries to record transactions related to acquisition 
and amortization of intangibles; prepare the intangible 
assets section. 
Moderate 30–40 
8B Prepare entries to correct errors made in recording and 
amortizing intangible assets. 
Moderate 30–40 
9B Calculate and comment on asset turnover ratio. Moderate 5–10 
9-2 Copyright © 2011 John Wiley & Sons, Inc. Weygandt, IFRS, 1/e, Solutions Manual (For Instructor Use Only)
WEYGANDT IFRS 1E 
CHAPTER 9 
PLANT ASSETS, NATURAL RESOURCES, 
AND INTANGIBLE ASSETS 
Number SO BT Difficulty Time (min.) 
BE1 1 AP Simple 2–4 
BE2 1 AP Simple 1–2 
BE3 3 AP Simple 2–4 
BE4 3 E Moderate 4–6 
BE5 3 AP Simple 4–6 
BE6 3 AP Simple 2–4 
BE7 3 AP Simple 4–6 
BE8 4 AN Moderate 4–6 
BE9 4 AN Moderate 4–6 
BE10 5 AP Simple 2–4 
BE11 6 AP Simple 4–6 
BE12 6 AP Simple 4–6 
BE13 7 AP Simple 4–6 
BE14 8 AP Simple 2–4 
BE15 8 AP Simple 4–6 
BE16 9 AP Simple 4–6 
BE17 9 AP Simple 2–4 
*BE18 10 AP Simple 4–6 
*BE19 10 AP Simple 4–6 
DI1 1 C Simple 4–6 
DI2 2 AP Simple 2–4 
DI3 6 AP Simple 6–8 
DI4 7, 8 K Simple 2–4 
EX1 1 C Simple 6–8 
EX2 1 AP Simple 4–6 
EX3 1 AP Simple 4–6 
EX4 2 C Simple 4–6 
EX5 3 AP Simple 6–8 
EX6 3 AP Simple 8–10 
EX7 3 AP Simple 10–12 
EX8 3 AP Simple 8–10 
EX9 4 AN Moderate 8–10 
EX10 4 AP Moderate 6–8 
Copyright © 2011 John Wiley & Sons, Inc. Weygandt, IFRS, 1/e, Solutions Manual (For Instructor Use Only) 9-3
PLANT ASSETS, NATURAL RESOURCES, AND INTANGIBLE 
ASSETS (Continued) 
Number SO BT Difficulty Time (min.) 
EX11 6 AP Moderate 8–10 
EX12 6 AP Moderate 10–12 
EX13 7 AP Simple 6–8 
EX14 8 AP Simple 4–6 
EX15 8 AP Simple 8–10 
EX16 9 AP Simple 2–4 
EX17 10 AP Moderate 8–10 
EX18 10 AP Moderate 8–10 
P1A 1 C Simple 20–30 
P2A 3 AP Simple 30–40 
P3A 3 AN Moderate 30–40 
P4A 3, 4 AP Moderate 20–30 
P5A 3, 6, 9 AP Moderate 40–50 
P6A 6 AP Simple 30–40 
P7A 8, 9 AP Moderate 30–40 
P8A 8 AP Moderate 30–40 
P9A 9 AN Moderate 5–10 
P1B 1 C Simple 20–30 
P2B 3 AP Simple 30–40 
P3B 3 AN Moderate 30–40 
P4B 3, 4 AP Moderate 20–30 
P5B 3, 6, 9 AP Moderate 40–50 
P6B 6 AP Simple 30–40 
P7B 8, 9 AP Moderate 30–40 
P8B 8 AP Moderate 30–40 
P9B 9 AN Moderate 5–10 
BYP1 3, 8 AN Simple 15–20 
BYP2 9 AN, E Simple 10–15 
BYP3 2, 3 C Simple 10–15 
BYP4 3 AP, E Moderate 20–25 
BYP5 7 C Simple 5–10 
BYP6 4 E Simple 10–15 
9-4 Copyright © 2011 John Wiley & Sons, Inc. Weygandt, IFRS, 1/e, Solutions Manual (For Instructor Use Only)
BLOOM’S TAXONOMY TABLE 
Copyright © 2011 John Wiley & Sons, Inc. Weygandt, IFRS, 1/e, Solutions Manual (For Instructor Use Only) 9-5 
Correlation Chart between Bloom’s Taxonomy, Study Objectives and End-of-Chapter Exercises and Problems 
Study Objective Knowledge Comprehension Application Analysis Synthesis Evaluation 
1. Describe how the cost principle 
applies to plant assets. 
Q9-1 
Q9-2 
Q9-3 
DI9-1 
E9-1 
P9-1A 
P9-1B 
BE9-1 
BE9-2 
E9-2 
E9-3 
2. Explain the concept of 
depreciation. 
Q9-5 Q9-4 
E9-4 
DI9-2 
3. Compute periodic depreciation 
using different methods. 
Q9-6 
Q9-7 
Q9-8 
Q9-24 
Q9-25 
Q9-26 
BE9-3 
BE9-4 
BE9-5 
BE9-6 
BE9-7 
E9-5 
E9-6 
E9-7 
E9-8 
P9-2A 
P9-4A 
P9-5A 
P9-2B 
P9-4B 
P9-5B 
P9-3A 
P9-3B 
BE9-4 
4. Describe the procedure for 
revising periodic depreciation. 
Q9-9 
Q9-10 
E9-10 
P9-4A 
P9-4B 
BE9-8 
BE9-9 
E9-9 
5. Distinguish between revenue and 
capital expenditures, and explain 
the entries for each. 
Q9-11 
Q9-27 
BE9-10 
6. Explain how to account for the 
disposal of a plant asset. 
Q9-12 Q9-13 BE9-11 
BE9-12 
DI9-3 
E9-11 
E9-12 
P9-5A 
P9-6A 
P9-5B 
P9-6B 
7. Compute periodic depletion of 
extractable natural resources. 
Q9-14 
DI9-4 
Q9-15 BE9-13 
E9-13 
8. Explain the basic issues related 
to accounting for intangible assets. 
Q9-20 Q9-16 
Q9-17 
Q9-18 
Q9-19 
Q9-21 
Q9-22 
DI9-4 
BE9-14 
BE9-15 
E9-14 
E9-15 
P9-7A 
P9-8A 
P9-7B 
P9-8B 
9. Indicate how plant assets, natural 
resources, and intangible assets 
are reported. 
Q9-23 
BE9-16 
BE9-17 
E9-16 
P9-5A 
P9-7A 
P9-5B 
P9-7B 
P9-9A 
P9-9B 
*10. Explain how to account for the 
exchange of plant assets. 
Q9-28 Q9-29 BE9-18 
BE9-19 
E9-17 
E9-18 
Broadening Your Perspective Exploring the Web 
Communication 
Decision Making Across 
the Organization 
Financial Reporting 
Comp. Analysis 
Comp. Analysis 
Decision Making 
Across the 
Organization 
Ethics Case
ANSWERS TO QUESTIONS 
1. For plant assets, the cost principle means that cost consists of all expenditures necessary to acquire 
the asset and make it ready for its intended use. 
2. Examples of land improvements include driveways, parking lots, fences, and underground sprinklers. 
3. (a) When only the land is to be used, all demolition and removal costs of the building less any 
proceeds from salvaged materials are necessary expenditures to make the land ready for its 
intended use. 
(b) When both the land and building are to be used, necessary costs of the building include 
remodeling expenditures and the cost of replacing or repairing the roofs, floors, wiring, and 
plumbing. 
4. You should explain to the president that depreciation is a process of allocating the cost of a plant 
asset to expense over its service (useful) life in a rational and systematic manner. Recognition of 
depreciation is not intended to result in the accumulation of cash for replacement of the asset. 
5. (a) Residual value, also called salvage value, is the expected value of the asset at the end of its 
useful life. 
(b) Residual value is used in determining depreciation in each of the methods except the declining-balance 
method. 
6. (a) Useful life is expressed in years under the straight-line method and in units of activity under 
the units-of-activity method. 
(b) The pattern of periodic depreciation expense over useful life is constant under the straight-line 
method and variable under the units-of-activity method. 
7. The effects of the three methods on annual depreciation expense are: Straight-line—constant 
amount; units of activity—varying amount; declining-balance—decreasing amounts. 
8. Component depreciation is a method of allocating the cost of a plant asset into separate 
parts based on the estimated useful lives of each component. IFRS requires an entity to 
use component depreciation whenever significant parts of a plant asset have significantly 
different useful lives. 
9. A revision of depreciation is made in current and future years but not retroactively. The rationale 
is that continual restatement of prior periods would adversely affect confidence in the financial 
statements. 
10. Revaluation is an accounting procedure that adjusts plant assets to fair value at the 
reporting date. Revaluation must be applied annually to assets that are experiencing rapid 
price changes. 
9-6 Copyright © 2011 John Wiley & Sons, Inc. Weygandt, IFRS, 1/e, Solutions Manual (For Instructor Use Only)
Questions Chapter 9 (Continued) 
11. Revenue expenditures are ordinary repairs made to maintain the operating efficiency and productive 
life of the asset. Capital expenditures are additions and improvements made to increase operating 
efficiency, productive capacity, or useful life of the asset. Revenue expenditures are recognized 
as expenses when incurred; capital expenditures are generally debited to the plant asset affected. 
12. In a sale of plant assets, the book value of the asset is compared to the proceeds received from the 
sale. If the proceeds of the sale exceed the book value of the plant asset, a gain on disposal occurs. If 
the proceeds of the sale are less than the book value of the plant asset sold, a loss on disposal occurs. 
13. The plant asset and its accumulated depreciation should continue to be reported on the 
statement of financial position without further depreciation adjustment until the asset is retired. 
Reporting the asset and related accumulated depreciation on the statement of financial position 
informs the reader of the financial statements that the asset is still in use. However, once an asset is 
fully depreciated, even if it is still being used, no additional depreciation should be taken. In no 
situation can the accumulated depreciation on the plant asset exceed its cost. 
14. Extractable natural resources consist of underground deposits of oil, gas, and minerals. These 
long-lived productive assets have two distinguishing characteristics: they are physically extracted 
in operations in or near the earth’s crust, and they are replaceable only by an act of nature. 
15. Depletion is the allocation of the cost of extractable resources to expense in a rational and 
systematic manner over the resource’s useful life. It is computed by multiplying the depletion cost 
per unit by the number of units extracted and sold. 
16. The terms depreciation, depletion, and amortization are all concerned with allocating the cost of 
an asset to expense over the periods benefited. Depreciation refers to allocating the cost of a 
plant asset to expense, depletion to recognizing the cost of an extractable resource as expense, 
and amortization to allocating the cost of an intangible asset to expense. 
17. The intern is not correct. The cost of an intangible asset should be amortized over that asset’s 
useful life (the period of time when operations are benefited by use of the asset). In addition, 
some intangibles have indefinite lives and therefore are not amortized at all. 
18. The favorable attributes which could result in goodwill include exceptional management, desirable 
location, good customer relations, skilled employees, high-quality products, and harmonious relations 
with labor unions. 
19. Goodwill is the value of many favorable attributes that are intertwined in the business enterprise. 
Goodwill can be identified only with the business as a whole and, unlike other assets, cannot be 
sold separately. Goodwill can only be sold if the entire business is sold. And, if goodwill appears 
on the statement of financial position, it means the company has purchased another company for 
more than the fair value of its net assets. 
Copyright © 2011 John Wiley & Sons, Inc. Weygandt, IFRS, 1/e, Solutions Manual (For Instructor Use Only) 9-7
Questions Chapter 9 (Continued) 
20. Goodwill is recorded only when there is a transaction that involves the purchase of an entire 
business. Goodwill is the excess of cost over the fair value of the net assets (assets less liabilities) 
acquired. The recognition of goodwill without an exchange transaction would lead to subjective 
valuations which would reduce the reliability of financial statements. 
21. Research and development costs present several accounting problems. It is sometimes difficult 
to assign the costs to specific projects, and there are uncertainties in identifying the extent and 
timing of future benefits. As a result, IFRS requires that research costs be recorded as an expense 
when incurred. Development costs incurred prior to technological feasibility are also expensed 
but development costs incurred after technological feasibility are capitalized. 
22. Both types of development expenditures relate to the creation of new products but one is 
expensed and the other is capitalized. Development costs incurred before a new product 
achieves technological feasibility are recorded as development expenses and appear as part 
of operating expenses on the income statement. 
Cost incurred after technological feasibility are recorded as development costs and appear as an 
intangible asset on the statement of financial position. 
23. McDonald’s asset turnover ratio is computed as follows: 
Net sales 
Average total assets 
= $20.5 billion 
$28.9 billion 
= .71 times 
24. Since Resco uses the straight-line depreciation method, its depreciation expense will be lower in 
the early years of an asset’s useful life as compared to using an accelerated method. Yapan’s 
depreciation expense in the early years of an asset’s useful life will be higher as compared to 
the straight-line method. Resco’s net income will be higher than Yapan’s in the first few years of 
the asset’s useful life. And, the reverse will be true late in an asset’s useful life. 
25. Yes, tax regulations often allow a company to use a different depreciation method on the tax 
return than is used in preparing financial statements. Lopez Corporation uses an accelerated 
depreciation method for tax purposes to minimize its income taxes and thereby the cash outflow 
for taxes. 
26. By selecting a longer estimated useful life, May Corp. is spreading the plant asset’s cost over a 
longer period of time. The depreciation expense reported in each period is lower and net income is 
higher. Won’s choice of a shorter estimated useful life will result in higher depreciation expense 
reported in each period and lower net income. 
27. Expensing these costs will make current period income lower but future period income higher because 
there will be no additional depreciation expense in future periods. If the costs are ordinary repairs, 
they should be expensed. 
9-8 Copyright © 2011 John Wiley & Sons, Inc. Weygandt, IFRS, 1/e, Solutions Manual (For Instructor Use Only)
Questions Chapter 9 (Continued) 
*28. When assets are exchanged, the gain or loss on disposal is computed as the difference between 
the book value and the fair value of the asset given up at the time of exchange. 
*29. Yes, Tatum should recognize a gain equal to the difference between the fair value of the old 
machine and its book value. If the fair value of the old machine is less than its book value, Tatum 
should recognize a loss equal to the difference between the two amounts. 
Copyright © 2011 John Wiley & Sons, Inc. Weygandt, IFRS, 1/e, Solutions Manual (For Instructor Use Only) 9-9
SOLUTIONS TO BRIEF EXERCISES 
BRIEF EXERCISE 9-1 
All of the expenditures should be included in the cost of the land. Therefore, 
the cost of the land is $81,000, or ($70,000 + $3,000 + $2,500 + $2,000 + $3,500). 
BRIEF EXERCISE 9-2 
The cost of the truck is £31,900 (cash price £30,000 + sales tax £1,500 + painting 
and lettering £400). The expenditures for insurance and motor vehicle license 
should not be added to the cost of the truck. 
BRIEF EXERCISE 9-3 
Depreciable cost of $36,000, or ($42,000 – $6,000). With a four-year useful life, 
annual depreciation is $9,000, or ($36,000 ÷ 4). Under the straight-line method, 
depreciation is the same each year. Thus, depreciation is $9,000 for both the 
first and second years. 
BRIEF EXERCISE 9-4 
It is likely that management requested this accounting treatment to boost 
reported net income. Land is not depreciated; thus, by reporting land 
at HK$1,200,000 above its actual value the company increased yearly 
HK$1,200,000 
income by HK$60,000, 
20 years 
 
  
 
  or the reduction in depreciation 
expense. This practice is not ethical because management is knowingly 
misstating asset values. 
BRIEF EXERCISE 9-5 
The declining balance rate is 50%, or (25% X 2) and this rate is applied to book 
value at the beginning of the year. The computations are: 
Book Value X Rate = Depreciation 
Year 1 
Year 2 
$42,000 
($42,000 – $21,000) 
50% 
50% 
$21,000 
$10,500 
9-10 Copyright © 2011 John Wiley & Sons, Inc. Weygandt, IFRS, 1/e, Solutions Manual (For Instructor Use Only)
BRIEF EXERCISE 9-6 
The depreciation cost per unit is 22 cents per mile computed as follows: 
Depreciable cost ($33,500 – $500) ÷ 150,000 = $.22 
Year 1 30,000 miles X $.22 = $6,600 
Year 2 20,000 miles X $.22 = $4,400 
BRIEF EXERCISE 9-7 
Warehouse component: ($280,000 – $40,000)/20 = $12,000 
HVAC component: $40,000/10 = $4,000 
Total component depreciation in first year $16,000 
BRIEF EXERCISE 9-8 
Book value, 1/1/11......................................................................................... €20,000 
Less: Salvage value .................................................................................... 2,000 
Depreciable cost............................................................................................ €18,000 
Remaining useful life ................................................................................... 4 years 
Revised annual depreciation (€18,000 ÷ 4)........................................... € 4,500 
BRIEF EXERCISE 9-9 
(a) Accumulated Depreciation—Plant Assets .................. 60,000 
Plant Assets.................................................................. 20,000 
Revaluation Surplus .................................................. 40,000 
(To record revaluation of plant assets) 
(b) Accumulated Depreciation—Plant Assets .................. 60,000 
Revaluation Surplus ........................................................... 20,000 
Plant Assets.................................................................. 80,000 
(To record revaluation of plant assets) 
Copyright © 2011 John Wiley & Sons, Inc. Weygandt, IFRS, 1/e, Solutions Manual (For Instructor Use Only) 9-11
BRIEF EXERCISE 9-10 
1. Repair Expense.................................................................... 45 
Cash................................................................................ 45 
2. Delivery Truck ...................................................................... 400 
Cash................................................................................ 400 
BRIEF EXERCISE 9-11 
(a) Accumulated Depreciation—Delivery 
Equipment ......................................................................... 41,000 
Delivery Equipment.................................................... 41,000 
(b) Accumulated Depreciation—Delivery 
Equipment ......................................................................... 39,000 
Loss on Disposal................................................................. 2,000 
Delivery Equipment.................................................... 41,000 
Cost of delivery equipment CHF41,000 
Less accumulated depreciation 39,000 
Book value at date of disposal 2,000 
Proceeds from sale 0 
Loss on disposal CHF 2,000 
BRIEF EXERCISE 9-12 
(a) Depreciation Expense—Office Equipment.................. 5,250 
Accumulated Depreciation—Office 
Equipment ................................................................ 5,250 
(b) Cash......................................................................................... 20,000 
Accumulated Depreciation—Office Equipment......... 47,250 
Loss on Disposal................................................................. 4,750 
Office Equipment........................................................ 72,000 
9-12 Copyright © 2011 John Wiley & Sons, Inc. Weygandt, IFRS, 1/e, Solutions Manual (For Instructor Use Only)
BRIEF EXERCISE 9-12 (Continued) 
Cost of office equipment $72,000 
Less accumulated depreciation 47,250* 
Book value at date of disposal 24,750 
Proceeds from sale 20,000 
Loss on disposal $ 4,750 
*$42,000 + $5,250 
BRIEF EXERCISE 9-13 
(a) Depletion cost per unit = ¥7,000,000 ÷ 35,000,000 = ¥.20 depletion cost 
per ton 
¥.20 X 6,000,000 = ¥1,200,000 
Depletion Expense.............................................. 1,200,000 
Accumulated Depletion............................ 1,200,000 
(b) Ore mine................................................................. ¥7,000,000 
Less: Accumulated depletion ........................ 1,200,000 ¥5,800,000 
BRIEF EXERCISE 9-14 
(a) Amortization Expense—Patent (R$120,000 ÷ 10)....... 12,000 
Patents............................................................................. 12,000 
(b) Intangible Assets 
Patents............................................................................. R$108,000 
Copyright © 2011 John Wiley & Sons, Inc. Weygandt, IFRS, 1/e, Solutions Manual (For Instructor Use Only) 9-13
BRIEF EXERCISE 9-15 
Research Expense ....................................................................... 300,000 
Development Expense................................................................ 400,000 
Development Costs...................................................................... 200,000 
Cash......................................................................................... 900,000 
(To record research and development costs) 
BRIEF EXERCISE 9-16 
SPAIN COMPANY 
Statement of Financial Position (partial) 
December 31, 2011 
Intangible assets 
Goodwill..................................................... $410,000 
Property, plant, and equipment 
Coal mine .................................................. $ 500,000 
Less: Accumulated depletion............ 108,000 $392,000 
Buildings ................................................... 1,100,000 
Less: Accumulated depreciation ..... 650,000 450,000 
Total property, plant, and 
equipment.................................... 842,000 
BRIEF EXERCISE 9-17 
$61.5 ÷ 
$37.3 + $44.6 
2 
 
  
 
  
= 1.50 times 
*BRIEF EXERCISE 9-18 
Delivery Equipment (new).......................................................... 24,000 
Accumulated Depreciation—Delivery Equipment ............. 30,000 
Loss on Disposal.......................................................................... 12,000 
Delivery Equipment (old) .................................................. 61,000 
Cash......................................................................................... 5,000 
9-14 Copyright © 2011 John Wiley & Sons, Inc. Weygandt, IFRS, 1/e, Solutions Manual (For Instructor Use Only)
*BRIEF EXERCISE 9-18 (Continued) 
Fair value of old delivery 
equipment $19,000 
Cash paid 5,000 
Cost of new delivery equipment $24,000 
Fair value of old delivery 
equipment $19,000 
Book value of old delivery 
equipment ($61,000 – $30,000) 31,000 
Loss on disposal $12,000 
*BRIEF EXERCISE 9-19 
Delivery Equipment (new) ......................................................... 43,000 
Accumulated Depreciation—Delivery Equipment............. 30,000 
Gain on Disposal................................................................. 7,000 
Delivery Equipment (old).................................................. 61,000 
Cash......................................................................................... 5,000 
Fair value of old delivery 
equipment $38,000 
Cash paid 5,000 
Cost of new delivery equipment $43,000 
Fair value of old delivery 
equipment $38,000 
Book value of old delivery 
equipment ($61,000 – $30,000) 31,000 
Gain on disposal $ 7,000 
Copyright © 2011 John Wiley & Sons, Inc. Weygandt, IFRS, 1/e, Solutions Manual (For Instructor Use Only) 9-15
SOLUTIONS FOR DO IT! REVIEW EXERCISES 
DO IT! 9-1 
The following four items are expenditures necessary to acquire the truck 
and get it ready for use: 
Negotiated purchase price ....................................................... £24,000 
Installation of special shelving ............................................... 1,100 
Painting and lettering................................................................. 900 
Sales tax ......................................................................................... 1,300 
Total paid............................................................................... £27,300 
Thus, the cost of the truck is £27,300. The payments for the motor vehicle 
license and for the insurance are operating costs and are expensed in the 
first year of the truck’s life. 
DO IT! 9-2 
Depreciation expense = Cost – Residual value $15,000 – $1,000 
Useful life 
= 
8 years 
= $1,750 
The entry to record the first year’s depreciation would be: 
Depreciation Expense................................................................ 1,750 
Accumulated Depreciation ................................................ 1,750 
(To record annual depreciation on mower) 
DO IT! 9-3 
(a) Sale of truck for cash at a gain: 
Cash........................................................................................ 26,000 
Accumulated Depreciation—Truck................................ 28,000 
Truck................................................................................ 50,000 
Gain on Disposal.......................................................... 4,000 
9-16 Copyright © 2011 John Wiley & Sons, Inc. Weygandt, IFRS, 1/e, Solutions Manual (For Instructor Use Only)
DO IT! 9-3 (Continued) 
(b) Sale of truck for cash at a loss: 
Cash........................................................................................ 15,000 
Loss on Disposal ................................................................ 7,000 
Accumulated Depreciation—Truck ............................... 28,000 
Truck ............................................................................... 50,000 
DO IT! 9-4 
1. b. Intangible assets 
2. d. Amortization 
3. e. Franchise 
4. f. Development costs 
5. a. Goodwill 
6. c. Development expenses 
Copyright © 2011 John Wiley & Sons, Inc. Weygandt, IFRS, 1/e, Solutions Manual (For Instructor Use Only) 9-17
SOLUTIONS TO EXERCISES 
EXERCISE 9-1 
(a) Under the cost principle, the acquisition cost for a plant asset includes 
all expenditures necessary to acquire the asset and make it ready for its 
intended use. For example, the cost of factory machinery includes the 
purchase price, freight costs paid by the purchaser, insurance costs 
during transit, and installation costs. 
(b) 1. Land 
2. Factory Machinery 
3. Delivery Equipment 
4. Land Improvements 
5. Delivery Equipment 
6. Factory Machinery 
7. Prepaid Insurance 
8. License Expense 
EXERCISE 9-2 
1. Factory Machinery 
2. Truck 
3. Factory Machinery 
4. Land 
5. Prepaid Insurance 
6. Land Improvements 
7. Land Improvements 
8. Land 
9. Building 
9-18 Copyright © 2011 John Wiley & Sons, Inc. Weygandt, IFRS, 1/e, Solutions Manual (For Instructor Use Only)
EXERCISE 9-3 
(a) Cost of land 
Cash paid ................................................................................. €80,000 
Net cost of removing warehouse 
(€8,600 – €1,700) ................................................................ 6,900 
Attorney’s fee ......................................................................... 1,100 
Real estate broker’s fee ...................................................... 5,000 
Total .................................................................................. €93,000 
(b) The architect’s fee (€7,800) should be debited to the Building account. 
The cost of the driveways and parking lot (€14,000) should be debited 
to Land Improvements. 
EXERCISE 9-4 
1. False. Depreciation is a process of cost allocation, not asset valuation. 
2. True. 
3. False. The book value of a plant asset may be quite different from its 
fair value. 
4. False. Depreciation applies to three classes of plant assets: land improve-ments, 
buildings, and equipment. 
5. False. Depreciation does not apply to land because its usefulness and 
revenue-producing ability generally remain intact over time. 
6. True. 
7. False. Recognizing depreciation on an asset does not result in an accu-mulation 
of cash for replacement of the asset. 
8. True. 
9. False. Depreciation expense is reported on the income statement, and 
accumulated depreciation is reported as a deduction from plant assets on 
the statement of financial position. 
10. False. Three factors affect the computation of depreciation: cost, useful 
life, and residual value (also called salvage value). 
Copyright © 2011 John Wiley & Sons, Inc. Weygandt, IFRS, 1/e, Solutions Manual (For Instructor Use Only) 9-19
EXERCISE 9-5 
(a) Depreciation cost per unit is R$1.60 per mile 
[(R$168,000 – R$8,000) ÷ 100,000]. 
(b) Computation End of Year 
Year 
Units of 
Activity X 
Depreciation 
Cost /Unit = 
Annual 
Depreciation 
Expense 
Accumulated 
Depreciation 
Book 
Value 
2011 
2012 
2013 
2014 
26,000 
32,000 
25,000 
17,000 
R$1.60 
1.60 
1.60 
1.60 
R$41,600 
51,200 
40,000 
27,200 
R$ 41,600 
92,800 
132,800 
160,000 
R$126,400 
75,200 
35,200 
8,000 
EXERCISE 9-6 
(a) Straight-line method: 
$120,000 – $12,000 
5 
 
  
 
  
= $21,600 per year. 
2011 depreciation = $21,600 X 3/12 = $5,400. 
(b) Units-of-activity method: 
$120,000 – $12,000 
10,000 
 
  
 
  
= $10.80 per hour. 
2011 depreciation = 1,700 hours X $10.80 = $18,360. 
(c) Declining-balance method: 
2011 depreciation = $120,000 X 40% X 3/12 = $ 12,000. 
Book value January 1, 2012 = $120,000 – $12,000 = $108,000. 
2012 depreciation = $108,000 X 40% = $ 43,200. 
9-20 Copyright © 2011 John Wiley & Sons, Inc. Weygandt, IFRS, 1/e, Solutions Manual (For Instructor Use Only)
EXERCISE 9-7 
(a) (1) 2011: (R$30,000 – R$2,000)/8 = R$3,500 
2012: (R$30,000 – R$2,000)/8 = R$3,500 
(2) (R$30,000 – R$2,000)/100,000 = R$0.28 per mile 
2011: 15,000 X R$0.28 = R$4,200 
2012: 12,000 X R$0.28 = R$3,360 
(3) 2011: R$30,000 X 25% = R$7,500 
2012: (R$30,000 – R$7,500) X 25% = R$5,625 
(b) (1) Depreciation Expense.................................................. 3,500 
Accumulated Depreciation—Delivery Truck........ 3,500 
(2) Delivery Truck ................................................................ R$30,000 
Less: Accumulated Depreciation............................ 3,500 
R$26,500 
EXERCISE 9-8 
Building depreciation: $1,920,000*/40 years = $ 48,000 
Personal property depreciation: $300,000/5 years = 60,000 
Land improvements depreciation: $180,000/10 years = 18,000 
Total component depreciation $126,000 
*$2,400,000 – $300,000 – $180,000 = $1,920,000 
EXERCISE 9-9 
(a) Type of Asset Building Warehouse 
Book value, 1/1/11 
Less: Residual value 
Depreciable cost 
Remaining useful life in years 
Revised annual depreciation 
(a) ÷ (b) 
(a) 
(b) 
$686,000 
37,000 
$649,000 
44 
$ 14,750 
$75,000 
3,600 
$71,400 
15 
$ 4,760 
Copyright © 2011 John Wiley & Sons, Inc. Weygandt, IFRS, 1/e, Solutions Manual (For Instructor Use Only) 9-21
EXERCISE 9-9 (Continued) 
(b) Dec. 31 Depreciation Expense—Building............... 14,750 
Accumulated Depreciation— 
Building................................................. 14,750 
EXERCISE 9-10 
(a) Depreciation Expense........................................................ 70,000 
Accumulated Depreciation—Plant Assets.......... 70,000 
(To record depreciation expense) 
(b) Accumulated Depreciation—Plant Assets.................. 70,000 
Plant Assets.................................................................. 30,000 
Revaluation Surplus................................................... 40,000 
(To adjust the plant assets to fair value and 
record revaluation surplus) 
(c) Depreciation Expense........................................................ 80,000* 
Accumulated Depreciation—Plant Assets.......... 80,000 
(To record depreciation expense) 
*$350,000 – $30,000 = $320,000; $320,000/4 years = $80,000 
EXERCISE 9-11 
Jan. 1 Accumulated Depreciation—Machinery .......... 62,000 
Machinery.......................................................... 62,000 
June 30 Depreciation Expense............................................ 4,000 
Accumulated Depreciation—Computer 
(£40,000 X 1/5 X 6/12) ................................ 4,000 
30 Cash............................................................................. 14,000 
Accumulated Depreciation—Computer 
(£40,000 X 3/5 = £24,000; 
£24,000 + £4,000)...................................................... 28,000 
Gain on Disposal 
[£14,000 – (£40,000 – £28,000)] .............. 2,000 
Computer........................................................... 40,000 
9-22 Copyright © 2011 John Wiley & Sons, Inc. Weygandt, IFRS, 1/e, Solutions Manual (For Instructor Use Only)
EXERCISE 9-11 (Continued) 
Dec. 31 Depreciation Expense ........................................... 6,000 
Accumulated Depreciation—Truck 
[(£39,000 – £3,000) X 1/6]......................... 6,000 
31 Loss on Disposal .................................................... 9,000 
Accumulated Depreciation—Truck 
[(£39,000 – £3,000) X 5/6].................................. 30,000 
Delivery Truck ................................................. 39,000 
EXERCISE 9-12 
(a) Cash...................................................................................... 28,000 
Accumulated Depreciation—Equipment 
[($50,000 – $5,000) X 3/5] .......................................... 27,000 
Equipment................................................................. 50,000 
Gain on Disposal .................................................... 5,000 
(b) Depreciation Expense 
[($50,000 – $5,000) X 1/5 X 4/12] .............................. 3,000 
Accumulated Depreciation—Equipment........ 3,000 
Cash...................................................................................... 28,000 
Accumulated Depreciation—Equipment 
($27,000 + $3,000)......................................................... 30,000 
Equipment................................................................ 50,000 
Gain on Disposal ................................................... 8,000 
(c) Cash ........................................................................................ 11,000 
Accumulated Depreciation—Equipment..................... 27,000 
Loss on Disposal ................................................................ 12,000 
Equipment..................................................................... 50,000 
Copyright © 2011 John Wiley & Sons, Inc. Weygandt, IFRS, 1/e, Solutions Manual (For Instructor Use Only) 9-23
EXERCISE 9-12 (Continued) 
(d) Depreciation Expense 
[($50,000 – $5,000) ÷ 5 X 9/12]..................................... 6,750 
Accumulated Depreciation—Equipment............. 6,750 
Cash......................................................................................... 11,000 
Accumulated Depreciation—Equipment 
($27,000 + $6,750)............................................................ 33,750 
Loss on Disposal................................................................. 5,250 
Equipment ..................................................................... 50,000 
EXERCISE 9-13 
(a) Dec. 31 Depletion Expense.......................................... 90,000 
Accumulated Depletion 
(100,000 X CHF.90) ............................ 90,000 
Cost (a) CHF720,000 
Units estimated (b) 800,000 tons 
Depletion cost per unit [(a) ÷ (b)] CHF.90 
(b) The costs pertaining to the unsold units are reported in current assets as 
part of inventory (20,000 X CHF.90 = CHF18,000). 
EXERCISE 9-14 
Dec. 31 Amortization Expense—Patent ....................... 12,000 
Patents ($90,000 ÷ 5 X 8/12)..................... 12,000 
Note: No entry is made to amortize goodwill because it has an indefinite life. 
9-24 Copyright © 2011 John Wiley & Sons, Inc. Weygandt, IFRS, 1/e, Solutions Manual (For Instructor Use Only)
EXERCISE 9-15 
1/2/11 Patents .................................................................... 560,000 
Cash................................................................ 560,000 
4/1/11 Goodwill.................................................................. 360,000 
Cash................................................................ 360,000 
(Part of the entry to record 
purchase of another company) 
7/1/11 Franchise................................................................ 440,000 
Cash................................................................ 440,000 
9/1/11 Research Expense .............................................. 185,000 
Cash................................................................ 185,000 
11/1/11 Development Expense....................................... 225,000 
Cash................................................................ 225,000 
12/31/11 Amortization Expense—Patent 
($560,000 ÷ 7) .................................................... 80,000 
Amortization Expense—Franchise 
[($440,000 ÷ 10) X 1/2] .................................... 22,000 
Patents....................................................... 80,000 
Franchise .................................................. 22,000 
Ending balances, 12/31/11: 
Patent = $480,000 ($560,000 – $80,000). 
Goodwill = $360,000 
Franchise = $418,000 ($440,000 – $22,000). 
EXERCISE 9-16 
Asset turnover ratio = 
$4,900,000 
$1,400,000 
= 3.5 times 
Copyright © 2011 John Wiley & Sons, Inc. Weygandt, IFRS, 1/e, Solutions Manual (For Instructor Use Only) 9-25
*EXERCISE 9-17 
(a) Trucks (new).......................................................................... 53,000 
Accumulated Depreciation—Trucks (old) ................... 22,000 
Loss on Disposal................................................................. 6,000 
Trucks (old)................................................................... 64,000 
Cash ................................................................................ 17,000 
Cost of old trucks £64,000 
Less: Accumulated depreciation 22,000 
Book value 42,000 
Fair value of old trucks 36,000 
Loss on disposal £ 6,000 
Fair value of old trucks £36,000 
Cash paid 17,000 
Cost of new trucks £53,000 
(b) Machine (new)....................................................................... 12,000 
Accumulated Depreciation—Machine (old) ................ 4,000 
Gain on Disposal ........................................................ 1,000 
Machine (old)................................................................ 12,000 
Cash ................................................................................ 3,000 
Cost of old machine £12,000 
Less: Accumulated depreciation 4,000 
Book value 8,000 
Fair value of old 
machine 9,000 
Gain on disposal £ 1,000 
Fair value of old 
machine £ 9,000 
Cash paid 3,000 
Cost of new machine £12,000 
9-26 Copyright © 2011 John Wiley & Sons, Inc. Weygandt, IFRS, 1/e, Solutions Manual (For Instructor Use Only)
*EXERCISE 9-18 
(a) Delivery Truck (new) .......................................................... 4,000 
Loss on Disposal................................................................. 3,000 
Accumulated Depreciation—Delivery 
Truck (old)......................................................................... 15,000 
Delivery Truck (old) ................................................... 22,000 
Cost of old truck $22,000 
Less: Accumulated depreciation 15,000 
Book value 7,000 
Fair value of old truck 4,000 
Loss on disposal $ 3,000 
(b) Delivery Truck (new) .......................................................... 4,000 
Accumulated Depreciation—Delivery 
Trucks (old)....................................................................... 8,000 
Delivery Truck (old) ................................................... 10,000 
Gain on Disposal........................................................ 2,000 
Cost of old truck $10,000 
Less: Accumulated depreciation 8,000 
Book value 2,000 
Fair value of old truck 4,000 
Gain on Disposal $ 2,000 
Cost of new delivery truck* $ 4,000 
*Fair value of old truck 
Copyright © 2011 John Wiley & Sons, Inc. Weygandt, IFRS, 1/e, Solutions Manual (For Instructor Use Only) 9-27
SOLUTIONS TO PROBLEMS 
PROBLEM 9-1A 
Item Land Building Other Accounts 
1 
€ 4,000) 
2 
3 
4 
( 145,000) 
5 
6 
7 
( 2,000) 
8 
9 
( 15,000) 
10 
(3,500) 
(€162,500) 
€700,000 
35,000 
10,000 
€745,000 
€ 5,000 Property Taxes Expense 
14,000 Land Improvements 
9-28 Copyright © 2011 John Wiley & Sons, Inc. Weygandt, IFRS, 1/e, Solutions Manual (For Instructor Use Only)
PROBLEM 9-2A 
(a) 
Year Computation 
Accumulated 
Depreciation 
12/31 
BUS 1 
2009 
2010 
2011 
$ 90,000 X 20% = $18,000 
$ 18,000 
36,000 
54,000 
BUS 2 
2009 
2010 
2011 
$120,000 X 50% = $60,000 
$ 60,000 X 50% = $30,000 
$ 30,000 X 50% = $15,000 
$ 60,000 
90,000 
105,000 
BUS 3 
2010 
2011 
24,000 miles X $.60* = $14,400 
34,000 miles X $.60* = $20,400 
$ 14,400 
34,800 
*$72,000 ÷ 120,000 miles = $.60 per mile. 
(b) Year Computation Expense 
BUS 2 
1. 
2. 
2009 
2010 
$120,000 X 50% X 9/12 = $45,000 
$75,000 X 50% = $37,500 
$45,000 
$37,500 
Copyright © 2011 John Wiley & Sons, Inc. Weygandt, IFRS, 1/e, Solutions Manual (For Instructor Use Only) 9-29
PROBLEM 9-3A 
(a) 1. Purchase price.......................................................................... R$ 38,000 
Sales tax ..................................................................................... 1,700 
Shipping costs.......................................................................... 150 
Insurance during shipping ................................................... 80 
Installation and testing .......................................................... 70 
Total cost of machine.................................................... R$ 40,000 
Machine.......................................................................... 40,000 
Cash ....................................................................... 40,000 
2. Recorded cost........................................................................... R$ 40,000 
Less: Residual value ............................................................. 5,000 
Depreciable cost ...................................................................... R$ 35,000 
Years of useful life................................................................... ÷ 5 
Annual depreciation....................................................... R$ 7,000 
Depreciation Expense............................................... 7,000 
Accumulated Depreciation ............................. 7,000 
(b) 1. Recorded cost........................................................................... 160,000 
Less: Residual value ............................................................. 10,000 
Depreciable cost ...................................................................... R$150,000 
Years of useful life................................................................... ÷ 4 
Annual depreciation....................................................... R$ 37,500 
2. 
Year 
Book Value at 
Beginning of 
Year DDB Rate 
Annual 
Depreciation 
Expense 
Accumulated 
Depreciation 
2011 
2012 
2013 
2014 
R$160,000 
80,000 
40,000 
20,000 
*50%* 
*50%* 
*50%* 
*50%* 
R$80,000 
40,000 
20,000 
10,000 
R$ 80,000 
120,000 
140,000 
150,000 
**100% ÷ 4-year useful life = 25% X 2 = 50%. 
9-30 Copyright © 2011 John Wiley & Sons, Inc. Weygandt, IFRS, 1/e, Solutions Manual (For Instructor Use Only)
PROBLEM 9-3A (Continued) 
3. Depreciation cost per unit = (R$160,000 – R$10,000)/125,000 units = 
R$1.20 per unit. 
Annual Depreciation Expense 
2011: R$1.20 X 45,000 = R$54,000 
2012: 1.20 X 35,000 = 42,000 
2013: 1.20 X 25,000 = 30,000 
2014: 1.20 X 20,000 = 24,000 
(c) The declining-balance method reports the highest amount of depreciation 
expense the first year while the straight-line method reports the lowest. 
In the fourth year, the straight-line method reports the highest amount of 
depreciation expense while the declining-balance method reports the 
lowest. 
These facts occur because the declining-balance method is an acceler-ated 
depreciation method in which the largest amount of depreciation 
is recognized in the early years of the asset’s life. If the straight-line 
method is used, the same amount of depreciation expense is recognized 
each year. Therefore, in the early years less depreciation expense will be 
recognized under this method than under the declining-balance method 
while more will be recognized in the later years. 
The amount of depreciation expense recognized using the units-of-activity 
method is dependent on production, so this method could recognize more 
or less depreciation expense than the other two methods in any year 
depending on output. 
No matter which of the three methods is used, the same total amount 
of depreciation expense will be recognized over the four-year period. 
Copyright © 2011 John Wiley & Sons, Inc. Weygandt, IFRS, 1/e, Solutions Manual (For Instructor Use Only) 9-31
PROBLEM 9-4A 
Year 
Depreciation 
Expense 
Accumulated 
Depreciation 
2009 
2010 
2011 
2012 
2013 
2014 
2015 
(b)$13,500(a) 
13,500 
(b)10,800(b) 
10,800 
10,800 
12,800(c) 
12,800 
$13,500 
27,000 
37,800 
48,600 
59,400 
72,200 
85,000 
(a) $90,000 – $9,000 
6 years 
= $13,500 
(b)Book value – Residual value 
Remaining useful life 
= 
$63,000 – $9,000 
5 years 
= $10,800 
(c) $30,600 – $5,000 
2 years 
= $12,800 
9-32 Copyright © 2011 John Wiley & Sons, Inc. Weygandt, IFRS, 1/e, Solutions Manual (For Instructor Use Only)
PROBLEM 9-5A 
(a) Apr. 1 Land .......................................................... 2,130,000 
Cash ................................................. 2,130,000 
May 1 Depreciation Expense......................... 26,000 
Accumulated Depreciation— 
Equipment 
(€780,000 X 1/10 X 4/12)......... 26,000 
1 Cash.......................................................... 450,000 
Accumulated Depreciation— 
Equipment .......................................... 338,000 
Equipment...................................... 780,000 
Gain on Disposal ......................... 8,000 
Cost €780,000 
Accum. depreciation— 
equipment 338,000 
[(€780,000 X 1/10 X 4) + 
€26,000] 
Book value 442,000 
Cash proceeds 450,000 
Gain on disposal € 8,000 
June 1 Cash.......................................................... 1,500,000 
Land ................................................. 400,000 
Gain on Disposal ......................... 1,100,000 
July 1 Equipment............................................... 2,000,000 
Cash ................................................. 2,000,000 
Dec. 31 Depreciation Expense......................... 50,000 
Accumulated Depreciation— 
Equipment 
(€500,000 X 1/10)...................... 50,000 
31 Accumulated Depreciation— 
Equipment .......................................... 500,000 
Equipment...................................... 500,000 
Copyright © 2011 John Wiley & Sons, Inc. Weygandt, IFRS, 1/e, Solutions Manual (For Instructor Use Only) 9-33
PROBLEM 9-5A (Continued) 
Cost €500,000 
Accum. depreciation— 
equipment 500,000 
(€500,000 X 1/10 X 10) 
Book value € 0 
(b) Dec. 31 Depreciation Expense ........................ 570,000 
Accumulated Depreciation— 
Buildings ................................... 570,000 
(€28,500,000 X 1/50) 
31 Depreciation Expense ........................ 4,772,000 
Accumulated Depreciation— 
Equipment................................. 4,772,000 
(€46,720,000* X 1/10) €4,672,000 
[(€2,000,000 X 1/10) X 6/12] 100,000 
€4,772,000 
*(€48,000,000 – €780,000 – €500,000) 
(c) JIMENEZ COMPANY 
Partial Statement of Financial Position 
December 31, 2012 
Plant Assets* 
Land .............................................................. € 5,730,000 
Buildings ..................................................... €28,500,000 
Less: Accumulated depreciation— 
buildings ........................................ 12,670,000 15,830,000 
Equipment................................................... 48,720,000 
Less: Accumulated depreciation— 
equipment...................................... 9,010,000 39,710,000 
Total...................................................... €61,270,000 
*See T-accounts which follow. 
9-34 Copyright © 2011 John Wiley & Sons, Inc. Weygandt, IFRS, 1/e, Solutions Manual (For Instructor Use Only)
PROBLEM 9-5A (Continued) 
Land 
Bal. 4,000,000 
Apr. 1 2,130,000 
June 1 400,000 
Bal. 5,730,000 
Buildings 
Bal. 28,500,000 
Bal. 28,500,000 
Accumulated Depreciation—Buildings 
Bal. 12,100,000 
Dec. 31 adj. 570,000 
Bal. 12,670,000 
Equipment 
Bal. 48,000,000 
July 1 2,000,000 
May 1 780,000 
Dec. 31 500,000 
Bal. 48,720,000 
Accumulated Depreciation—Equipment 
May 1 338,000 
Dec. 31 500,000 
Bal. 5,000,000 
May 1 26,000 
Dec. 31 50,000 
Dec. 31 adj. 4,772,000 
Bal. 9,010,000 
Copyright © 2011 John Wiley & Sons, Inc. Weygandt, IFRS, 1/e, Solutions Manual (For Instructor Use Only) 9-35
PROBLEM 9-6A 
(a) Accumulated Depreciation—Office 
Furniture............................................................................. 50,000 
Loss on Disposal................................................................. 25,000 
Office Furniture ........................................................... 75,000 
(b) Cash......................................................................................... 21,000 
Accumulated Depreciation—Office 
Furniture............................................................................. 50,000 
Loss on Disposal................................................................. 4,000 
Office Furniture ........................................................... 75,000 
(c) Cash......................................................................................... 31,000 
Accumulated Depreciation—Office 
Furniture............................................................................. 50,000 
Gain on Disposal ........................................................ 6,000 
Office Furniture ........................................................... 75,000 
9-36 Copyright © 2011 John Wiley & Sons, Inc. Weygandt, IFRS, 1/e, Solutions Manual (For Instructor Use Only)
PROBLEM 9-7A 
(a) Jan. 2 Patents ............................................................... 45,000 
Cash ........................................................... 45,000 
Jan.– Research 
June Expense......................................................... 140,000 
Cash ........................................................... 140,000 
Sept. 1 Advertising Expense ..................................... 50,000 
Cash ........................................................... 50,000 
Oct. 1 Franchise........................................................... 100,000 
Cash ........................................................... 100,000 
(b) Dec. 31 Amortization Expense—Patents................ 12,000 
Patents ...................................................... 12,000 
[($70,000 X 1/10) + ($45,000 X 1/9)] 
31 Amortization Expense—Franchise........... 5,300 
Franchise.................................................. 5,300 
[($48,000 X 1/10) + 
($100,000 X 1/50 X 3/12)] 
(c) Intangible Assets 
Patents ($115,000 cost – $19,000 amortization) (1) ................ $ 96,000 
Franchise ($148,000 cost – $24,500 amortization) (2)............ 123,500 
Total intangible assets ............................................................ $219,500 
(1) Cost ($70,000 + $45,000); amortization ($7,000 + $12,000). 
(2) Cost ($48,000 + $100,000); amortization ($19,200 + $5,300). 
Copyright © 2011 John Wiley & Sons, Inc. Weygandt, IFRS, 1/e, Solutions Manual (For Instructor Use Only) 9-37
PROBLEM 9-8A 
1. Research Expense .......................................................... 86,000 
Development Expense................................................... 50,000 
Patents ....................................................................... 136,000 
Patents ................................................................................ 6,800 
Amortization Expense—Patents 
[$9,800 – ($60,000 X 1/20)]............................... 6,800 
2. Goodwill.............................................................................. 920 
Amortization Expense—Goodwill ..................... 920 
Note: Goodwill should not be amortized because it has an indefinite life unlike 
Patents. 
9-38 Copyright © 2011 John Wiley & Sons, Inc. Weygandt, IFRS, 1/e, Solutions Manual (For Instructor Use Only)
PROBLEM 9-9A 
(a) Luó Zhào 
Asset turnover 
ratio 
HK$1,200,000 
HK$2,500,000 
= .48 times 
HK$1,080,000 
HK$2,000,000 
= .54 times 
(b) Based on the asset turnover ratio, Zhào is more effective in using assets 
to generate sales. Its asset turnover ratio is almost 13% higher than Luó’s 
ratio. 
Copyright © 2011 John Wiley & Sons, Inc. Weygandt, IFRS, 1/e, Solutions Manual (For Instructor Use Only) 9-39
PROBLEM 9-1B 
Item Land Building Other Accounts 
1 
($ 5,000) 
2 
3 
4 
5 
100,000 
6 
7 
8 
9 
10 
( 17,000) 
( (3,500) 
($118,500) 
$500,000 
19,000 
9,000 
$528,000 
$ 7,500 Property Taxes Expense 
18,000 Land Improvements 
6,000 Land Improvements 
9-40 Copyright © 2011 John Wiley & Sons, Inc. Weygandt, IFRS, 1/e, Solutions Manual (For Instructor Use Only)
PROBLEM 9-2B 
(a) 
Year Computation 
Accumulated 
Depreciation 
12/31 
MACHINE 1 
2009 
2010 
2011 
¥100,000 X 10% = ¥10,000 
¥10,000 
20,000 
30,000 
MACHINE 2 
2009 
2010 
2011 
¥150,000 X 25% = ¥37,500 
¥112,500 X 25% = ¥28,125 
¥ 84,375 X 25% = ¥21,094 
¥37,500 
65,625 
86,719 
MACHINE 3 
2011 2,000 X (¥85,000 ÷ 25,000) = ¥6,800 ¥ 6,800 
(b) Year Depreciation Computation Expense 
MACHINE 2 
1. 
2. 
2009 
2010 
¥150,000 X 25% X 8/12 = ¥25,000 
¥125,000 X 25% = ¥31,250 
¥25,000 
¥31,250 
Copyright © 2011 John Wiley & Sons, Inc. Weygandt, IFRS, 1/e, Solutions Manual (For Instructor Use Only) 9-41
PROBLEM 9-3B 
(a) 1. Purchase price.............................................................................. $ 55,000 
Sales tax ......................................................................................... 2,750 
Shipping costs.............................................................................. 100 
Insurance during shipping ....................................................... 75 
Installation and testing .............................................................. 75 
Total cost of machine........................................................ $ 58,000 
Machine.......................................................................... 58,000 
Cash ....................................................................... 58,000 
2. Recorded cost............................................................................... $ 58,000 
Less: Residual value ................................................................. 5,000 
Depreciable cost .......................................................................... $ 53,000 
Years of useful life....................................................................... ÷ 4 
Annual depreciation........................................................... $ 13,250 
Depreciation Expense............................................... 13,250 
Accumulated Depreciation ............................. 13,250 
(b) 1. Recorded cost............................................................................... $100,000 
Less: Residual value ................................................................. 10,000 
Depreciable cost .......................................................................... $90,000 
Years of useful life....................................................................... ÷ 4 
Annual depreciation........................................................... $ 22,500 
2. 
Year 
Book Value at 
Beginning of 
Year DDB Rate 
Annual 
Depreciation 
Expense 
Accumulated 
Depreciation 
2011 
2012 
2013 
2014 
$100,000 
50,000 
25,000 
12,500 
*50%* 
*50%* 
*50%* 
*50%* 
$50,000 
25,000 
12,500 
2,500** 
$50,000 
75,000 
87,500 
90,000 
*100% ÷ 4-year useful life = 25% X 2 = 50%. 
**$12,500 – $10,000 = $2,500. 
9-42 Copyright © 2011 John Wiley & Sons, Inc. Weygandt, IFRS, 1/e, Solutions Manual (For Instructor Use Only)
PROBLEM 9-3B (Continued) 
3. Depreciation cost per unit = ($100,000 – $10,000)/25,000 units = 
$3.60 per unit. 
Annual Depreciation Expense 
2011: $3.60 X 5,500 = $19,800 
2012: 3.60 X 7,000 = 25,200 
2013: 3.60 X 8,000 = 28,800 
2014: 3.60 X 4,500 = 16,200 
(c) The units-of-activity method reports the lowest amount of depreciation 
expense the first year while the declining-balance method reports the 
highest. In the fourth year, the declining-balance method reports the 
lowest amount of depreciation expense while the straight-line method 
reports the highest. 
These facts occur because the declining-balance method is an accelerated 
depreciation method in which the largest amount of depreciation is 
recognized in the early years of the asset’s life. If the straight-line method 
is used, the same amount of depreciation expense is recognized each 
year. Therefore, in the early years less depreciation expense will be 
recognized under this method than under the declining-balance method 
while more will be recognized in the later years. 
The amount of depreciation expense recognized using the units-of-activity 
method is dependent on production, so this method could recognize more 
or less depreciation expense than the other two methods in any year 
depending on output. 
No matter which of the three methods is used, the same total amount 
of depreciation expense will be recognized over the four-year period. 
Copyright © 2011 John Wiley & Sons, Inc. Weygandt, IFRS, 1/e, Solutions Manual (For Instructor Use Only) 9-43
PROBLEM 9-4B 
Year 
Depreciation 
Expense 
Accumulated 
Depreciation 
2009 
2010 
2011 
2012 
2013 
2014 
2015 
£30,000(a) 
30,000 
24,000(b) 
24,000 
24,000 
31,500(c) 
31,500 
£ 30,000 
60,000 
84,000 
108,000 
132,000 
163,500 
195,000 
(a) £200,000 – £20,000 
6 years 
= £30,000 
(b)Book value – Residual value 
Remaining useful life 
= 
£140,000 – £20,000 
5 years 
= £24,000 
(c) £68,000 – £5,000 
2 years 
= £31,500 
9-44 Copyright © 2011 John Wiley & Sons, Inc. Weygandt, IFRS, 1/e, Solutions Manual (For Instructor Use Only)
PROBLEM 9-5B 
(a) Apr. 1 Land .......................................................... 1,200,000 
Cash ................................................. 1,200,000 
May 1 Depreciation Expense......................... 14,000 
Accumulated Depreciation— 
Equipment ................................. 
($420,000 X 1/10 X 4/12) ........ 14,000 
1 Cash.......................................................... 240,000 
Accumulated Depreciation— 
Equipment .......................................... 182,000 
Equipment...................................... 420,000 
Gain on Disposal ......................... 2,000 
Cost $420,000 
Accum. depreciation— 
equipment 182,000 
[($420,000 X 1/10 X 4) + $14,000] 
Book value 238,000 
Cash proceeds 240,000 
Gain on disposal $ 2,000 
June 1 Cash.......................................................... 1,000,000 
Land ................................................. 340,000 
Gain on Disposal ......................... 660,000 
July 1 Equipment............................................... 1,100,000 
Cash ................................................. 1,100,000 
Dec. 31 Depreciation Expense......................... 30,000 
Accumulated Depreciation— 
Equipment 
($300,000 X 1/10)...................... 30,000 
31 Accumulated Depreciation— 
Equipment .......................................... 300,000 
Equipment...................................... 300,000 
Copyright © 2011 John Wiley & Sons, Inc. Weygandt, IFRS, 1/e, Solutions Manual (For Instructor Use Only) 9-45
PROBLEM 9-5B (Continued) 
Cost $300,000 
Accum. depreciation— 
equipment 300,000 
($300,000 X 1/10 X 10) 
Book value $ 0 
(b) Dec. 31 Depreciation Expense ........................ 400,000 
Accumulated Depreciation— 
Buildings 
($20,000,000 X 1/50) ............... 400,000 
31 Depreciation Expense ........................ 2,983,000 
Accumulated Depreciation— 
Equipment................................. 2,983,000 
($29,280,000* X 1/10) $2,928,000 
[($1,100,000 X 1/10) X 6/12] 55,000 
$2,983,000 
*($30,000,000 – $420,000 – $300,000) 
(c) STARKEY COMPANY 
Partial Statement of Financial Position 
December 31, 2012 
Plant Assets* 
Land .............................................................. $ 2,860,000 
Buildings ..................................................... $20,000,000 
Less: Accumulated depreciation— 
buildings ........................................ 8,400,000 11,600,000 
Equipment................................................... 30,380,000 
Less: Accumulated depreciation— 
equipment...................................... 6,545,000 23,835,000 
Total...................................................... $38,295,000 
*See T-accounts which follow. 
9-46 Copyright © 2011 John Wiley & Sons, Inc. Weygandt, IFRS, 1/e, Solutions Manual (For Instructor Use Only)
PROBLEM 9-5B (Continued) 
Land 
Bal. 2,000,000 
Apr. 1 1,200,000 
June 1 340,000 
Bal. 2,860,000 
Buildings 
Bal. 20,000,000 
Bal. 20,000,000 
Accumulated Depreciation—Buildings 
Bal. 8,000,000 
Dec. 31 adj. 400,000 
Bal. 8,400,000 
Equipment 
Bal. 30,000,000 
July 1 1,100,000 
May 1 420,000 
Dec. 31 300,000 
Bal. 30,380,000 
Accumulated Depreciation—Equipment 
May 1 182,000 
Dec. 31 300,000 
Bal. 4,000,000 
May 1 14,000 
Dec. 31 30,000 
Dec. 31 adj. 2,983,000 
Bal. 6,545,000 
Copyright © 2011 John Wiley & Sons, Inc. Weygandt, IFRS, 1/e, Solutions Manual (For Instructor Use Only) 9-47
PROBLEM 9-6B 
(a) Accumulated Depreciation—Delivery 
Equipment ......................................................................... 26,000 
Loss on Disposal................................................................. 14,000 
Delivery Equipment.................................................... 40,000 
(b) Cash......................................................................................... 29,000 
Accumulated Depreciation—Delivery 
Equipment ......................................................................... 26,000 
Gain on Disposal ........................................................ 15,000 
Delivery Equipment.................................................... 40,000 
(c) Cash......................................................................................... 10,000 
Accumulated Depreciation—Delivery 
Equipment ......................................................................... 26,000 
Loss on Disposal................................................................. 4,000 
Delivery Equipment.................................................... 40,000 
9-48 Copyright © 2011 John Wiley & Sons, Inc. Weygandt, IFRS, 1/e, Solutions Manual (For Instructor Use Only)
PROBLEM 9-7B 
(a) Jan. 2 Patents ............................................................ 45,000 
Cash ........................................................ 45,000 
Jan.– Research 
June Expense...................................................... 230,000 
Cash ........................................................ 230,000 
Sept. 1 Advertising Expense .................................. 125,000 
Cash ........................................................ 125,000 
Oct. 1 Copyright........................................................ 200,000 
Cash ........................................................ 200,000 
(b) Dec. 31 Amortization Expense—Patents............. 15,000 
Patents ................................................... 15,000 
[($100,000 X 1/10) + ($45,000 X 1/9)] 
31 Amortization Expense—Copyright........ 7,000 
Copyright............................................... 7,000 
[($60,000 X 1/10) + 
($200,000 X 1/50 X 3/12)] 
(c) Intangible Assets 
Patents ($145,000 cost – $25,000 amortization) (1) ................ $120,000 
Copyright ($260,000 cost – $31,000 amortization) (2)............ 229,000 
Total intangible assets ............................................................ $349,000 
(1) Cost ($100,000 + $45,000); amortization ($10,000 + $15,000). 
(2) Cost ($60,000 + $200,000); amortization ($24,000 + $7,000). 
(d) The intangible assets of the company consist of two patents and two 
copyrights. One patent with a total cost of $145,000 is being amortized 
in two segments ($100,000 over 10 years and $45,000 over 9 years); the 
other patent was obtained at no recordable cost. A copyright with a cost 
of $60,000 is being amortized over 10 years; the other copyright with a 
cost of $200,000 is being amortized over 50 years. 
Copyright © 2011 John Wiley & Sons, Inc. Weygandt, IFRS, 1/e, Solutions Manual (For Instructor Use Only) 9-49
PROBLEM 9-8B 
1. Development Expense....................................................... 110,000 
Patents ........................................................................... 110,000 
Patents .................................................................................... 5,500 
Amortization Expense—Patents 
[TL8,000 – (TL50,000 X 1/20)] ............................. 5,500 
2. Goodwill.................................................................................. 2,000 
Amortization Expense—Goodwill ......................... 2,000 
Note: Goodwill should not be amortized because it has an indefinite life unlike 
Patents. 
9-50 Copyright © 2011 John Wiley & Sons, Inc. Weygandt, IFRS, 1/e, Solutions Manual (For Instructor Use Only)
PROBLEM 9-9B 
(a) McLead Corp. Gene Corp. 
Asset turnover ratio $1,100,000 
$1,000,000 
= 1.10 times 
$990,000 
$1,050,000 
= .94 times 
(b) Based on the asset turnover ratio, McLead Corp. is more effective in using 
assets to generate sales. Its asset turnover ratio is 17% higher than 
Gene’s asset turnover ratio. 
Copyright © 2011 John Wiley & Sons, Inc. Weygandt, IFRS, 1/e, Solutions Manual (For Instructor Use Only) 9-51
CHAPTER 9 COMPREHENSIVE PROBLEM SOLUTION 
(a) 1. Equipment............................................................................... 16,800 
Cash ................................................................................... 16,800 
2. Depreciation Expense—Equipment................................ 450 
Accumulated Depreciation—Equipment................ 450 
Cash .......................................................................................... 3,500 
Accumulated Depreciation—Equipment....................... 2,250 
Equipment........................................................................ 5,000 
Gain on Disposal [$3,500 – ($5,000 – $2,250)]...... 750 
3. Accounts Receivable........................................................... 5,000 
Sales................................................................................... 5,000 
Cost of Goods Sold.............................................................. 3,500 
Merchandise Inventory ................................................ 3,500 
4. Bad Debts Expense ($4,000 – $500) ............................... 3,500 
Allowance for Doubtful Accounts............................ 3,500 
5. Interest Receivable ($10,000 X .08 X 9/12).................... 600 
Interest Revenue............................................................ 600 
6. Insurance Expense ($3,600 X 4/6) ................................... 2,400 
Prepaid Insurance ......................................................... 2,400 
7. Depreciation Expense—Building .................................... 4,000 
Accumulated Depreciation—Building 
[($150,000 – $30,000) ÷ 30].......................................... 4,000 
8. Depreciation Expense—Equipment................................ 9,900 
Accumulated Depreciation—Equipment 
[($55,000 – $5,500) ÷ 5] ............................................. 9,900 
9. Depreciation Expense—Equipment................................ 2,000 
Accumulated Depreciation—Equipment 
[($16,800 – $1,800) ÷ 5] X 8/12................................ 2,000 
9-52 Copyright © 2011 John Wiley & Sons, Inc. Weygandt, IFRS, 1/e, Solutions Manual (For Instructor Use Only)
COMPREHENSIVE PROBLEM (Continued) 
10. Amortization Expense—Patents ($9,000 ÷ 9)....... 1,000 
Patent .......................................................................... 1,000 
11. Salaries Expense............................................................ 2,200 
Salaries Payable ...................................................... 2,200 
12. Unearned Rent ($6,000 X 1/3) ..................................... 2,000 
Rent Revenue ........................................................... 2,000 
13. Interest Expense............................................................. 4,600 
Interest Payable 
[($11,000 + $35,000) X .10] ................................ 4,600 
14. Income Tax Expense..................................................... 15,000 
Income Tax Payable ............................................... 15,000 
Copyright © 2011 John Wiley & Sons, Inc. Weygandt, IFRS, 1/e, Solutions Manual (For Instructor Use Only) 9-53
COMPREHENSIVE PROBLEM (Continued) 
(b) PINKERTON CORPORATION 
Trial Balance 
December 31, 2011 
Debits Credits 
Cash............................................................................. 
Accounts Receivable ............................................. 
Notes Receivable..................................................... 
Interest Receivable................................................. 
Merchandise Inventory.......................................... 
Prepaid Insurance................................................... 
Land............................................................................. 
Building ...................................................................... 
Equipment ................................................................. 
Patent .......................................................................... 
Allowance for Doubtful Accounts ..................... 
Accumulated Depreciation—Building.............. 
Accumulated Depreciation—Equipment......... 
Accounts Payable ................................................... 
Salaries Payable ...................................................... 
Unearned Rent ......................................................... 
Notes Payable (short-term).................................. 
Interest Payable....................................................... 
Notes Payable (long-term).................................... 
Income Tax Payable ............................................... 
Share Capital—Ordinary....................................... 
Retained Earnings .................................................. 
Dividends................................................................... 
Sales............................................................................ 
Interest Revenue ..................................................... 
Rent Revenue ........................................................... 
Gain on Disposal..................................................... 
Bad Debts Expense ................................................ 
Cost of Goods Sold ................................................ 
Depreciation Expense—Building....................... 
Depreciation Expense—Equipment.................. 
Insurance Expense................................................. 
Interest Expense...................................................... 
Other Operating Expenses................................... 
Amortization Expense—Patents ........................ 
Salaries Expense..................................................... 
Income Tax Expense.............................................. 
Total.................................................................... 
$ 14,700 
41,800 
10,000 
600 
32,700 
1,200 
20,000 
150,000 
71,800 
8,000 
12,000 
3,500 
633,500 
4,000 
12,350 
2,400 
4,600 
61,800 
1,000 
112,200 
15,000 
$1,213,150 
$ 4,000 
54,000 
34,100 
27,300 
2,200 
4,000 
11,000 
4,600 
35,000 
15,000 
50,000 
63,600 
905,000 
600 
2,000 
750 
$1,213,150 
9-54 Copyright © 2011 John Wiley & Sons, Inc. Weygandt, IFRS, 1/e, Solutions Manual (For Instructor Use Only)
COMPREHENSIVE PROBLEM (Continued) 
(c) PINKERTON CORPORATION 
Income Statement 
For the Year Ended December 31, 2011 
Sales.................................................................. 
Cost of goods sold ....................................... 
Gross profit..................................................... 
Operating expenses 
Salaries expense...................................... 
Other operating expenses .................... 
Depreciation expense—equipment...... 
Depreciation expense—building ........ 
Bad debts expense.................................. 
Insurance expense .................................. 
Amortization expense—patents.......... 
Total operating expenses........................... 
Income from operations ............................. 
Other income and expense 
Rent income............................................... 
Gain on disposal ...................................... 
Interest revenue........................................ 
Interest expense............................................ 
Income before income taxes..................... 
Income tax expense ..................................... 
Net income ...................................................... 
$112,200 
61,800 
12,350 
4,000 
3,500 
2,400 
1,000 
2,000 
750 
600 
$905,000 
633,500 
271,500 
197,250 
74,250 
3,350 
4,600 
73,000 
15,000 
$ 58,000 
PINKERTON CORPORATION 
Retained Earnings Statement 
For the Year Ending December 31, 2011 
Retained earnings, 1/1/11................................................... 
Add: Net income ................................................................. 
Less: Dividends.................................................................... 
Retained earnings, 12/31/11 .............................................. 
$ 63,600 
58,000 
121,600 
12,000 
$109,600 
Copyright © 2011 John Wiley & Sons, Inc. Weygandt, IFRS, 1/e, Solutions Manual (For Instructor Use Only) 9-55
COMPREHENSIVE PROBLEM (Continued) 
(d) PINKERTON CORPORATION 
Statement of Financial Position 
December 31, 2011 
Property, plant, and equipment 
Land...................................................................... 
Building ............................................................... 
Less: Accum. depr.—building .................... 
Equipment........................................................... 
Less: Accum. depr.—equipment ............... 
Intangible assets 
Patent ................................................................... 
Current assets 
Prepaid insurance............................................ 
Merchandise inventory................................... 
Interest receivable............................................ 
Notes receivable............................................... 
Accounts receivable........................................ 
Less: Allowance for doubtful accounts...... 
Cash...................................................................... 
Total assets............................................................... 
Equity 
Share capital—ordinary ................................. 
Retained earnings............................................ 
Non-current liabilities 
Notes payable (long-term)............................. 
Current liabilities 
Notes payable (short-term) ........................... 
Accounts payable............................................. 
Income tax payable.......................................... 
Interest payable ................................................ 
Unearned rent.................................................... 
Salaries payable................................................ 
Total equity and liabilities .................................... 
$150,000 
54,000 
71,800 
34,100 
41,800 
4,000 
$ 20,000 
96,000 
37,700 
1,200 
32,700 
600 
10,000 
37,800 
14,700 
$ 50,000 
109,600 
11,000 
27,300 
15,000 
4,600 
4,000 
2,200 
$153,700 
8,000 
97,000 
$258,700 
$159,600 
35,000 
64,100 
$258,700 
9-56 Copyright © 2011 John Wiley & Sons, Inc. Weygandt, IFRS, 1/e, Solutions Manual (For Instructor Use Only)
BYP 9-1 FINANCIAL REPORTING PROBLEM 
(a) Property, plant, and equipment is reported net, book value, on the 
December 27, 2008, statement of financial position at £1,761,000,000. 
The cost of the property, plant, and equipment is £3,330,000,000 as 
shown in Note 16. 
(b) Depreciation expense is calculated on a straight-line basis over an asset’s 
estimated useful live. (see Note 1, item q). 
(c) Depreciation expense was: 
2008: £161,000,000. Amort: £35,000,000 in 2008 
2007: £138,000,000. 
(d) Cadbury’s capital spending was: 
2008: £500,000,000. 
2007: £409,000,000. 
(e) Cadbury’s statement of financial position reports £2,288,000,000 for 
goodwill, £1,598,000,000 of acquisition intangibles, and £87,000,000 of 
software intangibles. In Note 15, the company indicates that acquisition 
intangibles consist of brands. 
Copyright © 2011 John Wiley & Sons, Inc. Weygandt, IFRS, 1/e, Solutions Manual (For Instructor Use Only) 9-57
BYP 9-2 COMPARATIVE ANALYSIS PROBLEM 
(a) Cadbury Nestlé 
Asset 
turnover 
ratio £5,384 ÷ 
£11, 338 + £8, 895 
2 
= .53 times CHF109,908 ÷ 
CHF115, 361+ CHF106, 215 
2 
= .99 times 
(b) The asset turnover ratio measures how efficiently a company uses its 
assets to generate sales. It shows the dollars of sales generated by each 
dollar invested in assets. Nestlé’s asset turnover ratio (.99) was 87% 
higher than Cadbury’s (.53). Therefore, it can be concluded that Nestlé was 
more efficient during 2008 in utilizing assets to generate sales. 
9-58 Copyright © 2011 John Wiley & Sons, Inc. Weygandt, IFRS, 1/e, Solutions Manual (For Instructor Use Only)
BYP 9-3 EXPLORING THE WEB 
Answers will vary depending on the company selected. 
Copyright © 2011 John Wiley & Sons, Inc. Weygandt, IFRS, 1/e, Solutions Manual (For Instructor Use Only) 9-59
BYP 9-4 DECISION MAKING ACROSS THE ORGANIZATION 
(a) Reimer Company—Straight-line method 
Annual Depreciation 
Building [($320,000 – $20,000) ÷ 40]...................................... $ 7,500 
Equipment [($110,000 – $10,000) ÷ 10] ................................. 10,000 
Total annual depreciation ......................................................... $17,500 
Total accumulated depreciation ($17,500 X 3)............................ $52,500 
Lingo Company—Double-declining-balance method 
Year Asset Computation 
Annual 
Depreciation 
Accumulated 
Depreciation 
2009 
2010 
2011 
Building 
Equipment 
Building 
Equipment 
Building 
Equipment 
$320,000 X 5% 
$110,000 X 20% 
$304,000 X 5% 
$ 88,000 X 20% 
$288,800 X 5% 
$ 70,400 X 20% 
$16,000 
22,000 
15,200 
17,600 
14,440 
14,080 
$38,000 
32,800 
28,520 
$99,320 
(b) 
Year 
Reimer 
Company 
Net Income 
Lingo 
Company 
Net Income 
As Adjusted Computations for Lingo Company 
2009 
2010 
2011 
$ 84,000 
88,400 
90,000 
$ 88,500 
91,300 
96,020 
$68,000 + $38,000 – $17,500 = $88,500 
$76,000 + $32,800 – $17,500 = $91,300 
$85,000 + $28,520 – $17,500 = $96,020 
Total net 
income $262,400 $275,820 
(c) As shown above, when the two companies use the same depreciation 
method, Lingo Company is more profitable than Reimer Company. When 
the two companies are using different depreciation methods, Lingo 
Company has more cash than Reimer Company for two reasons: 
9-60 Copyright © 2011 John Wiley & Sons, Inc. Weygandt, IFRS, 1/e, Solutions Manual (For Instructor Use Only)
BYP 9-4 (Continued) 
(1) its earnings are generating more cash than the earnings of Reimer 
Company, and (2) depreciation expense has no effect on cash. Cash 
generated by operations can be arrived at by adding depreciation expense 
to net income. If this is done, it can be seen that Lingo Company’s opera-tions 
generate more cash ($229,000 + $99,320 = $328,320) than Reimer 
Company’s ($262,400 + $52,500 = $314,900). Based on the above analysis, 
Mrs. Vogts should buy Lingo Company. It not only is in a better financial 
position than Reimer Company, but it is also more profitable. 
Copyright © 2011 John Wiley & Sons, Inc. Weygandt, IFRS, 1/e, Solutions Manual (For Instructor Use Only) 9-61
BYP 9-5 COMMUNICATION ACTIVITY 
To: Instructor 
From: Student 
Re: American Exploration Company footnote 
American Exploration Company accounts for its oil and gas activities using the 
successful efforts approach. Under this method, only the costs of successful 
exploration are included in the cost of the extractable resource, and the 
costs of unsuccessful explorations are expensed. 
Depletion is determined using the units-of-activity method. Under this method, 
a depletion cost per unit is computed based on the total number of units 
expected to be extracted. Depletion expense for the year is determined by 
multiplying the units extracted and sold by the depletion cost per unit. 
9-62 Copyright © 2011 John Wiley & Sons, Inc. Weygandt, IFRS, 1/e, Solutions Manual (For Instructor Use Only)
BYP 9-6 ETHICS CASE 
(a) The stakeholders in this situation are: 
 Dennis Harwood, president of Buster Container Company. 
 Shelly McGlone, controller. 
 The shareholders of Buster Container Company. 
 Potential investors in Buster Container Company. 
(b) The intentional misstatement of the life of an asset or the amount of the 
residual value is unethical for whatever the reason. There is nothing per 
se unethical about changing the estimate either of the life of an asset or 
of an asset’s residual value if the change is an attempt to better match 
cost and revenues and is a better allocation of the asset’s depreciable 
cost over the asset’s useful life. In this case, it appears from the 
controller’s reaction that the revisions in the life are intended only to 
improve earnings and, therefore, are unethical. 
The fact that the competition uses a longer life on its equipment is not 
necessarily relevant. The competition’s maintenance and repair policies 
and activities may be different. The competition may use its equipment 
fewer hours a year (e.g., one shift rather than two shifts daily) than Buster 
Container Company. 
(c) Income before income taxes in the year of change is increased $140,000 
by implementing the president’s proposed changes. 
Old Estimates 
Asset cost 
Estimated residual value 
Depreciable cost 
Depreciation per year (1/8) 
$3,100,000 
300,000 
2,800,000 
$ 350,000 
Revised Estimates 
Asset cost 
Estimated residual value 
Depreciable cost 
Depreciation taken to date ($350,000 X 2) 
Remaining life in years 
Depreciation per year 
$3,100,000 
300,000 
2,800,000 
700,000 
2,100,000 
10 years 
$ 210,000 
Copyright © 2011 John Wiley  Sons, Inc. Weygandt, IFRS, 1/e, Solutions Manual (For Instructor Use Only) 9-63
Ch09 solution w_kieso_ifrs 1st edi.

Contenu connexe

Tendances

Ch11_Accounting Intermediate_IND
Ch11_Accounting Intermediate_INDCh11_Accounting Intermediate_IND
Ch11_Accounting Intermediate_INDMaiya Maiya
 
Akuntansi Keuangan 2 - Ekuitas
Akuntansi Keuangan 2 - EkuitasAkuntansi Keuangan 2 - Ekuitas
Akuntansi Keuangan 2 - EkuitasLusi Mei
 
Materi AKM 2 Utang Jangka Panjang
Materi AKM 2 Utang Jangka PanjangMateri AKM 2 Utang Jangka Panjang
Materi AKM 2 Utang Jangka PanjangRyan Gamof
 
Jawaban uts m. keuangan i
Jawaban uts m. keuangan iJawaban uts m. keuangan i
Jawaban uts m. keuangan iyalifadli98
 
Income statement & related information
Income statement & related informationIncome statement & related information
Income statement & related informationRahmatia Azzindani
 
Contoh soal dan jawaban akuntansi joint venture
Contoh soal dan jawaban akuntansi joint ventureContoh soal dan jawaban akuntansi joint venture
Contoh soal dan jawaban akuntansi joint ventureWahyu Hidayat
 
Manajemen keuangan part 4 of 5
Manajemen keuangan part 4 of 5Manajemen keuangan part 4 of 5
Manajemen keuangan part 4 of 5Judianto Nugroho
 
Time value of money
Time value of moneyTime value of money
Time value of moneyPT Lion Air
 
Anggaranperusahaan 101214094831-phpapp01
Anggaranperusahaan 101214094831-phpapp01Anggaranperusahaan 101214094831-phpapp01
Anggaranperusahaan 101214094831-phpapp01arwianthy
 
Akuntansi Firma
Akuntansi Firma Akuntansi Firma
Akuntansi Firma findira
 
Contoh perhitungan deviden saham
Contoh perhitungan deviden saham Contoh perhitungan deviden saham
Contoh perhitungan deviden saham Livi Pungus
 
Materi 4-return-yang-diharapkan-dan-risiko-portofolio1
Materi 4-return-yang-diharapkan-dan-risiko-portofolio1Materi 4-return-yang-diharapkan-dan-risiko-portofolio1
Materi 4-return-yang-diharapkan-dan-risiko-portofolio1Leo Dhunt
 
Ch12 solution w_kieso_ifrs 1st edi.
Ch12 solution w_kieso_ifrs 1st edi.Ch12 solution w_kieso_ifrs 1st edi.
Ch12 solution w_kieso_ifrs 1st edi.Fergieta Prahasdhika
 
Analisis leverage
Analisis leverageAnalisis leverage
Analisis leveragetitikefnita
 
C 14 indo INTERMEDIATE 2
C 14 indo INTERMEDIATE 2C 14 indo INTERMEDIATE 2
C 14 indo INTERMEDIATE 2rohima _yesung
 

Tendances (20)

Ch11 depresiasi aset
Ch11 depresiasi asetCh11 depresiasi aset
Ch11 depresiasi aset
 
Akuntansi Biaya 5#5
Akuntansi Biaya 5#5Akuntansi Biaya 5#5
Akuntansi Biaya 5#5
 
Ch11_Accounting Intermediate_IND
Ch11_Accounting Intermediate_INDCh11_Accounting Intermediate_IND
Ch11_Accounting Intermediate_IND
 
Akuntansi Keuangan 2 - Ekuitas
Akuntansi Keuangan 2 - EkuitasAkuntansi Keuangan 2 - Ekuitas
Akuntansi Keuangan 2 - Ekuitas
 
Materi AKM 2 Utang Jangka Panjang
Materi AKM 2 Utang Jangka PanjangMateri AKM 2 Utang Jangka Panjang
Materi AKM 2 Utang Jangka Panjang
 
Jawaban uts m. keuangan i
Jawaban uts m. keuangan iJawaban uts m. keuangan i
Jawaban uts m. keuangan i
 
Income statement & related information
Income statement & related informationIncome statement & related information
Income statement & related information
 
Contoh soal dan jawaban akuntansi joint venture
Contoh soal dan jawaban akuntansi joint ventureContoh soal dan jawaban akuntansi joint venture
Contoh soal dan jawaban akuntansi joint venture
 
Manajemen keuangan part 4 of 5
Manajemen keuangan part 4 of 5Manajemen keuangan part 4 of 5
Manajemen keuangan part 4 of 5
 
Time value of money
Time value of moneyTime value of money
Time value of money
 
Piutang wesel
Piutang weselPiutang wesel
Piutang wesel
 
Anggaranperusahaan 101214094831-phpapp01
Anggaranperusahaan 101214094831-phpapp01Anggaranperusahaan 101214094831-phpapp01
Anggaranperusahaan 101214094831-phpapp01
 
Akuntansi Firma
Akuntansi Firma Akuntansi Firma
Akuntansi Firma
 
Contoh perhitungan deviden saham
Contoh perhitungan deviden saham Contoh perhitungan deviden saham
Contoh perhitungan deviden saham
 
Manajemen keuangan
Manajemen keuanganManajemen keuangan
Manajemen keuangan
 
Bahan kuliah pengantar akuntansi ii utang obligasi
Bahan kuliah pengantar akuntansi ii  utang obligasiBahan kuliah pengantar akuntansi ii  utang obligasi
Bahan kuliah pengantar akuntansi ii utang obligasi
 
Materi 4-return-yang-diharapkan-dan-risiko-portofolio1
Materi 4-return-yang-diharapkan-dan-risiko-portofolio1Materi 4-return-yang-diharapkan-dan-risiko-portofolio1
Materi 4-return-yang-diharapkan-dan-risiko-portofolio1
 
Ch12 solution w_kieso_ifrs 1st edi.
Ch12 solution w_kieso_ifrs 1st edi.Ch12 solution w_kieso_ifrs 1st edi.
Ch12 solution w_kieso_ifrs 1st edi.
 
Analisis leverage
Analisis leverageAnalisis leverage
Analisis leverage
 
C 14 indo INTERMEDIATE 2
C 14 indo INTERMEDIATE 2C 14 indo INTERMEDIATE 2
C 14 indo INTERMEDIATE 2
 

Similaire à Ch09 solution w_kieso_ifrs 1st edi.

IRJET- Productivity Improvement of Assembly Workstation in a Small Scale ...
IRJET-  	  Productivity Improvement of Assembly Workstation in a Small Scale ...IRJET-  	  Productivity Improvement of Assembly Workstation in a Small Scale ...
IRJET- Productivity Improvement of Assembly Workstation in a Small Scale ...IRJET Journal
 
IOE OLD question 2075 Chaitra for BEL
IOE OLD question 2075 Chaitra for BELIOE OLD question 2075 Chaitra for BEL
IOE OLD question 2075 Chaitra for BELAshishBhatta3
 
3117t13 A;signment Print ViewEsercise 17-1 4 Activity-bas.docx
3117t13 A;signment Print ViewEsercise 17-1 4 Activity-bas.docx3117t13 A;signment Print ViewEsercise 17-1 4 Activity-bas.docx
3117t13 A;signment Print ViewEsercise 17-1 4 Activity-bas.docxgilbertkpeters11344
 
Andrew Chant\'s CanWEA O & M Presentation
Andrew Chant\'s CanWEA  O  & M  PresentationAndrew Chant\'s CanWEA  O  & M  Presentation
Andrew Chant\'s CanWEA O & M Presentationmtingle
 
ACC 291 GUIDE Achievement Education--acc291guide.com
ACC 291 GUIDE Achievement Education--acc291guide.comACC 291 GUIDE Achievement Education--acc291guide.com
ACC 291 GUIDE Achievement Education--acc291guide.comclaric137
 
Checklist for Cost Control Dept in Contracting Company
Checklist for Cost Control Dept in Contracting CompanyChecklist for Cost Control Dept in Contracting Company
Checklist for Cost Control Dept in Contracting Companykashif khawja
 
ACC 291 GUIDE Redefined Education--acc291guide.com
ACC 291 GUIDE Redefined Education--acc291guide.comACC 291 GUIDE Redefined Education--acc291guide.com
ACC 291 GUIDE Redefined Education--acc291guide.comclaric223
 
Assumption University Of Thailand ACT1600 PPT 2009 CH09
Assumption University Of Thailand  ACT1600 PPT 2009 CH09Assumption University Of Thailand  ACT1600 PPT 2009 CH09
Assumption University Of Thailand ACT1600 PPT 2009 CH09AUHONEY.COM
 
Blackbeltpresentation
BlackbeltpresentationBlackbeltpresentation
BlackbeltpresentationRobert Peth
 
Chapter Review10-8dDiscussion Questions1. ONeil Office Supplies h.docx
Chapter Review10-8dDiscussion Questions1. ONeil Office Supplies h.docxChapter Review10-8dDiscussion Questions1. ONeil Office Supplies h.docx
Chapter Review10-8dDiscussion Questions1. ONeil Office Supplies h.docxmccormicknadine86
 
Managerial Accounting Tools for Business Decision Making Canadian 5th Edition...
Managerial Accounting Tools for Business Decision Making Canadian 5th Edition...Managerial Accounting Tools for Business Decision Making Canadian 5th Edition...
Managerial Accounting Tools for Business Decision Making Canadian 5th Edition...EmmanuelCamerons
 
BA3653- #10 (Aggregate Planning) 110. Aggregate Planning.docx
BA3653- #10 (Aggregate Planning) 110. Aggregate Planning.docxBA3653- #10 (Aggregate Planning) 110. Aggregate Planning.docx
BA3653- #10 (Aggregate Planning) 110. Aggregate Planning.docxikirkton
 
SAP T-Accounts Posting Simulation - Example
SAP T-Accounts Posting Simulation - ExampleSAP T-Accounts Posting Simulation - Example
SAP T-Accounts Posting Simulation - ExampleMichael Knowles
 

Similaire à Ch09 solution w_kieso_ifrs 1st edi. (20)

IRJET- Productivity Improvement of Assembly Workstation in a Small Scale ...
IRJET-  	  Productivity Improvement of Assembly Workstation in a Small Scale ...IRJET-  	  Productivity Improvement of Assembly Workstation in a Small Scale ...
IRJET- Productivity Improvement of Assembly Workstation in a Small Scale ...
 
IOE OLD question 2075 Chaitra for BEL
IOE OLD question 2075 Chaitra for BELIOE OLD question 2075 Chaitra for BEL
IOE OLD question 2075 Chaitra for BEL
 
Ch10
Ch10Ch10
Ch10
 
Chapter 10
Chapter 10Chapter 10
Chapter 10
 
3117t13 A;signment Print ViewEsercise 17-1 4 Activity-bas.docx
3117t13 A;signment Print ViewEsercise 17-1 4 Activity-bas.docx3117t13 A;signment Print ViewEsercise 17-1 4 Activity-bas.docx
3117t13 A;signment Print ViewEsercise 17-1 4 Activity-bas.docx
 
Andrew Chant\'s CanWEA O & M Presentation
Andrew Chant\'s CanWEA  O  & M  PresentationAndrew Chant\'s CanWEA  O  & M  Presentation
Andrew Chant\'s CanWEA O & M Presentation
 
ACC 291 GUIDE Achievement Education--acc291guide.com
ACC 291 GUIDE Achievement Education--acc291guide.comACC 291 GUIDE Achievement Education--acc291guide.com
ACC 291 GUIDE Achievement Education--acc291guide.com
 
Checklist for Cost Control Dept in Contracting Company
Checklist for Cost Control Dept in Contracting CompanyChecklist for Cost Control Dept in Contracting Company
Checklist for Cost Control Dept in Contracting Company
 
ACC 291 GUIDE Redefined Education--acc291guide.com
ACC 291 GUIDE Redefined Education--acc291guide.comACC 291 GUIDE Redefined Education--acc291guide.com
ACC 291 GUIDE Redefined Education--acc291guide.com
 
Chap6
Chap6Chap6
Chap6
 
theoty x and y
theoty x and ytheoty x and y
theoty x and y
 
Assumption University Of Thailand ACT1600 PPT 2009 CH09
Assumption University Of Thailand  ACT1600 PPT 2009 CH09Assumption University Of Thailand  ACT1600 PPT 2009 CH09
Assumption University Of Thailand ACT1600 PPT 2009 CH09
 
Assignment 101
Assignment 101Assignment 101
Assignment 101
 
Blackbeltpresentation
BlackbeltpresentationBlackbeltpresentation
Blackbeltpresentation
 
Chapter Review10-8dDiscussion Questions1. ONeil Office Supplies h.docx
Chapter Review10-8dDiscussion Questions1. ONeil Office Supplies h.docxChapter Review10-8dDiscussion Questions1. ONeil Office Supplies h.docx
Chapter Review10-8dDiscussion Questions1. ONeil Office Supplies h.docx
 
Managerial Accounting Tools for Business Decision Making Canadian 5th Edition...
Managerial Accounting Tools for Business Decision Making Canadian 5th Edition...Managerial Accounting Tools for Business Decision Making Canadian 5th Edition...
Managerial Accounting Tools for Business Decision Making Canadian 5th Edition...
 
BA3653- #10 (Aggregate Planning) 110. Aggregate Planning.docx
BA3653- #10 (Aggregate Planning) 110. Aggregate Planning.docxBA3653- #10 (Aggregate Planning) 110. Aggregate Planning.docx
BA3653- #10 (Aggregate Planning) 110. Aggregate Planning.docx
 
Design notes5
Design notes5Design notes5
Design notes5
 
Design notes5
Design notes5Design notes5
Design notes5
 
SAP T-Accounts Posting Simulation - Example
SAP T-Accounts Posting Simulation - ExampleSAP T-Accounts Posting Simulation - Example
SAP T-Accounts Posting Simulation - Example
 

Plus de Fergieta Prahasdhika

Contoh Prospektus atau perjanjian sebelum membeli sebuah reksadana
Contoh Prospektus atau perjanjian sebelum membeli sebuah reksadanaContoh Prospektus atau perjanjian sebelum membeli sebuah reksadana
Contoh Prospektus atau perjanjian sebelum membeli sebuah reksadanaFergieta Prahasdhika
 
Contoh Report transaksi bulanan Investasi saham dalam bentuk reksadana
Contoh Report transaksi bulanan Investasi saham dalam bentuk reksadanaContoh Report transaksi bulanan Investasi saham dalam bentuk reksadana
Contoh Report transaksi bulanan Investasi saham dalam bentuk reksadanaFergieta Prahasdhika
 
Contoh Formulir spt 1770_s_2014 PAJAK PENGHASILAN WAJIB PAJAK ORANG PRIBADI
Contoh Formulir spt 1770_s_2014 PAJAK PENGHASILAN WAJIB PAJAK ORANG PRIBADIContoh Formulir spt 1770_s_2014 PAJAK PENGHASILAN WAJIB PAJAK ORANG PRIBADI
Contoh Formulir spt 1770_s_2014 PAJAK PENGHASILAN WAJIB PAJAK ORANG PRIBADIFergieta Prahasdhika
 
Contoh Form pengkinian data lengkap perorangan (Persyaratan untuk mengajukan ...
Contoh Form pengkinian data lengkap perorangan (Persyaratan untuk mengajukan ...Contoh Form pengkinian data lengkap perorangan (Persyaratan untuk mengajukan ...
Contoh Form pengkinian data lengkap perorangan (Persyaratan untuk mengajukan ...Fergieta Prahasdhika
 
SKRIPSI-ANALISIS PENGARUH PROFITABILITAS, SOLVABILITAS, DAN UKURAN PERUSAHAAN...
SKRIPSI-ANALISIS PENGARUH PROFITABILITAS, SOLVABILITAS, DAN UKURAN PERUSAHAAN...SKRIPSI-ANALISIS PENGARUH PROFITABILITAS, SOLVABILITAS, DAN UKURAN PERUSAHAAN...
SKRIPSI-ANALISIS PENGARUH PROFITABILITAS, SOLVABILITAS, DAN UKURAN PERUSAHAAN...Fergieta Prahasdhika
 
Mengenal reksadana-syariah-edukasi-paytren-oktober-2017
Mengenal reksadana-syariah-edukasi-paytren-oktober-2017Mengenal reksadana-syariah-edukasi-paytren-oktober-2017
Mengenal reksadana-syariah-edukasi-paytren-oktober-2017Fergieta Prahasdhika
 
Bab 5- teori akuntansi-teori- pengukuran
Bab 5- teori akuntansi-teori- pengukuranBab 5- teori akuntansi-teori- pengukuran
Bab 5- teori akuntansi-teori- pengukuranFergieta Prahasdhika
 
Sistem Pengendalian Manajemen - Bab 6 - Transfer Pricing
Sistem Pengendalian Manajemen - Bab 6 - Transfer PricingSistem Pengendalian Manajemen - Bab 6 - Transfer Pricing
Sistem Pengendalian Manajemen - Bab 6 - Transfer PricingFergieta Prahasdhika
 
Contoh pengisian spt p ph op 1770 s & 1770ss
Contoh pengisian spt p ph op 1770 s & 1770ssContoh pengisian spt p ph op 1770 s & 1770ss
Contoh pengisian spt p ph op 1770 s & 1770ssFergieta Prahasdhika
 
Durbin watson tables unyu unyu bgt
Durbin watson tables unyu unyu bgtDurbin watson tables unyu unyu bgt
Durbin watson tables unyu unyu bgtFergieta Prahasdhika
 
Contoh pengisian spt p ph op 1770 s & 1770ss 2009
Contoh pengisian spt p ph op 1770 s & 1770ss  2009Contoh pengisian spt p ph op 1770 s & 1770ss  2009
Contoh pengisian spt p ph op 1770 s & 1770ss 2009Fergieta Prahasdhika
 

Plus de Fergieta Prahasdhika (20)

Uu no 5 tahun 1999
Uu no 5 tahun 1999Uu no 5 tahun 1999
Uu no 5 tahun 1999
 
Contoh Prospektus atau perjanjian sebelum membeli sebuah reksadana
Contoh Prospektus atau perjanjian sebelum membeli sebuah reksadanaContoh Prospektus atau perjanjian sebelum membeli sebuah reksadana
Contoh Prospektus atau perjanjian sebelum membeli sebuah reksadana
 
Contoh Report transaksi bulanan Investasi saham dalam bentuk reksadana
Contoh Report transaksi bulanan Investasi saham dalam bentuk reksadanaContoh Report transaksi bulanan Investasi saham dalam bentuk reksadana
Contoh Report transaksi bulanan Investasi saham dalam bentuk reksadana
 
Contoh Formulir spt 1770_s_2014 PAJAK PENGHASILAN WAJIB PAJAK ORANG PRIBADI
Contoh Formulir spt 1770_s_2014 PAJAK PENGHASILAN WAJIB PAJAK ORANG PRIBADIContoh Formulir spt 1770_s_2014 PAJAK PENGHASILAN WAJIB PAJAK ORANG PRIBADI
Contoh Formulir spt 1770_s_2014 PAJAK PENGHASILAN WAJIB PAJAK ORANG PRIBADI
 
Foundation pack K-LINK
Foundation pack K-LINKFoundation pack K-LINK
Foundation pack K-LINK
 
Contoh Form pengkinian data lengkap perorangan (Persyaratan untuk mengajukan ...
Contoh Form pengkinian data lengkap perorangan (Persyaratan untuk mengajukan ...Contoh Form pengkinian data lengkap perorangan (Persyaratan untuk mengajukan ...
Contoh Form pengkinian data lengkap perorangan (Persyaratan untuk mengajukan ...
 
SKRIPSI-ANALISIS PENGARUH PROFITABILITAS, SOLVABILITAS, DAN UKURAN PERUSAHAAN...
SKRIPSI-ANALISIS PENGARUH PROFITABILITAS, SOLVABILITAS, DAN UKURAN PERUSAHAAN...SKRIPSI-ANALISIS PENGARUH PROFITABILITAS, SOLVABILITAS, DAN UKURAN PERUSAHAAN...
SKRIPSI-ANALISIS PENGARUH PROFITABILITAS, SOLVABILITAS, DAN UKURAN PERUSAHAAN...
 
Mengenal reksadana-syariah-edukasi-paytren-oktober-2017
Mengenal reksadana-syariah-edukasi-paytren-oktober-2017Mengenal reksadana-syariah-edukasi-paytren-oktober-2017
Mengenal reksadana-syariah-edukasi-paytren-oktober-2017
 
Bab 5- teori akuntansi-teori- pengukuran
Bab 5- teori akuntansi-teori- pengukuranBab 5- teori akuntansi-teori- pengukuran
Bab 5- teori akuntansi-teori- pengukuran
 
Sistem Pengendalian Manajemen - Bab 6 - Transfer Pricing
Sistem Pengendalian Manajemen - Bab 6 - Transfer PricingSistem Pengendalian Manajemen - Bab 6 - Transfer Pricing
Sistem Pengendalian Manajemen - Bab 6 - Transfer Pricing
 
Bab1 c - Matematika Bisnis
Bab1 c - Matematika BisnisBab1 c - Matematika Bisnis
Bab1 c - Matematika Bisnis
 
Lecture 9 Manajemen Investasi
Lecture 9 Manajemen InvestasiLecture 9 Manajemen Investasi
Lecture 9 Manajemen Investasi
 
Lecture 8 Manajemen Investasi
Lecture 8 Manajemen InvestasiLecture 8 Manajemen Investasi
Lecture 8 Manajemen Investasi
 
Pph badan
Pph badanPph badan
Pph badan
 
Contoh pengisian spt p ph op 1770 s & 1770ss
Contoh pengisian spt p ph op 1770 s & 1770ssContoh pengisian spt p ph op 1770 s & 1770ss
Contoh pengisian spt p ph op 1770 s & 1770ss
 
K-ayurveda (K-LINK)
K-ayurveda (K-LINK)K-ayurveda (K-LINK)
K-ayurveda (K-LINK)
 
Lecture 7 Manajemen Investasi
Lecture 7 Manajemen InvestasiLecture 7 Manajemen Investasi
Lecture 7 Manajemen Investasi
 
Lecture 5 Manajemen Investasi
Lecture 5 Manajemen InvestasiLecture 5 Manajemen Investasi
Lecture 5 Manajemen Investasi
 
Durbin watson tables unyu unyu bgt
Durbin watson tables unyu unyu bgtDurbin watson tables unyu unyu bgt
Durbin watson tables unyu unyu bgt
 
Contoh pengisian spt p ph op 1770 s & 1770ss 2009
Contoh pengisian spt p ph op 1770 s & 1770ss  2009Contoh pengisian spt p ph op 1770 s & 1770ss  2009
Contoh pengisian spt p ph op 1770 s & 1770ss 2009
 

Dernier

Unit-IV; Professional Sales Representative (PSR).pptx
Unit-IV; Professional Sales Representative (PSR).pptxUnit-IV; Professional Sales Representative (PSR).pptx
Unit-IV; Professional Sales Representative (PSR).pptxVishalSingh1417
 
Micro-Scholarship, What it is, How can it help me.pdf
Micro-Scholarship, What it is, How can it help me.pdfMicro-Scholarship, What it is, How can it help me.pdf
Micro-Scholarship, What it is, How can it help me.pdfPoh-Sun Goh
 
Activity 01 - Artificial Culture (1).pdf
Activity 01 - Artificial Culture (1).pdfActivity 01 - Artificial Culture (1).pdf
Activity 01 - Artificial Culture (1).pdfciinovamais
 
Unit-V; Pricing (Pharma Marketing Management).pptx
Unit-V; Pricing (Pharma Marketing Management).pptxUnit-V; Pricing (Pharma Marketing Management).pptx
Unit-V; Pricing (Pharma Marketing Management).pptxVishalSingh1417
 
UGC NET Paper 1 Mathematical Reasoning & Aptitude.pdf
UGC NET Paper 1 Mathematical Reasoning & Aptitude.pdfUGC NET Paper 1 Mathematical Reasoning & Aptitude.pdf
UGC NET Paper 1 Mathematical Reasoning & Aptitude.pdfNirmal Dwivedi
 
How to Give a Domain for a Field in Odoo 17
How to Give a Domain for a Field in Odoo 17How to Give a Domain for a Field in Odoo 17
How to Give a Domain for a Field in Odoo 17Celine George
 
ICT Role in 21st Century Education & its Challenges.pptx
ICT Role in 21st Century Education & its Challenges.pptxICT Role in 21st Century Education & its Challenges.pptx
ICT Role in 21st Century Education & its Challenges.pptxAreebaZafar22
 
Introduction to Nonprofit Accounting: The Basics
Introduction to Nonprofit Accounting: The BasicsIntroduction to Nonprofit Accounting: The Basics
Introduction to Nonprofit Accounting: The BasicsTechSoup
 
SKILL OF INTRODUCING THE LESSON MICRO SKILLS.pptx
SKILL OF INTRODUCING THE LESSON MICRO SKILLS.pptxSKILL OF INTRODUCING THE LESSON MICRO SKILLS.pptx
SKILL OF INTRODUCING THE LESSON MICRO SKILLS.pptxAmanpreet Kaur
 
Food safety_Challenges food safety laboratories_.pdf
Food safety_Challenges food safety laboratories_.pdfFood safety_Challenges food safety laboratories_.pdf
Food safety_Challenges food safety laboratories_.pdfSherif Taha
 
Spellings Wk 3 English CAPS CARES Please Practise
Spellings Wk 3 English CAPS CARES Please PractiseSpellings Wk 3 English CAPS CARES Please Practise
Spellings Wk 3 English CAPS CARES Please PractiseAnaAcapella
 
Vishram Singh - Textbook of Anatomy Upper Limb and Thorax.. Volume 1 (1).pdf
Vishram Singh - Textbook of Anatomy  Upper Limb and Thorax.. Volume 1 (1).pdfVishram Singh - Textbook of Anatomy  Upper Limb and Thorax.. Volume 1 (1).pdf
Vishram Singh - Textbook of Anatomy Upper Limb and Thorax.. Volume 1 (1).pdfssuserdda66b
 
Graduate Outcomes Presentation Slides - English
Graduate Outcomes Presentation Slides - EnglishGraduate Outcomes Presentation Slides - English
Graduate Outcomes Presentation Slides - Englishneillewis46
 
Sociology 101 Demonstration of Learning Exhibit
Sociology 101 Demonstration of Learning ExhibitSociology 101 Demonstration of Learning Exhibit
Sociology 101 Demonstration of Learning Exhibitjbellavia9
 
Explore beautiful and ugly buildings. Mathematics helps us create beautiful d...
Explore beautiful and ugly buildings. Mathematics helps us create beautiful d...Explore beautiful and ugly buildings. Mathematics helps us create beautiful d...
Explore beautiful and ugly buildings. Mathematics helps us create beautiful d...christianmathematics
 
On National Teacher Day, meet the 2024-25 Kenan Fellows
On National Teacher Day, meet the 2024-25 Kenan FellowsOn National Teacher Day, meet the 2024-25 Kenan Fellows
On National Teacher Day, meet the 2024-25 Kenan FellowsMebane Rash
 
Google Gemini An AI Revolution in Education.pptx
Google Gemini An AI Revolution in Education.pptxGoogle Gemini An AI Revolution in Education.pptx
Google Gemini An AI Revolution in Education.pptxDr. Sarita Anand
 
General Principles of Intellectual Property: Concepts of Intellectual Proper...
General Principles of Intellectual Property: Concepts of Intellectual  Proper...General Principles of Intellectual Property: Concepts of Intellectual  Proper...
General Principles of Intellectual Property: Concepts of Intellectual Proper...Poonam Aher Patil
 
Single or Multiple melodic lines structure
Single or Multiple melodic lines structureSingle or Multiple melodic lines structure
Single or Multiple melodic lines structuredhanjurrannsibayan2
 

Dernier (20)

Unit-IV; Professional Sales Representative (PSR).pptx
Unit-IV; Professional Sales Representative (PSR).pptxUnit-IV; Professional Sales Representative (PSR).pptx
Unit-IV; Professional Sales Representative (PSR).pptx
 
Micro-Scholarship, What it is, How can it help me.pdf
Micro-Scholarship, What it is, How can it help me.pdfMicro-Scholarship, What it is, How can it help me.pdf
Micro-Scholarship, What it is, How can it help me.pdf
 
Activity 01 - Artificial Culture (1).pdf
Activity 01 - Artificial Culture (1).pdfActivity 01 - Artificial Culture (1).pdf
Activity 01 - Artificial Culture (1).pdf
 
Unit-V; Pricing (Pharma Marketing Management).pptx
Unit-V; Pricing (Pharma Marketing Management).pptxUnit-V; Pricing (Pharma Marketing Management).pptx
Unit-V; Pricing (Pharma Marketing Management).pptx
 
UGC NET Paper 1 Mathematical Reasoning & Aptitude.pdf
UGC NET Paper 1 Mathematical Reasoning & Aptitude.pdfUGC NET Paper 1 Mathematical Reasoning & Aptitude.pdf
UGC NET Paper 1 Mathematical Reasoning & Aptitude.pdf
 
How to Give a Domain for a Field in Odoo 17
How to Give a Domain for a Field in Odoo 17How to Give a Domain for a Field in Odoo 17
How to Give a Domain for a Field in Odoo 17
 
ICT Role in 21st Century Education & its Challenges.pptx
ICT Role in 21st Century Education & its Challenges.pptxICT Role in 21st Century Education & its Challenges.pptx
ICT Role in 21st Century Education & its Challenges.pptx
 
Introduction to Nonprofit Accounting: The Basics
Introduction to Nonprofit Accounting: The BasicsIntroduction to Nonprofit Accounting: The Basics
Introduction to Nonprofit Accounting: The Basics
 
SKILL OF INTRODUCING THE LESSON MICRO SKILLS.pptx
SKILL OF INTRODUCING THE LESSON MICRO SKILLS.pptxSKILL OF INTRODUCING THE LESSON MICRO SKILLS.pptx
SKILL OF INTRODUCING THE LESSON MICRO SKILLS.pptx
 
Food safety_Challenges food safety laboratories_.pdf
Food safety_Challenges food safety laboratories_.pdfFood safety_Challenges food safety laboratories_.pdf
Food safety_Challenges food safety laboratories_.pdf
 
Spellings Wk 3 English CAPS CARES Please Practise
Spellings Wk 3 English CAPS CARES Please PractiseSpellings Wk 3 English CAPS CARES Please Practise
Spellings Wk 3 English CAPS CARES Please Practise
 
Vishram Singh - Textbook of Anatomy Upper Limb and Thorax.. Volume 1 (1).pdf
Vishram Singh - Textbook of Anatomy  Upper Limb and Thorax.. Volume 1 (1).pdfVishram Singh - Textbook of Anatomy  Upper Limb and Thorax.. Volume 1 (1).pdf
Vishram Singh - Textbook of Anatomy Upper Limb and Thorax.. Volume 1 (1).pdf
 
Graduate Outcomes Presentation Slides - English
Graduate Outcomes Presentation Slides - EnglishGraduate Outcomes Presentation Slides - English
Graduate Outcomes Presentation Slides - English
 
Mehran University Newsletter Vol-X, Issue-I, 2024
Mehran University Newsletter Vol-X, Issue-I, 2024Mehran University Newsletter Vol-X, Issue-I, 2024
Mehran University Newsletter Vol-X, Issue-I, 2024
 
Sociology 101 Demonstration of Learning Exhibit
Sociology 101 Demonstration of Learning ExhibitSociology 101 Demonstration of Learning Exhibit
Sociology 101 Demonstration of Learning Exhibit
 
Explore beautiful and ugly buildings. Mathematics helps us create beautiful d...
Explore beautiful and ugly buildings. Mathematics helps us create beautiful d...Explore beautiful and ugly buildings. Mathematics helps us create beautiful d...
Explore beautiful and ugly buildings. Mathematics helps us create beautiful d...
 
On National Teacher Day, meet the 2024-25 Kenan Fellows
On National Teacher Day, meet the 2024-25 Kenan FellowsOn National Teacher Day, meet the 2024-25 Kenan Fellows
On National Teacher Day, meet the 2024-25 Kenan Fellows
 
Google Gemini An AI Revolution in Education.pptx
Google Gemini An AI Revolution in Education.pptxGoogle Gemini An AI Revolution in Education.pptx
Google Gemini An AI Revolution in Education.pptx
 
General Principles of Intellectual Property: Concepts of Intellectual Proper...
General Principles of Intellectual Property: Concepts of Intellectual  Proper...General Principles of Intellectual Property: Concepts of Intellectual  Proper...
General Principles of Intellectual Property: Concepts of Intellectual Proper...
 
Single or Multiple melodic lines structure
Single or Multiple melodic lines structureSingle or Multiple melodic lines structure
Single or Multiple melodic lines structure
 

Ch09 solution w_kieso_ifrs 1st edi.

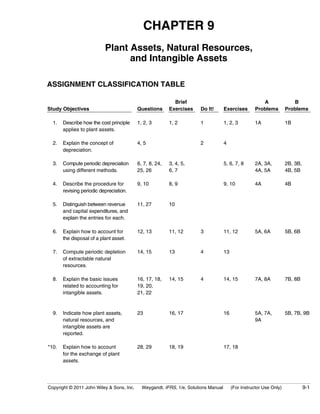
  • 1. CHAPTER 9 Plant Assets, Natural Resources, and Intangible Assets ASSIGNMENT CLASSIFICATION TABLE Study Objectives Questions Brief Exercises Do It! Exercises A Problems B Problems 1. Describe how the cost principle applies to plant assets. 1, 2, 3 1, 2 1 1, 2, 3 1A 1B 2. Explain the concept of depreciation. 4, 5 2 4 3. Compute periodic depreciation using different methods. 6, 7, 8, 24, 25, 26 3, 4, 5, 6, 7 5, 6, 7, 8 2A, 3A, 4A, 5A 2B, 3B, 4B, 5B 4. Describe the procedure for revising periodic depreciation. 9, 10 8, 9 9, 10 4A 4B 5. Distinguish between revenue and capital expenditures, and explain the entries for each. 11, 27 10 6. Explain how to account for the disposal of a plant asset. 12, 13 11, 12 3 11, 12 5A, 6A 5B, 6B 7. Compute periodic depletion of extractable natural resources. 14, 15 13 4 13 8. Explain the basic issues related to accounting for intangible assets. 16, 17, 18, 19, 20, 21, 22 14, 15 4 14, 15 7A, 8A 7B, 8B 9. Indicate how plant assets, natural resources, and intangible assets are reported. 23 16, 17 16 5A, 7A, 9A 5B, 7B, 9B *10. Explain how to account for the exchange of plant assets. 28, 29 18, 19 17, 18 Copyright © 2011 John Wiley & Sons, Inc. Weygandt, IFRS, 1/e, Solutions Manual (For Instructor Use Only) 9-1
  • 2. ASSIGNMENT CHARACTERISTICS TABLE Problem Number Description Difficulty Level Time Allotted (min.) 1A Determine acquisition costs of land and building. Simple 20–30 2A Compute depreciation under different methods. Simple 30–40 3A Compute depreciation under different methods. Moderate 30–40 4A Calculate revisions to depreciation expense. Moderate 20–30 5A Journalize a series of equipment transactions related to purchase, sale, retirement, and depreciation. Moderate 40–50 6A Record disposals. Simple 30–40 7A Prepare entries to record transactions related to acquisition and amortization of intangibles; prepare the intangible assets section. Moderate 30–40 8A Prepare entries to correct errors made in recording and amortizing intangible assets. Moderate 30–40 9A Calculate and comment on asset turnover ratio. Moderate 5–10 1B Determine acquisition costs of land and building. Simple 20–30 2B Compute depreciation under different methods. Simple 30–40 3B Compute depreciation under different methods. Moderate 30–40 4B Calculate revisions to depreciation expense. Moderate 20–30 5B Journalize a series of equipment transactions related to purchase, sale, retirement, and depreciation. Moderate 40–50 6B Record disposals. Simple 30–40 7B Prepare entries to record transactions related to acquisition and amortization of intangibles; prepare the intangible assets section. Moderate 30–40 8B Prepare entries to correct errors made in recording and amortizing intangible assets. Moderate 30–40 9B Calculate and comment on asset turnover ratio. Moderate 5–10 9-2 Copyright © 2011 John Wiley & Sons, Inc. Weygandt, IFRS, 1/e, Solutions Manual (For Instructor Use Only)
  • 3. WEYGANDT IFRS 1E CHAPTER 9 PLANT ASSETS, NATURAL RESOURCES, AND INTANGIBLE ASSETS Number SO BT Difficulty Time (min.) BE1 1 AP Simple 2–4 BE2 1 AP Simple 1–2 BE3 3 AP Simple 2–4 BE4 3 E Moderate 4–6 BE5 3 AP Simple 4–6 BE6 3 AP Simple 2–4 BE7 3 AP Simple 4–6 BE8 4 AN Moderate 4–6 BE9 4 AN Moderate 4–6 BE10 5 AP Simple 2–4 BE11 6 AP Simple 4–6 BE12 6 AP Simple 4–6 BE13 7 AP Simple 4–6 BE14 8 AP Simple 2–4 BE15 8 AP Simple 4–6 BE16 9 AP Simple 4–6 BE17 9 AP Simple 2–4 *BE18 10 AP Simple 4–6 *BE19 10 AP Simple 4–6 DI1 1 C Simple 4–6 DI2 2 AP Simple 2–4 DI3 6 AP Simple 6–8 DI4 7, 8 K Simple 2–4 EX1 1 C Simple 6–8 EX2 1 AP Simple 4–6 EX3 1 AP Simple 4–6 EX4 2 C Simple 4–6 EX5 3 AP Simple 6–8 EX6 3 AP Simple 8–10 EX7 3 AP Simple 10–12 EX8 3 AP Simple 8–10 EX9 4 AN Moderate 8–10 EX10 4 AP Moderate 6–8 Copyright © 2011 John Wiley & Sons, Inc. Weygandt, IFRS, 1/e, Solutions Manual (For Instructor Use Only) 9-3
  • 4. PLANT ASSETS, NATURAL RESOURCES, AND INTANGIBLE ASSETS (Continued) Number SO BT Difficulty Time (min.) EX11 6 AP Moderate 8–10 EX12 6 AP Moderate 10–12 EX13 7 AP Simple 6–8 EX14 8 AP Simple 4–6 EX15 8 AP Simple 8–10 EX16 9 AP Simple 2–4 EX17 10 AP Moderate 8–10 EX18 10 AP Moderate 8–10 P1A 1 C Simple 20–30 P2A 3 AP Simple 30–40 P3A 3 AN Moderate 30–40 P4A 3, 4 AP Moderate 20–30 P5A 3, 6, 9 AP Moderate 40–50 P6A 6 AP Simple 30–40 P7A 8, 9 AP Moderate 30–40 P8A 8 AP Moderate 30–40 P9A 9 AN Moderate 5–10 P1B 1 C Simple 20–30 P2B 3 AP Simple 30–40 P3B 3 AN Moderate 30–40 P4B 3, 4 AP Moderate 20–30 P5B 3, 6, 9 AP Moderate 40–50 P6B 6 AP Simple 30–40 P7B 8, 9 AP Moderate 30–40 P8B 8 AP Moderate 30–40 P9B 9 AN Moderate 5–10 BYP1 3, 8 AN Simple 15–20 BYP2 9 AN, E Simple 10–15 BYP3 2, 3 C Simple 10–15 BYP4 3 AP, E Moderate 20–25 BYP5 7 C Simple 5–10 BYP6 4 E Simple 10–15 9-4 Copyright © 2011 John Wiley & Sons, Inc. Weygandt, IFRS, 1/e, Solutions Manual (For Instructor Use Only)
  • 5. BLOOM’S TAXONOMY TABLE Copyright © 2011 John Wiley & Sons, Inc. Weygandt, IFRS, 1/e, Solutions Manual (For Instructor Use Only) 9-5 Correlation Chart between Bloom’s Taxonomy, Study Objectives and End-of-Chapter Exercises and Problems Study Objective Knowledge Comprehension Application Analysis Synthesis Evaluation 1. Describe how the cost principle applies to plant assets. Q9-1 Q9-2 Q9-3 DI9-1 E9-1 P9-1A P9-1B BE9-1 BE9-2 E9-2 E9-3 2. Explain the concept of depreciation. Q9-5 Q9-4 E9-4 DI9-2 3. Compute periodic depreciation using different methods. Q9-6 Q9-7 Q9-8 Q9-24 Q9-25 Q9-26 BE9-3 BE9-4 BE9-5 BE9-6 BE9-7 E9-5 E9-6 E9-7 E9-8 P9-2A P9-4A P9-5A P9-2B P9-4B P9-5B P9-3A P9-3B BE9-4 4. Describe the procedure for revising periodic depreciation. Q9-9 Q9-10 E9-10 P9-4A P9-4B BE9-8 BE9-9 E9-9 5. Distinguish between revenue and capital expenditures, and explain the entries for each. Q9-11 Q9-27 BE9-10 6. Explain how to account for the disposal of a plant asset. Q9-12 Q9-13 BE9-11 BE9-12 DI9-3 E9-11 E9-12 P9-5A P9-6A P9-5B P9-6B 7. Compute periodic depletion of extractable natural resources. Q9-14 DI9-4 Q9-15 BE9-13 E9-13 8. Explain the basic issues related to accounting for intangible assets. Q9-20 Q9-16 Q9-17 Q9-18 Q9-19 Q9-21 Q9-22 DI9-4 BE9-14 BE9-15 E9-14 E9-15 P9-7A P9-8A P9-7B P9-8B 9. Indicate how plant assets, natural resources, and intangible assets are reported. Q9-23 BE9-16 BE9-17 E9-16 P9-5A P9-7A P9-5B P9-7B P9-9A P9-9B *10. Explain how to account for the exchange of plant assets. Q9-28 Q9-29 BE9-18 BE9-19 E9-17 E9-18 Broadening Your Perspective Exploring the Web Communication Decision Making Across the Organization Financial Reporting Comp. Analysis Comp. Analysis Decision Making Across the Organization Ethics Case
  • 6. ANSWERS TO QUESTIONS 1. For plant assets, the cost principle means that cost consists of all expenditures necessary to acquire the asset and make it ready for its intended use. 2. Examples of land improvements include driveways, parking lots, fences, and underground sprinklers. 3. (a) When only the land is to be used, all demolition and removal costs of the building less any proceeds from salvaged materials are necessary expenditures to make the land ready for its intended use. (b) When both the land and building are to be used, necessary costs of the building include remodeling expenditures and the cost of replacing or repairing the roofs, floors, wiring, and plumbing. 4. You should explain to the president that depreciation is a process of allocating the cost of a plant asset to expense over its service (useful) life in a rational and systematic manner. Recognition of depreciation is not intended to result in the accumulation of cash for replacement of the asset. 5. (a) Residual value, also called salvage value, is the expected value of the asset at the end of its useful life. (b) Residual value is used in determining depreciation in each of the methods except the declining-balance method. 6. (a) Useful life is expressed in years under the straight-line method and in units of activity under the units-of-activity method. (b) The pattern of periodic depreciation expense over useful life is constant under the straight-line method and variable under the units-of-activity method. 7. The effects of the three methods on annual depreciation expense are: Straight-line—constant amount; units of activity—varying amount; declining-balance—decreasing amounts. 8. Component depreciation is a method of allocating the cost of a plant asset into separate parts based on the estimated useful lives of each component. IFRS requires an entity to use component depreciation whenever significant parts of a plant asset have significantly different useful lives. 9. A revision of depreciation is made in current and future years but not retroactively. The rationale is that continual restatement of prior periods would adversely affect confidence in the financial statements. 10. Revaluation is an accounting procedure that adjusts plant assets to fair value at the reporting date. Revaluation must be applied annually to assets that are experiencing rapid price changes. 9-6 Copyright © 2011 John Wiley & Sons, Inc. Weygandt, IFRS, 1/e, Solutions Manual (For Instructor Use Only)
  • 7. Questions Chapter 9 (Continued) 11. Revenue expenditures are ordinary repairs made to maintain the operating efficiency and productive life of the asset. Capital expenditures are additions and improvements made to increase operating efficiency, productive capacity, or useful life of the asset. Revenue expenditures are recognized as expenses when incurred; capital expenditures are generally debited to the plant asset affected. 12. In a sale of plant assets, the book value of the asset is compared to the proceeds received from the sale. If the proceeds of the sale exceed the book value of the plant asset, a gain on disposal occurs. If the proceeds of the sale are less than the book value of the plant asset sold, a loss on disposal occurs. 13. The plant asset and its accumulated depreciation should continue to be reported on the statement of financial position without further depreciation adjustment until the asset is retired. Reporting the asset and related accumulated depreciation on the statement of financial position informs the reader of the financial statements that the asset is still in use. However, once an asset is fully depreciated, even if it is still being used, no additional depreciation should be taken. In no situation can the accumulated depreciation on the plant asset exceed its cost. 14. Extractable natural resources consist of underground deposits of oil, gas, and minerals. These long-lived productive assets have two distinguishing characteristics: they are physically extracted in operations in or near the earth’s crust, and they are replaceable only by an act of nature. 15. Depletion is the allocation of the cost of extractable resources to expense in a rational and systematic manner over the resource’s useful life. It is computed by multiplying the depletion cost per unit by the number of units extracted and sold. 16. The terms depreciation, depletion, and amortization are all concerned with allocating the cost of an asset to expense over the periods benefited. Depreciation refers to allocating the cost of a plant asset to expense, depletion to recognizing the cost of an extractable resource as expense, and amortization to allocating the cost of an intangible asset to expense. 17. The intern is not correct. The cost of an intangible asset should be amortized over that asset’s useful life (the period of time when operations are benefited by use of the asset). In addition, some intangibles have indefinite lives and therefore are not amortized at all. 18. The favorable attributes which could result in goodwill include exceptional management, desirable location, good customer relations, skilled employees, high-quality products, and harmonious relations with labor unions. 19. Goodwill is the value of many favorable attributes that are intertwined in the business enterprise. Goodwill can be identified only with the business as a whole and, unlike other assets, cannot be sold separately. Goodwill can only be sold if the entire business is sold. And, if goodwill appears on the statement of financial position, it means the company has purchased another company for more than the fair value of its net assets. Copyright © 2011 John Wiley & Sons, Inc. Weygandt, IFRS, 1/e, Solutions Manual (For Instructor Use Only) 9-7
  • 8. Questions Chapter 9 (Continued) 20. Goodwill is recorded only when there is a transaction that involves the purchase of an entire business. Goodwill is the excess of cost over the fair value of the net assets (assets less liabilities) acquired. The recognition of goodwill without an exchange transaction would lead to subjective valuations which would reduce the reliability of financial statements. 21. Research and development costs present several accounting problems. It is sometimes difficult to assign the costs to specific projects, and there are uncertainties in identifying the extent and timing of future benefits. As a result, IFRS requires that research costs be recorded as an expense when incurred. Development costs incurred prior to technological feasibility are also expensed but development costs incurred after technological feasibility are capitalized. 22. Both types of development expenditures relate to the creation of new products but one is expensed and the other is capitalized. Development costs incurred before a new product achieves technological feasibility are recorded as development expenses and appear as part of operating expenses on the income statement. Cost incurred after technological feasibility are recorded as development costs and appear as an intangible asset on the statement of financial position. 23. McDonald’s asset turnover ratio is computed as follows: Net sales Average total assets = $20.5 billion $28.9 billion = .71 times 24. Since Resco uses the straight-line depreciation method, its depreciation expense will be lower in the early years of an asset’s useful life as compared to using an accelerated method. Yapan’s depreciation expense in the early years of an asset’s useful life will be higher as compared to the straight-line method. Resco’s net income will be higher than Yapan’s in the first few years of the asset’s useful life. And, the reverse will be true late in an asset’s useful life. 25. Yes, tax regulations often allow a company to use a different depreciation method on the tax return than is used in preparing financial statements. Lopez Corporation uses an accelerated depreciation method for tax purposes to minimize its income taxes and thereby the cash outflow for taxes. 26. By selecting a longer estimated useful life, May Corp. is spreading the plant asset’s cost over a longer period of time. The depreciation expense reported in each period is lower and net income is higher. Won’s choice of a shorter estimated useful life will result in higher depreciation expense reported in each period and lower net income. 27. Expensing these costs will make current period income lower but future period income higher because there will be no additional depreciation expense in future periods. If the costs are ordinary repairs, they should be expensed. 9-8 Copyright © 2011 John Wiley & Sons, Inc. Weygandt, IFRS, 1/e, Solutions Manual (For Instructor Use Only)
  • 9. Questions Chapter 9 (Continued) *28. When assets are exchanged, the gain or loss on disposal is computed as the difference between the book value and the fair value of the asset given up at the time of exchange. *29. Yes, Tatum should recognize a gain equal to the difference between the fair value of the old machine and its book value. If the fair value of the old machine is less than its book value, Tatum should recognize a loss equal to the difference between the two amounts. Copyright © 2011 John Wiley & Sons, Inc. Weygandt, IFRS, 1/e, Solutions Manual (For Instructor Use Only) 9-9
  • 10. SOLUTIONS TO BRIEF EXERCISES BRIEF EXERCISE 9-1 All of the expenditures should be included in the cost of the land. Therefore, the cost of the land is $81,000, or ($70,000 + $3,000 + $2,500 + $2,000 + $3,500). BRIEF EXERCISE 9-2 The cost of the truck is £31,900 (cash price £30,000 + sales tax £1,500 + painting and lettering £400). The expenditures for insurance and motor vehicle license should not be added to the cost of the truck. BRIEF EXERCISE 9-3 Depreciable cost of $36,000, or ($42,000 – $6,000). With a four-year useful life, annual depreciation is $9,000, or ($36,000 ÷ 4). Under the straight-line method, depreciation is the same each year. Thus, depreciation is $9,000 for both the first and second years. BRIEF EXERCISE 9-4 It is likely that management requested this accounting treatment to boost reported net income. Land is not depreciated; thus, by reporting land at HK$1,200,000 above its actual value the company increased yearly HK$1,200,000 income by HK$60,000, 20 years       or the reduction in depreciation expense. This practice is not ethical because management is knowingly misstating asset values. BRIEF EXERCISE 9-5 The declining balance rate is 50%, or (25% X 2) and this rate is applied to book value at the beginning of the year. The computations are: Book Value X Rate = Depreciation Year 1 Year 2 $42,000 ($42,000 – $21,000) 50% 50% $21,000 $10,500 9-10 Copyright © 2011 John Wiley & Sons, Inc. Weygandt, IFRS, 1/e, Solutions Manual (For Instructor Use Only)
  • 11. BRIEF EXERCISE 9-6 The depreciation cost per unit is 22 cents per mile computed as follows: Depreciable cost ($33,500 – $500) ÷ 150,000 = $.22 Year 1 30,000 miles X $.22 = $6,600 Year 2 20,000 miles X $.22 = $4,400 BRIEF EXERCISE 9-7 Warehouse component: ($280,000 – $40,000)/20 = $12,000 HVAC component: $40,000/10 = $4,000 Total component depreciation in first year $16,000 BRIEF EXERCISE 9-8 Book value, 1/1/11......................................................................................... €20,000 Less: Salvage value .................................................................................... 2,000 Depreciable cost............................................................................................ €18,000 Remaining useful life ................................................................................... 4 years Revised annual depreciation (€18,000 ÷ 4)........................................... € 4,500 BRIEF EXERCISE 9-9 (a) Accumulated Depreciation—Plant Assets .................. 60,000 Plant Assets.................................................................. 20,000 Revaluation Surplus .................................................. 40,000 (To record revaluation of plant assets) (b) Accumulated Depreciation—Plant Assets .................. 60,000 Revaluation Surplus ........................................................... 20,000 Plant Assets.................................................................. 80,000 (To record revaluation of plant assets) Copyright © 2011 John Wiley & Sons, Inc. Weygandt, IFRS, 1/e, Solutions Manual (For Instructor Use Only) 9-11
  • 12. BRIEF EXERCISE 9-10 1. Repair Expense.................................................................... 45 Cash................................................................................ 45 2. Delivery Truck ...................................................................... 400 Cash................................................................................ 400 BRIEF EXERCISE 9-11 (a) Accumulated Depreciation—Delivery Equipment ......................................................................... 41,000 Delivery Equipment.................................................... 41,000 (b) Accumulated Depreciation—Delivery Equipment ......................................................................... 39,000 Loss on Disposal................................................................. 2,000 Delivery Equipment.................................................... 41,000 Cost of delivery equipment CHF41,000 Less accumulated depreciation 39,000 Book value at date of disposal 2,000 Proceeds from sale 0 Loss on disposal CHF 2,000 BRIEF EXERCISE 9-12 (a) Depreciation Expense—Office Equipment.................. 5,250 Accumulated Depreciation—Office Equipment ................................................................ 5,250 (b) Cash......................................................................................... 20,000 Accumulated Depreciation—Office Equipment......... 47,250 Loss on Disposal................................................................. 4,750 Office Equipment........................................................ 72,000 9-12 Copyright © 2011 John Wiley & Sons, Inc. Weygandt, IFRS, 1/e, Solutions Manual (For Instructor Use Only)
  • 13. BRIEF EXERCISE 9-12 (Continued) Cost of office equipment $72,000 Less accumulated depreciation 47,250* Book value at date of disposal 24,750 Proceeds from sale 20,000 Loss on disposal $ 4,750 *$42,000 + $5,250 BRIEF EXERCISE 9-13 (a) Depletion cost per unit = ¥7,000,000 ÷ 35,000,000 = ¥.20 depletion cost per ton ¥.20 X 6,000,000 = ¥1,200,000 Depletion Expense.............................................. 1,200,000 Accumulated Depletion............................ 1,200,000 (b) Ore mine................................................................. ¥7,000,000 Less: Accumulated depletion ........................ 1,200,000 ¥5,800,000 BRIEF EXERCISE 9-14 (a) Amortization Expense—Patent (R$120,000 ÷ 10)....... 12,000 Patents............................................................................. 12,000 (b) Intangible Assets Patents............................................................................. R$108,000 Copyright © 2011 John Wiley & Sons, Inc. Weygandt, IFRS, 1/e, Solutions Manual (For Instructor Use Only) 9-13
  • 14. BRIEF EXERCISE 9-15 Research Expense ....................................................................... 300,000 Development Expense................................................................ 400,000 Development Costs...................................................................... 200,000 Cash......................................................................................... 900,000 (To record research and development costs) BRIEF EXERCISE 9-16 SPAIN COMPANY Statement of Financial Position (partial) December 31, 2011 Intangible assets Goodwill..................................................... $410,000 Property, plant, and equipment Coal mine .................................................. $ 500,000 Less: Accumulated depletion............ 108,000 $392,000 Buildings ................................................... 1,100,000 Less: Accumulated depreciation ..... 650,000 450,000 Total property, plant, and equipment.................................... 842,000 BRIEF EXERCISE 9-17 $61.5 ÷ $37.3 + $44.6 2       = 1.50 times *BRIEF EXERCISE 9-18 Delivery Equipment (new).......................................................... 24,000 Accumulated Depreciation—Delivery Equipment ............. 30,000 Loss on Disposal.......................................................................... 12,000 Delivery Equipment (old) .................................................. 61,000 Cash......................................................................................... 5,000 9-14 Copyright © 2011 John Wiley & Sons, Inc. Weygandt, IFRS, 1/e, Solutions Manual (For Instructor Use Only)
  • 15. *BRIEF EXERCISE 9-18 (Continued) Fair value of old delivery equipment $19,000 Cash paid 5,000 Cost of new delivery equipment $24,000 Fair value of old delivery equipment $19,000 Book value of old delivery equipment ($61,000 – $30,000) 31,000 Loss on disposal $12,000 *BRIEF EXERCISE 9-19 Delivery Equipment (new) ......................................................... 43,000 Accumulated Depreciation—Delivery Equipment............. 30,000 Gain on Disposal................................................................. 7,000 Delivery Equipment (old).................................................. 61,000 Cash......................................................................................... 5,000 Fair value of old delivery equipment $38,000 Cash paid 5,000 Cost of new delivery equipment $43,000 Fair value of old delivery equipment $38,000 Book value of old delivery equipment ($61,000 – $30,000) 31,000 Gain on disposal $ 7,000 Copyright © 2011 John Wiley & Sons, Inc. Weygandt, IFRS, 1/e, Solutions Manual (For Instructor Use Only) 9-15
  • 16. SOLUTIONS FOR DO IT! REVIEW EXERCISES DO IT! 9-1 The following four items are expenditures necessary to acquire the truck and get it ready for use: Negotiated purchase price ....................................................... £24,000 Installation of special shelving ............................................... 1,100 Painting and lettering................................................................. 900 Sales tax ......................................................................................... 1,300 Total paid............................................................................... £27,300 Thus, the cost of the truck is £27,300. The payments for the motor vehicle license and for the insurance are operating costs and are expensed in the first year of the truck’s life. DO IT! 9-2 Depreciation expense = Cost – Residual value $15,000 – $1,000 Useful life = 8 years = $1,750 The entry to record the first year’s depreciation would be: Depreciation Expense................................................................ 1,750 Accumulated Depreciation ................................................ 1,750 (To record annual depreciation on mower) DO IT! 9-3 (a) Sale of truck for cash at a gain: Cash........................................................................................ 26,000 Accumulated Depreciation—Truck................................ 28,000 Truck................................................................................ 50,000 Gain on Disposal.......................................................... 4,000 9-16 Copyright © 2011 John Wiley & Sons, Inc. Weygandt, IFRS, 1/e, Solutions Manual (For Instructor Use Only)
  • 17. DO IT! 9-3 (Continued) (b) Sale of truck for cash at a loss: Cash........................................................................................ 15,000 Loss on Disposal ................................................................ 7,000 Accumulated Depreciation—Truck ............................... 28,000 Truck ............................................................................... 50,000 DO IT! 9-4 1. b. Intangible assets 2. d. Amortization 3. e. Franchise 4. f. Development costs 5. a. Goodwill 6. c. Development expenses Copyright © 2011 John Wiley & Sons, Inc. Weygandt, IFRS, 1/e, Solutions Manual (For Instructor Use Only) 9-17
  • 18. SOLUTIONS TO EXERCISES EXERCISE 9-1 (a) Under the cost principle, the acquisition cost for a plant asset includes all expenditures necessary to acquire the asset and make it ready for its intended use. For example, the cost of factory machinery includes the purchase price, freight costs paid by the purchaser, insurance costs during transit, and installation costs. (b) 1. Land 2. Factory Machinery 3. Delivery Equipment 4. Land Improvements 5. Delivery Equipment 6. Factory Machinery 7. Prepaid Insurance 8. License Expense EXERCISE 9-2 1. Factory Machinery 2. Truck 3. Factory Machinery 4. Land 5. Prepaid Insurance 6. Land Improvements 7. Land Improvements 8. Land 9. Building 9-18 Copyright © 2011 John Wiley & Sons, Inc. Weygandt, IFRS, 1/e, Solutions Manual (For Instructor Use Only)
  • 19. EXERCISE 9-3 (a) Cost of land Cash paid ................................................................................. €80,000 Net cost of removing warehouse (€8,600 – €1,700) ................................................................ 6,900 Attorney’s fee ......................................................................... 1,100 Real estate broker’s fee ...................................................... 5,000 Total .................................................................................. €93,000 (b) The architect’s fee (€7,800) should be debited to the Building account. The cost of the driveways and parking lot (€14,000) should be debited to Land Improvements. EXERCISE 9-4 1. False. Depreciation is a process of cost allocation, not asset valuation. 2. True. 3. False. The book value of a plant asset may be quite different from its fair value. 4. False. Depreciation applies to three classes of plant assets: land improve-ments, buildings, and equipment. 5. False. Depreciation does not apply to land because its usefulness and revenue-producing ability generally remain intact over time. 6. True. 7. False. Recognizing depreciation on an asset does not result in an accu-mulation of cash for replacement of the asset. 8. True. 9. False. Depreciation expense is reported on the income statement, and accumulated depreciation is reported as a deduction from plant assets on the statement of financial position. 10. False. Three factors affect the computation of depreciation: cost, useful life, and residual value (also called salvage value). Copyright © 2011 John Wiley & Sons, Inc. Weygandt, IFRS, 1/e, Solutions Manual (For Instructor Use Only) 9-19
  • 20. EXERCISE 9-5 (a) Depreciation cost per unit is R$1.60 per mile [(R$168,000 – R$8,000) ÷ 100,000]. (b) Computation End of Year Year Units of Activity X Depreciation Cost /Unit = Annual Depreciation Expense Accumulated Depreciation Book Value 2011 2012 2013 2014 26,000 32,000 25,000 17,000 R$1.60 1.60 1.60 1.60 R$41,600 51,200 40,000 27,200 R$ 41,600 92,800 132,800 160,000 R$126,400 75,200 35,200 8,000 EXERCISE 9-6 (a) Straight-line method: $120,000 – $12,000 5       = $21,600 per year. 2011 depreciation = $21,600 X 3/12 = $5,400. (b) Units-of-activity method: $120,000 – $12,000 10,000       = $10.80 per hour. 2011 depreciation = 1,700 hours X $10.80 = $18,360. (c) Declining-balance method: 2011 depreciation = $120,000 X 40% X 3/12 = $ 12,000. Book value January 1, 2012 = $120,000 – $12,000 = $108,000. 2012 depreciation = $108,000 X 40% = $ 43,200. 9-20 Copyright © 2011 John Wiley & Sons, Inc. Weygandt, IFRS, 1/e, Solutions Manual (For Instructor Use Only)
  • 21. EXERCISE 9-7 (a) (1) 2011: (R$30,000 – R$2,000)/8 = R$3,500 2012: (R$30,000 – R$2,000)/8 = R$3,500 (2) (R$30,000 – R$2,000)/100,000 = R$0.28 per mile 2011: 15,000 X R$0.28 = R$4,200 2012: 12,000 X R$0.28 = R$3,360 (3) 2011: R$30,000 X 25% = R$7,500 2012: (R$30,000 – R$7,500) X 25% = R$5,625 (b) (1) Depreciation Expense.................................................. 3,500 Accumulated Depreciation—Delivery Truck........ 3,500 (2) Delivery Truck ................................................................ R$30,000 Less: Accumulated Depreciation............................ 3,500 R$26,500 EXERCISE 9-8 Building depreciation: $1,920,000*/40 years = $ 48,000 Personal property depreciation: $300,000/5 years = 60,000 Land improvements depreciation: $180,000/10 years = 18,000 Total component depreciation $126,000 *$2,400,000 – $300,000 – $180,000 = $1,920,000 EXERCISE 9-9 (a) Type of Asset Building Warehouse Book value, 1/1/11 Less: Residual value Depreciable cost Remaining useful life in years Revised annual depreciation (a) ÷ (b) (a) (b) $686,000 37,000 $649,000 44 $ 14,750 $75,000 3,600 $71,400 15 $ 4,760 Copyright © 2011 John Wiley & Sons, Inc. Weygandt, IFRS, 1/e, Solutions Manual (For Instructor Use Only) 9-21
  • 22. EXERCISE 9-9 (Continued) (b) Dec. 31 Depreciation Expense—Building............... 14,750 Accumulated Depreciation— Building................................................. 14,750 EXERCISE 9-10 (a) Depreciation Expense........................................................ 70,000 Accumulated Depreciation—Plant Assets.......... 70,000 (To record depreciation expense) (b) Accumulated Depreciation—Plant Assets.................. 70,000 Plant Assets.................................................................. 30,000 Revaluation Surplus................................................... 40,000 (To adjust the plant assets to fair value and record revaluation surplus) (c) Depreciation Expense........................................................ 80,000* Accumulated Depreciation—Plant Assets.......... 80,000 (To record depreciation expense) *$350,000 – $30,000 = $320,000; $320,000/4 years = $80,000 EXERCISE 9-11 Jan. 1 Accumulated Depreciation—Machinery .......... 62,000 Machinery.......................................................... 62,000 June 30 Depreciation Expense............................................ 4,000 Accumulated Depreciation—Computer (£40,000 X 1/5 X 6/12) ................................ 4,000 30 Cash............................................................................. 14,000 Accumulated Depreciation—Computer (£40,000 X 3/5 = £24,000; £24,000 + £4,000)...................................................... 28,000 Gain on Disposal [£14,000 – (£40,000 – £28,000)] .............. 2,000 Computer........................................................... 40,000 9-22 Copyright © 2011 John Wiley & Sons, Inc. Weygandt, IFRS, 1/e, Solutions Manual (For Instructor Use Only)
  • 23. EXERCISE 9-11 (Continued) Dec. 31 Depreciation Expense ........................................... 6,000 Accumulated Depreciation—Truck [(£39,000 – £3,000) X 1/6]......................... 6,000 31 Loss on Disposal .................................................... 9,000 Accumulated Depreciation—Truck [(£39,000 – £3,000) X 5/6].................................. 30,000 Delivery Truck ................................................. 39,000 EXERCISE 9-12 (a) Cash...................................................................................... 28,000 Accumulated Depreciation—Equipment [($50,000 – $5,000) X 3/5] .......................................... 27,000 Equipment................................................................. 50,000 Gain on Disposal .................................................... 5,000 (b) Depreciation Expense [($50,000 – $5,000) X 1/5 X 4/12] .............................. 3,000 Accumulated Depreciation—Equipment........ 3,000 Cash...................................................................................... 28,000 Accumulated Depreciation—Equipment ($27,000 + $3,000)......................................................... 30,000 Equipment................................................................ 50,000 Gain on Disposal ................................................... 8,000 (c) Cash ........................................................................................ 11,000 Accumulated Depreciation—Equipment..................... 27,000 Loss on Disposal ................................................................ 12,000 Equipment..................................................................... 50,000 Copyright © 2011 John Wiley & Sons, Inc. Weygandt, IFRS, 1/e, Solutions Manual (For Instructor Use Only) 9-23
  • 24. EXERCISE 9-12 (Continued) (d) Depreciation Expense [($50,000 – $5,000) ÷ 5 X 9/12]..................................... 6,750 Accumulated Depreciation—Equipment............. 6,750 Cash......................................................................................... 11,000 Accumulated Depreciation—Equipment ($27,000 + $6,750)............................................................ 33,750 Loss on Disposal................................................................. 5,250 Equipment ..................................................................... 50,000 EXERCISE 9-13 (a) Dec. 31 Depletion Expense.......................................... 90,000 Accumulated Depletion (100,000 X CHF.90) ............................ 90,000 Cost (a) CHF720,000 Units estimated (b) 800,000 tons Depletion cost per unit [(a) ÷ (b)] CHF.90 (b) The costs pertaining to the unsold units are reported in current assets as part of inventory (20,000 X CHF.90 = CHF18,000). EXERCISE 9-14 Dec. 31 Amortization Expense—Patent ....................... 12,000 Patents ($90,000 ÷ 5 X 8/12)..................... 12,000 Note: No entry is made to amortize goodwill because it has an indefinite life. 9-24 Copyright © 2011 John Wiley & Sons, Inc. Weygandt, IFRS, 1/e, Solutions Manual (For Instructor Use Only)
  • 25. EXERCISE 9-15 1/2/11 Patents .................................................................... 560,000 Cash................................................................ 560,000 4/1/11 Goodwill.................................................................. 360,000 Cash................................................................ 360,000 (Part of the entry to record purchase of another company) 7/1/11 Franchise................................................................ 440,000 Cash................................................................ 440,000 9/1/11 Research Expense .............................................. 185,000 Cash................................................................ 185,000 11/1/11 Development Expense....................................... 225,000 Cash................................................................ 225,000 12/31/11 Amortization Expense—Patent ($560,000 ÷ 7) .................................................... 80,000 Amortization Expense—Franchise [($440,000 ÷ 10) X 1/2] .................................... 22,000 Patents....................................................... 80,000 Franchise .................................................. 22,000 Ending balances, 12/31/11: Patent = $480,000 ($560,000 – $80,000). Goodwill = $360,000 Franchise = $418,000 ($440,000 – $22,000). EXERCISE 9-16 Asset turnover ratio = $4,900,000 $1,400,000 = 3.5 times Copyright © 2011 John Wiley & Sons, Inc. Weygandt, IFRS, 1/e, Solutions Manual (For Instructor Use Only) 9-25
  • 26. *EXERCISE 9-17 (a) Trucks (new).......................................................................... 53,000 Accumulated Depreciation—Trucks (old) ................... 22,000 Loss on Disposal................................................................. 6,000 Trucks (old)................................................................... 64,000 Cash ................................................................................ 17,000 Cost of old trucks £64,000 Less: Accumulated depreciation 22,000 Book value 42,000 Fair value of old trucks 36,000 Loss on disposal £ 6,000 Fair value of old trucks £36,000 Cash paid 17,000 Cost of new trucks £53,000 (b) Machine (new)....................................................................... 12,000 Accumulated Depreciation—Machine (old) ................ 4,000 Gain on Disposal ........................................................ 1,000 Machine (old)................................................................ 12,000 Cash ................................................................................ 3,000 Cost of old machine £12,000 Less: Accumulated depreciation 4,000 Book value 8,000 Fair value of old machine 9,000 Gain on disposal £ 1,000 Fair value of old machine £ 9,000 Cash paid 3,000 Cost of new machine £12,000 9-26 Copyright © 2011 John Wiley & Sons, Inc. Weygandt, IFRS, 1/e, Solutions Manual (For Instructor Use Only)
  • 27. *EXERCISE 9-18 (a) Delivery Truck (new) .......................................................... 4,000 Loss on Disposal................................................................. 3,000 Accumulated Depreciation—Delivery Truck (old)......................................................................... 15,000 Delivery Truck (old) ................................................... 22,000 Cost of old truck $22,000 Less: Accumulated depreciation 15,000 Book value 7,000 Fair value of old truck 4,000 Loss on disposal $ 3,000 (b) Delivery Truck (new) .......................................................... 4,000 Accumulated Depreciation—Delivery Trucks (old)....................................................................... 8,000 Delivery Truck (old) ................................................... 10,000 Gain on Disposal........................................................ 2,000 Cost of old truck $10,000 Less: Accumulated depreciation 8,000 Book value 2,000 Fair value of old truck 4,000 Gain on Disposal $ 2,000 Cost of new delivery truck* $ 4,000 *Fair value of old truck Copyright © 2011 John Wiley & Sons, Inc. Weygandt, IFRS, 1/e, Solutions Manual (For Instructor Use Only) 9-27
  • 28. SOLUTIONS TO PROBLEMS PROBLEM 9-1A Item Land Building Other Accounts 1 € 4,000) 2 3 4 ( 145,000) 5 6 7 ( 2,000) 8 9 ( 15,000) 10 (3,500) (€162,500) €700,000 35,000 10,000 €745,000 € 5,000 Property Taxes Expense 14,000 Land Improvements 9-28 Copyright © 2011 John Wiley & Sons, Inc. Weygandt, IFRS, 1/e, Solutions Manual (For Instructor Use Only)
  • 29. PROBLEM 9-2A (a) Year Computation Accumulated Depreciation 12/31 BUS 1 2009 2010 2011 $ 90,000 X 20% = $18,000 $ 90,000 X 20% = $18,000 $ 90,000 X 20% = $18,000 $ 18,000 36,000 54,000 BUS 2 2009 2010 2011 $120,000 X 50% = $60,000 $ 60,000 X 50% = $30,000 $ 30,000 X 50% = $15,000 $ 60,000 90,000 105,000 BUS 3 2010 2011 24,000 miles X $.60* = $14,400 34,000 miles X $.60* = $20,400 $ 14,400 34,800 *$72,000 ÷ 120,000 miles = $.60 per mile. (b) Year Computation Expense BUS 2 1. 2. 2009 2010 $120,000 X 50% X 9/12 = $45,000 $75,000 X 50% = $37,500 $45,000 $37,500 Copyright © 2011 John Wiley & Sons, Inc. Weygandt, IFRS, 1/e, Solutions Manual (For Instructor Use Only) 9-29
  • 30. PROBLEM 9-3A (a) 1. Purchase price.......................................................................... R$ 38,000 Sales tax ..................................................................................... 1,700 Shipping costs.......................................................................... 150 Insurance during shipping ................................................... 80 Installation and testing .......................................................... 70 Total cost of machine.................................................... R$ 40,000 Machine.......................................................................... 40,000 Cash ....................................................................... 40,000 2. Recorded cost........................................................................... R$ 40,000 Less: Residual value ............................................................. 5,000 Depreciable cost ...................................................................... R$ 35,000 Years of useful life................................................................... ÷ 5 Annual depreciation....................................................... R$ 7,000 Depreciation Expense............................................... 7,000 Accumulated Depreciation ............................. 7,000 (b) 1. Recorded cost........................................................................... 160,000 Less: Residual value ............................................................. 10,000 Depreciable cost ...................................................................... R$150,000 Years of useful life................................................................... ÷ 4 Annual depreciation....................................................... R$ 37,500 2. Year Book Value at Beginning of Year DDB Rate Annual Depreciation Expense Accumulated Depreciation 2011 2012 2013 2014 R$160,000 80,000 40,000 20,000 *50%* *50%* *50%* *50%* R$80,000 40,000 20,000 10,000 R$ 80,000 120,000 140,000 150,000 **100% ÷ 4-year useful life = 25% X 2 = 50%. 9-30 Copyright © 2011 John Wiley & Sons, Inc. Weygandt, IFRS, 1/e, Solutions Manual (For Instructor Use Only)
  • 31. PROBLEM 9-3A (Continued) 3. Depreciation cost per unit = (R$160,000 – R$10,000)/125,000 units = R$1.20 per unit. Annual Depreciation Expense 2011: R$1.20 X 45,000 = R$54,000 2012: 1.20 X 35,000 = 42,000 2013: 1.20 X 25,000 = 30,000 2014: 1.20 X 20,000 = 24,000 (c) The declining-balance method reports the highest amount of depreciation expense the first year while the straight-line method reports the lowest. In the fourth year, the straight-line method reports the highest amount of depreciation expense while the declining-balance method reports the lowest. These facts occur because the declining-balance method is an acceler-ated depreciation method in which the largest amount of depreciation is recognized in the early years of the asset’s life. If the straight-line method is used, the same amount of depreciation expense is recognized each year. Therefore, in the early years less depreciation expense will be recognized under this method than under the declining-balance method while more will be recognized in the later years. The amount of depreciation expense recognized using the units-of-activity method is dependent on production, so this method could recognize more or less depreciation expense than the other two methods in any year depending on output. No matter which of the three methods is used, the same total amount of depreciation expense will be recognized over the four-year period. Copyright © 2011 John Wiley & Sons, Inc. Weygandt, IFRS, 1/e, Solutions Manual (For Instructor Use Only) 9-31
  • 32. PROBLEM 9-4A Year Depreciation Expense Accumulated Depreciation 2009 2010 2011 2012 2013 2014 2015 (b)$13,500(a) 13,500 (b)10,800(b) 10,800 10,800 12,800(c) 12,800 $13,500 27,000 37,800 48,600 59,400 72,200 85,000 (a) $90,000 – $9,000 6 years = $13,500 (b)Book value – Residual value Remaining useful life = $63,000 – $9,000 5 years = $10,800 (c) $30,600 – $5,000 2 years = $12,800 9-32 Copyright © 2011 John Wiley & Sons, Inc. Weygandt, IFRS, 1/e, Solutions Manual (For Instructor Use Only)
  • 33. PROBLEM 9-5A (a) Apr. 1 Land .......................................................... 2,130,000 Cash ................................................. 2,130,000 May 1 Depreciation Expense......................... 26,000 Accumulated Depreciation— Equipment (€780,000 X 1/10 X 4/12)......... 26,000 1 Cash.......................................................... 450,000 Accumulated Depreciation— Equipment .......................................... 338,000 Equipment...................................... 780,000 Gain on Disposal ......................... 8,000 Cost €780,000 Accum. depreciation— equipment 338,000 [(€780,000 X 1/10 X 4) + €26,000] Book value 442,000 Cash proceeds 450,000 Gain on disposal € 8,000 June 1 Cash.......................................................... 1,500,000 Land ................................................. 400,000 Gain on Disposal ......................... 1,100,000 July 1 Equipment............................................... 2,000,000 Cash ................................................. 2,000,000 Dec. 31 Depreciation Expense......................... 50,000 Accumulated Depreciation— Equipment (€500,000 X 1/10)...................... 50,000 31 Accumulated Depreciation— Equipment .......................................... 500,000 Equipment...................................... 500,000 Copyright © 2011 John Wiley & Sons, Inc. Weygandt, IFRS, 1/e, Solutions Manual (For Instructor Use Only) 9-33
  • 34. PROBLEM 9-5A (Continued) Cost €500,000 Accum. depreciation— equipment 500,000 (€500,000 X 1/10 X 10) Book value € 0 (b) Dec. 31 Depreciation Expense ........................ 570,000 Accumulated Depreciation— Buildings ................................... 570,000 (€28,500,000 X 1/50) 31 Depreciation Expense ........................ 4,772,000 Accumulated Depreciation— Equipment................................. 4,772,000 (€46,720,000* X 1/10) €4,672,000 [(€2,000,000 X 1/10) X 6/12] 100,000 €4,772,000 *(€48,000,000 – €780,000 – €500,000) (c) JIMENEZ COMPANY Partial Statement of Financial Position December 31, 2012 Plant Assets* Land .............................................................. € 5,730,000 Buildings ..................................................... €28,500,000 Less: Accumulated depreciation— buildings ........................................ 12,670,000 15,830,000 Equipment................................................... 48,720,000 Less: Accumulated depreciation— equipment...................................... 9,010,000 39,710,000 Total...................................................... €61,270,000 *See T-accounts which follow. 9-34 Copyright © 2011 John Wiley & Sons, Inc. Weygandt, IFRS, 1/e, Solutions Manual (For Instructor Use Only)
  • 35. PROBLEM 9-5A (Continued) Land Bal. 4,000,000 Apr. 1 2,130,000 June 1 400,000 Bal. 5,730,000 Buildings Bal. 28,500,000 Bal. 28,500,000 Accumulated Depreciation—Buildings Bal. 12,100,000 Dec. 31 adj. 570,000 Bal. 12,670,000 Equipment Bal. 48,000,000 July 1 2,000,000 May 1 780,000 Dec. 31 500,000 Bal. 48,720,000 Accumulated Depreciation—Equipment May 1 338,000 Dec. 31 500,000 Bal. 5,000,000 May 1 26,000 Dec. 31 50,000 Dec. 31 adj. 4,772,000 Bal. 9,010,000 Copyright © 2011 John Wiley & Sons, Inc. Weygandt, IFRS, 1/e, Solutions Manual (For Instructor Use Only) 9-35
  • 36. PROBLEM 9-6A (a) Accumulated Depreciation—Office Furniture............................................................................. 50,000 Loss on Disposal................................................................. 25,000 Office Furniture ........................................................... 75,000 (b) Cash......................................................................................... 21,000 Accumulated Depreciation—Office Furniture............................................................................. 50,000 Loss on Disposal................................................................. 4,000 Office Furniture ........................................................... 75,000 (c) Cash......................................................................................... 31,000 Accumulated Depreciation—Office Furniture............................................................................. 50,000 Gain on Disposal ........................................................ 6,000 Office Furniture ........................................................... 75,000 9-36 Copyright © 2011 John Wiley & Sons, Inc. Weygandt, IFRS, 1/e, Solutions Manual (For Instructor Use Only)
  • 37. PROBLEM 9-7A (a) Jan. 2 Patents ............................................................... 45,000 Cash ........................................................... 45,000 Jan.– Research June Expense......................................................... 140,000 Cash ........................................................... 140,000 Sept. 1 Advertising Expense ..................................... 50,000 Cash ........................................................... 50,000 Oct. 1 Franchise........................................................... 100,000 Cash ........................................................... 100,000 (b) Dec. 31 Amortization Expense—Patents................ 12,000 Patents ...................................................... 12,000 [($70,000 X 1/10) + ($45,000 X 1/9)] 31 Amortization Expense—Franchise........... 5,300 Franchise.................................................. 5,300 [($48,000 X 1/10) + ($100,000 X 1/50 X 3/12)] (c) Intangible Assets Patents ($115,000 cost – $19,000 amortization) (1) ................ $ 96,000 Franchise ($148,000 cost – $24,500 amortization) (2)............ 123,500 Total intangible assets ............................................................ $219,500 (1) Cost ($70,000 + $45,000); amortization ($7,000 + $12,000). (2) Cost ($48,000 + $100,000); amortization ($19,200 + $5,300). Copyright © 2011 John Wiley & Sons, Inc. Weygandt, IFRS, 1/e, Solutions Manual (For Instructor Use Only) 9-37
  • 38. PROBLEM 9-8A 1. Research Expense .......................................................... 86,000 Development Expense................................................... 50,000 Patents ....................................................................... 136,000 Patents ................................................................................ 6,800 Amortization Expense—Patents [$9,800 – ($60,000 X 1/20)]............................... 6,800 2. Goodwill.............................................................................. 920 Amortization Expense—Goodwill ..................... 920 Note: Goodwill should not be amortized because it has an indefinite life unlike Patents. 9-38 Copyright © 2011 John Wiley & Sons, Inc. Weygandt, IFRS, 1/e, Solutions Manual (For Instructor Use Only)
  • 39. PROBLEM 9-9A (a) Luó Zhào Asset turnover ratio HK$1,200,000 HK$2,500,000 = .48 times HK$1,080,000 HK$2,000,000 = .54 times (b) Based on the asset turnover ratio, Zhào is more effective in using assets to generate sales. Its asset turnover ratio is almost 13% higher than Luó’s ratio. Copyright © 2011 John Wiley & Sons, Inc. Weygandt, IFRS, 1/e, Solutions Manual (For Instructor Use Only) 9-39
  • 40. PROBLEM 9-1B Item Land Building Other Accounts 1 ($ 5,000) 2 3 4 5 100,000 6 7 8 9 10 ( 17,000) ( (3,500) ($118,500) $500,000 19,000 9,000 $528,000 $ 7,500 Property Taxes Expense 18,000 Land Improvements 6,000 Land Improvements 9-40 Copyright © 2011 John Wiley & Sons, Inc. Weygandt, IFRS, 1/e, Solutions Manual (For Instructor Use Only)
  • 41. PROBLEM 9-2B (a) Year Computation Accumulated Depreciation 12/31 MACHINE 1 2009 2010 2011 ¥100,000 X 10% = ¥10,000 ¥100,000 X 10% = ¥10,000 ¥100,000 X 10% = ¥10,000 ¥10,000 20,000 30,000 MACHINE 2 2009 2010 2011 ¥150,000 X 25% = ¥37,500 ¥112,500 X 25% = ¥28,125 ¥ 84,375 X 25% = ¥21,094 ¥37,500 65,625 86,719 MACHINE 3 2011 2,000 X (¥85,000 ÷ 25,000) = ¥6,800 ¥ 6,800 (b) Year Depreciation Computation Expense MACHINE 2 1. 2. 2009 2010 ¥150,000 X 25% X 8/12 = ¥25,000 ¥125,000 X 25% = ¥31,250 ¥25,000 ¥31,250 Copyright © 2011 John Wiley & Sons, Inc. Weygandt, IFRS, 1/e, Solutions Manual (For Instructor Use Only) 9-41
  • 42. PROBLEM 9-3B (a) 1. Purchase price.............................................................................. $ 55,000 Sales tax ......................................................................................... 2,750 Shipping costs.............................................................................. 100 Insurance during shipping ....................................................... 75 Installation and testing .............................................................. 75 Total cost of machine........................................................ $ 58,000 Machine.......................................................................... 58,000 Cash ....................................................................... 58,000 2. Recorded cost............................................................................... $ 58,000 Less: Residual value ................................................................. 5,000 Depreciable cost .......................................................................... $ 53,000 Years of useful life....................................................................... ÷ 4 Annual depreciation........................................................... $ 13,250 Depreciation Expense............................................... 13,250 Accumulated Depreciation ............................. 13,250 (b) 1. Recorded cost............................................................................... $100,000 Less: Residual value ................................................................. 10,000 Depreciable cost .......................................................................... $90,000 Years of useful life....................................................................... ÷ 4 Annual depreciation........................................................... $ 22,500 2. Year Book Value at Beginning of Year DDB Rate Annual Depreciation Expense Accumulated Depreciation 2011 2012 2013 2014 $100,000 50,000 25,000 12,500 *50%* *50%* *50%* *50%* $50,000 25,000 12,500 2,500** $50,000 75,000 87,500 90,000 *100% ÷ 4-year useful life = 25% X 2 = 50%. **$12,500 – $10,000 = $2,500. 9-42 Copyright © 2011 John Wiley & Sons, Inc. Weygandt, IFRS, 1/e, Solutions Manual (For Instructor Use Only)
  • 43. PROBLEM 9-3B (Continued) 3. Depreciation cost per unit = ($100,000 – $10,000)/25,000 units = $3.60 per unit. Annual Depreciation Expense 2011: $3.60 X 5,500 = $19,800 2012: 3.60 X 7,000 = 25,200 2013: 3.60 X 8,000 = 28,800 2014: 3.60 X 4,500 = 16,200 (c) The units-of-activity method reports the lowest amount of depreciation expense the first year while the declining-balance method reports the highest. In the fourth year, the declining-balance method reports the lowest amount of depreciation expense while the straight-line method reports the highest. These facts occur because the declining-balance method is an accelerated depreciation method in which the largest amount of depreciation is recognized in the early years of the asset’s life. If the straight-line method is used, the same amount of depreciation expense is recognized each year. Therefore, in the early years less depreciation expense will be recognized under this method than under the declining-balance method while more will be recognized in the later years. The amount of depreciation expense recognized using the units-of-activity method is dependent on production, so this method could recognize more or less depreciation expense than the other two methods in any year depending on output. No matter which of the three methods is used, the same total amount of depreciation expense will be recognized over the four-year period. Copyright © 2011 John Wiley & Sons, Inc. Weygandt, IFRS, 1/e, Solutions Manual (For Instructor Use Only) 9-43
  • 44. PROBLEM 9-4B Year Depreciation Expense Accumulated Depreciation 2009 2010 2011 2012 2013 2014 2015 £30,000(a) 30,000 24,000(b) 24,000 24,000 31,500(c) 31,500 £ 30,000 60,000 84,000 108,000 132,000 163,500 195,000 (a) £200,000 – £20,000 6 years = £30,000 (b)Book value – Residual value Remaining useful life = £140,000 – £20,000 5 years = £24,000 (c) £68,000 – £5,000 2 years = £31,500 9-44 Copyright © 2011 John Wiley & Sons, Inc. Weygandt, IFRS, 1/e, Solutions Manual (For Instructor Use Only)
  • 45. PROBLEM 9-5B (a) Apr. 1 Land .......................................................... 1,200,000 Cash ................................................. 1,200,000 May 1 Depreciation Expense......................... 14,000 Accumulated Depreciation— Equipment ................................. ($420,000 X 1/10 X 4/12) ........ 14,000 1 Cash.......................................................... 240,000 Accumulated Depreciation— Equipment .......................................... 182,000 Equipment...................................... 420,000 Gain on Disposal ......................... 2,000 Cost $420,000 Accum. depreciation— equipment 182,000 [($420,000 X 1/10 X 4) + $14,000] Book value 238,000 Cash proceeds 240,000 Gain on disposal $ 2,000 June 1 Cash.......................................................... 1,000,000 Land ................................................. 340,000 Gain on Disposal ......................... 660,000 July 1 Equipment............................................... 1,100,000 Cash ................................................. 1,100,000 Dec. 31 Depreciation Expense......................... 30,000 Accumulated Depreciation— Equipment ($300,000 X 1/10)...................... 30,000 31 Accumulated Depreciation— Equipment .......................................... 300,000 Equipment...................................... 300,000 Copyright © 2011 John Wiley & Sons, Inc. Weygandt, IFRS, 1/e, Solutions Manual (For Instructor Use Only) 9-45
  • 46. PROBLEM 9-5B (Continued) Cost $300,000 Accum. depreciation— equipment 300,000 ($300,000 X 1/10 X 10) Book value $ 0 (b) Dec. 31 Depreciation Expense ........................ 400,000 Accumulated Depreciation— Buildings ($20,000,000 X 1/50) ............... 400,000 31 Depreciation Expense ........................ 2,983,000 Accumulated Depreciation— Equipment................................. 2,983,000 ($29,280,000* X 1/10) $2,928,000 [($1,100,000 X 1/10) X 6/12] 55,000 $2,983,000 *($30,000,000 – $420,000 – $300,000) (c) STARKEY COMPANY Partial Statement of Financial Position December 31, 2012 Plant Assets* Land .............................................................. $ 2,860,000 Buildings ..................................................... $20,000,000 Less: Accumulated depreciation— buildings ........................................ 8,400,000 11,600,000 Equipment................................................... 30,380,000 Less: Accumulated depreciation— equipment...................................... 6,545,000 23,835,000 Total...................................................... $38,295,000 *See T-accounts which follow. 9-46 Copyright © 2011 John Wiley & Sons, Inc. Weygandt, IFRS, 1/e, Solutions Manual (For Instructor Use Only)
  • 47. PROBLEM 9-5B (Continued) Land Bal. 2,000,000 Apr. 1 1,200,000 June 1 340,000 Bal. 2,860,000 Buildings Bal. 20,000,000 Bal. 20,000,000 Accumulated Depreciation—Buildings Bal. 8,000,000 Dec. 31 adj. 400,000 Bal. 8,400,000 Equipment Bal. 30,000,000 July 1 1,100,000 May 1 420,000 Dec. 31 300,000 Bal. 30,380,000 Accumulated Depreciation—Equipment May 1 182,000 Dec. 31 300,000 Bal. 4,000,000 May 1 14,000 Dec. 31 30,000 Dec. 31 adj. 2,983,000 Bal. 6,545,000 Copyright © 2011 John Wiley & Sons, Inc. Weygandt, IFRS, 1/e, Solutions Manual (For Instructor Use Only) 9-47
  • 48. PROBLEM 9-6B (a) Accumulated Depreciation—Delivery Equipment ......................................................................... 26,000 Loss on Disposal................................................................. 14,000 Delivery Equipment.................................................... 40,000 (b) Cash......................................................................................... 29,000 Accumulated Depreciation—Delivery Equipment ......................................................................... 26,000 Gain on Disposal ........................................................ 15,000 Delivery Equipment.................................................... 40,000 (c) Cash......................................................................................... 10,000 Accumulated Depreciation—Delivery Equipment ......................................................................... 26,000 Loss on Disposal................................................................. 4,000 Delivery Equipment.................................................... 40,000 9-48 Copyright © 2011 John Wiley & Sons, Inc. Weygandt, IFRS, 1/e, Solutions Manual (For Instructor Use Only)
  • 49. PROBLEM 9-7B (a) Jan. 2 Patents ............................................................ 45,000 Cash ........................................................ 45,000 Jan.– Research June Expense...................................................... 230,000 Cash ........................................................ 230,000 Sept. 1 Advertising Expense .................................. 125,000 Cash ........................................................ 125,000 Oct. 1 Copyright........................................................ 200,000 Cash ........................................................ 200,000 (b) Dec. 31 Amortization Expense—Patents............. 15,000 Patents ................................................... 15,000 [($100,000 X 1/10) + ($45,000 X 1/9)] 31 Amortization Expense—Copyright........ 7,000 Copyright............................................... 7,000 [($60,000 X 1/10) + ($200,000 X 1/50 X 3/12)] (c) Intangible Assets Patents ($145,000 cost – $25,000 amortization) (1) ................ $120,000 Copyright ($260,000 cost – $31,000 amortization) (2)............ 229,000 Total intangible assets ............................................................ $349,000 (1) Cost ($100,000 + $45,000); amortization ($10,000 + $15,000). (2) Cost ($60,000 + $200,000); amortization ($24,000 + $7,000). (d) The intangible assets of the company consist of two patents and two copyrights. One patent with a total cost of $145,000 is being amortized in two segments ($100,000 over 10 years and $45,000 over 9 years); the other patent was obtained at no recordable cost. A copyright with a cost of $60,000 is being amortized over 10 years; the other copyright with a cost of $200,000 is being amortized over 50 years. Copyright © 2011 John Wiley & Sons, Inc. Weygandt, IFRS, 1/e, Solutions Manual (For Instructor Use Only) 9-49
  • 50. PROBLEM 9-8B 1. Development Expense....................................................... 110,000 Patents ........................................................................... 110,000 Patents .................................................................................... 5,500 Amortization Expense—Patents [TL8,000 – (TL50,000 X 1/20)] ............................. 5,500 2. Goodwill.................................................................................. 2,000 Amortization Expense—Goodwill ......................... 2,000 Note: Goodwill should not be amortized because it has an indefinite life unlike Patents. 9-50 Copyright © 2011 John Wiley & Sons, Inc. Weygandt, IFRS, 1/e, Solutions Manual (For Instructor Use Only)
  • 51. PROBLEM 9-9B (a) McLead Corp. Gene Corp. Asset turnover ratio $1,100,000 $1,000,000 = 1.10 times $990,000 $1,050,000 = .94 times (b) Based on the asset turnover ratio, McLead Corp. is more effective in using assets to generate sales. Its asset turnover ratio is 17% higher than Gene’s asset turnover ratio. Copyright © 2011 John Wiley & Sons, Inc. Weygandt, IFRS, 1/e, Solutions Manual (For Instructor Use Only) 9-51
  • 52. CHAPTER 9 COMPREHENSIVE PROBLEM SOLUTION (a) 1. Equipment............................................................................... 16,800 Cash ................................................................................... 16,800 2. Depreciation Expense—Equipment................................ 450 Accumulated Depreciation—Equipment................ 450 Cash .......................................................................................... 3,500 Accumulated Depreciation—Equipment....................... 2,250 Equipment........................................................................ 5,000 Gain on Disposal [$3,500 – ($5,000 – $2,250)]...... 750 3. Accounts Receivable........................................................... 5,000 Sales................................................................................... 5,000 Cost of Goods Sold.............................................................. 3,500 Merchandise Inventory ................................................ 3,500 4. Bad Debts Expense ($4,000 – $500) ............................... 3,500 Allowance for Doubtful Accounts............................ 3,500 5. Interest Receivable ($10,000 X .08 X 9/12).................... 600 Interest Revenue............................................................ 600 6. Insurance Expense ($3,600 X 4/6) ................................... 2,400 Prepaid Insurance ......................................................... 2,400 7. Depreciation Expense—Building .................................... 4,000 Accumulated Depreciation—Building [($150,000 – $30,000) ÷ 30].......................................... 4,000 8. Depreciation Expense—Equipment................................ 9,900 Accumulated Depreciation—Equipment [($55,000 – $5,500) ÷ 5] ............................................. 9,900 9. Depreciation Expense—Equipment................................ 2,000 Accumulated Depreciation—Equipment [($16,800 – $1,800) ÷ 5] X 8/12................................ 2,000 9-52 Copyright © 2011 John Wiley & Sons, Inc. Weygandt, IFRS, 1/e, Solutions Manual (For Instructor Use Only)
  • 53. COMPREHENSIVE PROBLEM (Continued) 10. Amortization Expense—Patents ($9,000 ÷ 9)....... 1,000 Patent .......................................................................... 1,000 11. Salaries Expense............................................................ 2,200 Salaries Payable ...................................................... 2,200 12. Unearned Rent ($6,000 X 1/3) ..................................... 2,000 Rent Revenue ........................................................... 2,000 13. Interest Expense............................................................. 4,600 Interest Payable [($11,000 + $35,000) X .10] ................................ 4,600 14. Income Tax Expense..................................................... 15,000 Income Tax Payable ............................................... 15,000 Copyright © 2011 John Wiley & Sons, Inc. Weygandt, IFRS, 1/e, Solutions Manual (For Instructor Use Only) 9-53
  • 54. COMPREHENSIVE PROBLEM (Continued) (b) PINKERTON CORPORATION Trial Balance December 31, 2011 Debits Credits Cash............................................................................. Accounts Receivable ............................................. Notes Receivable..................................................... Interest Receivable................................................. Merchandise Inventory.......................................... Prepaid Insurance................................................... Land............................................................................. Building ...................................................................... Equipment ................................................................. Patent .......................................................................... Allowance for Doubtful Accounts ..................... Accumulated Depreciation—Building.............. Accumulated Depreciation—Equipment......... Accounts Payable ................................................... Salaries Payable ...................................................... Unearned Rent ......................................................... Notes Payable (short-term).................................. Interest Payable....................................................... Notes Payable (long-term).................................... Income Tax Payable ............................................... Share Capital—Ordinary....................................... Retained Earnings .................................................. Dividends................................................................... Sales............................................................................ Interest Revenue ..................................................... Rent Revenue ........................................................... Gain on Disposal..................................................... Bad Debts Expense ................................................ Cost of Goods Sold ................................................ Depreciation Expense—Building....................... Depreciation Expense—Equipment.................. Insurance Expense................................................. Interest Expense...................................................... Other Operating Expenses................................... Amortization Expense—Patents ........................ Salaries Expense..................................................... Income Tax Expense.............................................. Total.................................................................... $ 14,700 41,800 10,000 600 32,700 1,200 20,000 150,000 71,800 8,000 12,000 3,500 633,500 4,000 12,350 2,400 4,600 61,800 1,000 112,200 15,000 $1,213,150 $ 4,000 54,000 34,100 27,300 2,200 4,000 11,000 4,600 35,000 15,000 50,000 63,600 905,000 600 2,000 750 $1,213,150 9-54 Copyright © 2011 John Wiley & Sons, Inc. Weygandt, IFRS, 1/e, Solutions Manual (For Instructor Use Only)
  • 55. COMPREHENSIVE PROBLEM (Continued) (c) PINKERTON CORPORATION Income Statement For the Year Ended December 31, 2011 Sales.................................................................. Cost of goods sold ....................................... Gross profit..................................................... Operating expenses Salaries expense...................................... Other operating expenses .................... Depreciation expense—equipment...... Depreciation expense—building ........ Bad debts expense.................................. Insurance expense .................................. Amortization expense—patents.......... Total operating expenses........................... Income from operations ............................. Other income and expense Rent income............................................... Gain on disposal ...................................... Interest revenue........................................ Interest expense............................................ Income before income taxes..................... Income tax expense ..................................... Net income ...................................................... $112,200 61,800 12,350 4,000 3,500 2,400 1,000 2,000 750 600 $905,000 633,500 271,500 197,250 74,250 3,350 4,600 73,000 15,000 $ 58,000 PINKERTON CORPORATION Retained Earnings Statement For the Year Ending December 31, 2011 Retained earnings, 1/1/11................................................... Add: Net income ................................................................. Less: Dividends.................................................................... Retained earnings, 12/31/11 .............................................. $ 63,600 58,000 121,600 12,000 $109,600 Copyright © 2011 John Wiley & Sons, Inc. Weygandt, IFRS, 1/e, Solutions Manual (For Instructor Use Only) 9-55
  • 56. COMPREHENSIVE PROBLEM (Continued) (d) PINKERTON CORPORATION Statement of Financial Position December 31, 2011 Property, plant, and equipment Land...................................................................... Building ............................................................... Less: Accum. depr.—building .................... Equipment........................................................... Less: Accum. depr.—equipment ............... Intangible assets Patent ................................................................... Current assets Prepaid insurance............................................ Merchandise inventory................................... Interest receivable............................................ Notes receivable............................................... Accounts receivable........................................ Less: Allowance for doubtful accounts...... Cash...................................................................... Total assets............................................................... Equity Share capital—ordinary ................................. Retained earnings............................................ Non-current liabilities Notes payable (long-term)............................. Current liabilities Notes payable (short-term) ........................... Accounts payable............................................. Income tax payable.......................................... Interest payable ................................................ Unearned rent.................................................... Salaries payable................................................ Total equity and liabilities .................................... $150,000 54,000 71,800 34,100 41,800 4,000 $ 20,000 96,000 37,700 1,200 32,700 600 10,000 37,800 14,700 $ 50,000 109,600 11,000 27,300 15,000 4,600 4,000 2,200 $153,700 8,000 97,000 $258,700 $159,600 35,000 64,100 $258,700 9-56 Copyright © 2011 John Wiley & Sons, Inc. Weygandt, IFRS, 1/e, Solutions Manual (For Instructor Use Only)
  • 57. BYP 9-1 FINANCIAL REPORTING PROBLEM (a) Property, plant, and equipment is reported net, book value, on the December 27, 2008, statement of financial position at £1,761,000,000. The cost of the property, plant, and equipment is £3,330,000,000 as shown in Note 16. (b) Depreciation expense is calculated on a straight-line basis over an asset’s estimated useful live. (see Note 1, item q). (c) Depreciation expense was: 2008: £161,000,000. Amort: £35,000,000 in 2008 2007: £138,000,000. (d) Cadbury’s capital spending was: 2008: £500,000,000. 2007: £409,000,000. (e) Cadbury’s statement of financial position reports £2,288,000,000 for goodwill, £1,598,000,000 of acquisition intangibles, and £87,000,000 of software intangibles. In Note 15, the company indicates that acquisition intangibles consist of brands. Copyright © 2011 John Wiley & Sons, Inc. Weygandt, IFRS, 1/e, Solutions Manual (For Instructor Use Only) 9-57
  • 58. BYP 9-2 COMPARATIVE ANALYSIS PROBLEM (a) Cadbury Nestlé Asset turnover ratio £5,384 ÷ £11, 338 + £8, 895 2 = .53 times CHF109,908 ÷ CHF115, 361+ CHF106, 215 2 = .99 times (b) The asset turnover ratio measures how efficiently a company uses its assets to generate sales. It shows the dollars of sales generated by each dollar invested in assets. Nestlé’s asset turnover ratio (.99) was 87% higher than Cadbury’s (.53). Therefore, it can be concluded that Nestlé was more efficient during 2008 in utilizing assets to generate sales. 9-58 Copyright © 2011 John Wiley & Sons, Inc. Weygandt, IFRS, 1/e, Solutions Manual (For Instructor Use Only)
  • 59. BYP 9-3 EXPLORING THE WEB Answers will vary depending on the company selected. Copyright © 2011 John Wiley & Sons, Inc. Weygandt, IFRS, 1/e, Solutions Manual (For Instructor Use Only) 9-59
  • 60. BYP 9-4 DECISION MAKING ACROSS THE ORGANIZATION (a) Reimer Company—Straight-line method Annual Depreciation Building [($320,000 – $20,000) ÷ 40]...................................... $ 7,500 Equipment [($110,000 – $10,000) ÷ 10] ................................. 10,000 Total annual depreciation ......................................................... $17,500 Total accumulated depreciation ($17,500 X 3)............................ $52,500 Lingo Company—Double-declining-balance method Year Asset Computation Annual Depreciation Accumulated Depreciation 2009 2010 2011 Building Equipment Building Equipment Building Equipment $320,000 X 5% $110,000 X 20% $304,000 X 5% $ 88,000 X 20% $288,800 X 5% $ 70,400 X 20% $16,000 22,000 15,200 17,600 14,440 14,080 $38,000 32,800 28,520 $99,320 (b) Year Reimer Company Net Income Lingo Company Net Income As Adjusted Computations for Lingo Company 2009 2010 2011 $ 84,000 88,400 90,000 $ 88,500 91,300 96,020 $68,000 + $38,000 – $17,500 = $88,500 $76,000 + $32,800 – $17,500 = $91,300 $85,000 + $28,520 – $17,500 = $96,020 Total net income $262,400 $275,820 (c) As shown above, when the two companies use the same depreciation method, Lingo Company is more profitable than Reimer Company. When the two companies are using different depreciation methods, Lingo Company has more cash than Reimer Company for two reasons: 9-60 Copyright © 2011 John Wiley & Sons, Inc. Weygandt, IFRS, 1/e, Solutions Manual (For Instructor Use Only)
  • 61. BYP 9-4 (Continued) (1) its earnings are generating more cash than the earnings of Reimer Company, and (2) depreciation expense has no effect on cash. Cash generated by operations can be arrived at by adding depreciation expense to net income. If this is done, it can be seen that Lingo Company’s opera-tions generate more cash ($229,000 + $99,320 = $328,320) than Reimer Company’s ($262,400 + $52,500 = $314,900). Based on the above analysis, Mrs. Vogts should buy Lingo Company. It not only is in a better financial position than Reimer Company, but it is also more profitable. Copyright © 2011 John Wiley & Sons, Inc. Weygandt, IFRS, 1/e, Solutions Manual (For Instructor Use Only) 9-61
  • 62. BYP 9-5 COMMUNICATION ACTIVITY To: Instructor From: Student Re: American Exploration Company footnote American Exploration Company accounts for its oil and gas activities using the successful efforts approach. Under this method, only the costs of successful exploration are included in the cost of the extractable resource, and the costs of unsuccessful explorations are expensed. Depletion is determined using the units-of-activity method. Under this method, a depletion cost per unit is computed based on the total number of units expected to be extracted. Depletion expense for the year is determined by multiplying the units extracted and sold by the depletion cost per unit. 9-62 Copyright © 2011 John Wiley & Sons, Inc. Weygandt, IFRS, 1/e, Solutions Manual (For Instructor Use Only)
  • 63. BYP 9-6 ETHICS CASE (a) The stakeholders in this situation are: Dennis Harwood, president of Buster Container Company. Shelly McGlone, controller. The shareholders of Buster Container Company. Potential investors in Buster Container Company. (b) The intentional misstatement of the life of an asset or the amount of the residual value is unethical for whatever the reason. There is nothing per se unethical about changing the estimate either of the life of an asset or of an asset’s residual value if the change is an attempt to better match cost and revenues and is a better allocation of the asset’s depreciable cost over the asset’s useful life. In this case, it appears from the controller’s reaction that the revisions in the life are intended only to improve earnings and, therefore, are unethical. The fact that the competition uses a longer life on its equipment is not necessarily relevant. The competition’s maintenance and repair policies and activities may be different. The competition may use its equipment fewer hours a year (e.g., one shift rather than two shifts daily) than Buster Container Company. (c) Income before income taxes in the year of change is increased $140,000 by implementing the president’s proposed changes. Old Estimates Asset cost Estimated residual value Depreciable cost Depreciation per year (1/8) $3,100,000 300,000 2,800,000 $ 350,000 Revised Estimates Asset cost Estimated residual value Depreciable cost Depreciation taken to date ($350,000 X 2) Remaining life in years Depreciation per year $3,100,000 300,000 2,800,000 700,000 2,100,000 10 years $ 210,000 Copyright © 2011 John Wiley Sons, Inc. Weygandt, IFRS, 1/e, Solutions Manual (For Instructor Use Only) 9-63