More Related Content
Similar to dover 4Q_2005_Trend_Analysis
Similar to dover 4Q_2005_Trend_Analysis (20)
dover 4Q_2005_Trend_Analysis
- 1. DOVER CORPORATION
QUARTERLY MARKET SEGMENT INFORMATION (1)
(unaudited) (in thous ands )
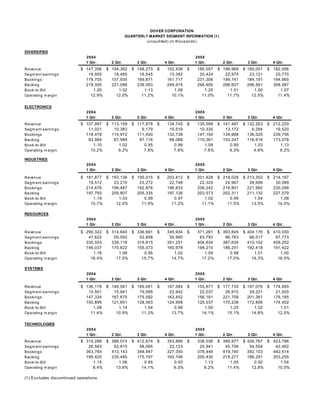
DIVERSIFIED
2004 2005
1 Qtr. 2 Qtr. 3 Qtr. 4 Qtr. 1 Qtr. 2 Qtr. 3 Qtr. 4 Qtr.
$ 147,356 $ 154,382 $ 148,273 $ 152,436 $ 185,057 $ 196,969 $ 185,051 $ 182,006
Revenue
18,955 18,485 16,545 15,392 20,424 22,975 23,121 20,770
Segm ent earnings
176,705 157,935 166,871 161,717 231,308 199,741 184,191 194,965
Bookings
218,355 221,098 239,083 249,915 294,605 296,607 296,561 308,587
Backlog
1.20 1.02 1.13 1.06 1.25 1.01 1.00 1.07
Book-to-Bill
12.9% 12.0% 11.2% 10.1% 11.0% 11.7% 12.5% 11.4%
Operating m argin
ELECTRONICS
2004 2005
1 Qtr. 2 Qtr. 3 Qtr. 4 Qtr. 1 Qtr. 2 Qtr. 3 Qtr. 4 Qtr.
$ 107,997 $ 113,159 $ 117,878 $ 134,745 $ 135,599 $ 141,487 $ 132,263 $ 212,220
Revenue
11,021 10,383 9,179 10,516 10,335 13,172 6,284 19,520
Segm ent earnings
118,478 114,972 111,400 132,738 147,154 134,968 136,025 239,756
Bookings
83,984 87,989 97,116 98,088 110,361 103,247 116,619 173,078
Backlog
1.10 1.02 0.95 0.99 1.09 0.95 1.03 1.13
Book-to-Bill
10.2% 9.2% 7.8% 7.8% 7.6% 9.3% 4.8% 9.2%
Operating m argin
INDUSTRIES
2004 2005
1 Qtr. 2 Qtr. 3 Qtr. 4 Qtr. 1 Qtr. 2 Qtr. 3 Qtr. 4 Qtr.
$ 181,877 $ 193,136 $ 195,015 $ 203,412 $ 201,828 $ 218,028 $ 213,302 $ 214,187
Revenue
19,512 23,210 23,272 22,748 22,325 24,967 28,699 30,089
Segm ent earnings
214,676 199,487 192,876 196,833 206,242 216,801 221,982 230,298
Bookings
197,793 205,807 205,335 197,126 203,573 202,311 211,132 227,079
Backlog
1.18 1.03 0.99 0.97 1.02 0.99 1.04 1.08
Book-to-Bill
10.7% 12.0% 11.9% 11.2% 11.1% 11.5% 13.5% 14.0%
Operating m argin
RESOURCES
2004 2005
1 Qtr. 2 Qtr. 3 Qtr. 4 Qtr. 1 Qtr. 2 Qtr. 3 Qtr. 4 Qtr.
$ 290,322 $ 314,640 $ 336,691 $ 345,934 $ 371,261 $ 393,845 $ 404,176 $ 410,030
Revenue
47,622 55,002 52,858 50,980 63,793 66,763 66,017 67,773
Segm ent earnings
335,553 339,118 319,815 351,251 404,634 387,635 410,102 409,252
Bookings
146,037 170,622 155,073 160,978 194,210 186,251 192,418 191,422
Backlog
1.16 1.08 0.95 1.02 1.09 0.98 1.01 1.00
Book-to-Bill
16.4% 17.5% 15.7% 14.7% 17.2% 17.0% 16.3% 16.5%
Operating m argin
SYSTEMS
2004 2005
1 Qtr. 2 Qtr. 3 Qtr. 4 Qtr. 1 Qtr. 2 Qtr. 3 Qtr. 4 Qtr.
$ 136,178 $ 146,581 $ 169,091 $ 167,584 $ 155,871 $ 177,735 $ 197,076 $ 174,695
Revenue
15,501 15,941 19,095 22,942 22,037 26,910 29,221 21,920
Segm ent earnings
147,334 167,675 175,592 163,452 156,181 221,709 201,361 176,185
Bookings
100,895 121,651 128,063 124,908 125,037 170,238 172,806 174,402
Backlog
1.08 1.14 1.04 0.98 1.00 1.25 1.02 1.01
Book-to-Bill
11.4% 10.9% 11.3% 13.7% 14.1% 15.1% 14.8% 12.5%
Operating m argin
TECHNOLOGIES
2004 2005
1 Qtr. 2 Qtr. 3 Qtr. 4 Qtr. 1 Qtr. 2 Qtr. 3 Qtr. 4 Qtr.
$ 315,288 $ 388,074 $ 412,674 $ 353,866 $ 336,036 $ 399,977 $ 426,767 $ 423,796
Revenue
26,583 52,815 58,065 22,123 20,941 45,706 54,554 42,462
Segm ent earnings
363,764 413,143 348,947 327,350 378,448 419,740 392,103 442,514
Bookings
195,420 235,485 175,797 165,746 205,430 218,277 186,291 203,255
Backlog
1.15 1.06 0.85 0.93 1.13 1.05 0.92 1.04
Book-to-Bill
8.4% 13.6% 14.1% 6.3% 6.2% 11.4% 12.8% 10.0%
Operating m argin
(1) Excludes discontinued operations.
- 2. DOVER CORPORATION
QUARTERLY EPS & EARNINGS
(Unaudited) (in thous ands )
2004 2005
1 Qtr. 2 Qtr. 3 Qtr. 4 Qtr. 1 Qtr. 2 Qtr. 3 Qtr. 4 Qtr.
Net earnings
$ 81,887 $ 103,750 $ 112,261 $ 96,296 $ 96,226 $ 121,005 $ 132,168 $ 125,054
Continuing operations
1,226 8,514 8,003 818 1,908 52,197 (9,488) (8,928)
Dis continued operations
83,113 112,264 120,264 97,114 98,134 173,202 122,680 116,126
Net earnings
Basic earnings per common share:
Continuing operations $ 0.40 $ 0.51 $ 0.55 $ 0.47 $ 0.47 $ 0.60 $ 0.65 $ 0.62
Discontinued operations 0.01 0.04 0.04 - 0.01 0.26 (0.05) (0.04)
Net earnings 0.41 0.55 0.59 0.48 0.48 0.85 0.61 0.57
Diluted earnings per common share:
Continuing operations $ 0.40 $ 0.51 $ 0.55 $ 0.47 $ 0.47 $ 0.59 $ 0.65 $ 0.61
Discontinued operations 0.01 0.04 0.04 - 0.01 0.26 (0.05) (0.04)
Net earnings 0.41 0.55 0.59 0.47 0.48 0.85 0.60 0.57
Average Shares
203,088 203,263 203,335 203,413 203,650 202,959 202,572 202,736
Bas ic Average Shares
204,763 204,787 204,714 204,875 204,904 203,984 203,918 204,050
Diluted Average Shares