Consolidation-Endgame Curve Framework

This Slideshare presentation is a partial preview of the full business document. To view and download the full document, please go here: http://flevy.com/browse/business-document/consolidation-endgame-curve-framework-201 The Consolidation Curve, or Endgame Curve, is a framework based on the theory that all industries consolidate and follow a similar course through the 4 stages of: Opening, Scale, Focus, and Balance & Alliance. This framework is based on a study of 25,000 firms globally, representing 98% of the global market cap, conducted by the strategy consulting firm AT Kearney. The Consolidation Curve shows that merger actions and consolidation trends can be predicted. Using the Consolidation Curve as guidance, a business can strengthen its consolidation strategies and facilitate merger integrations. A niche player can also determine the appropriate niche strategy to use and when is the best time to be acquired. Every major strategic and operational move should be evaluated with regard to the industry?s stage in the Consolidation Curve. Likewise, endgames positioning also offers a guide for portfolio optimization. This document explains the framework in detail and includes case examples and PowerPoint templates. Topics include: *Stages of Consolidation *Growth strategy implications *Stage impact on financials ( revenue growth, profitability) *Stage impact on strategy and operations *Stage impact on management/organization *Value-Building Growth Matrix *Niche strategies

Recommandé
Contenu connexe
Tendances
Tendances (20)
Similaire à Consolidation-Endgame Curve Framework
Similaire à Consolidation-Endgame Curve Framework (20)
Plus de Flevy.com Best Practices
Plus de Flevy.com Best Practices (20)
Dernier
Dernier (20)
Consolidation-Endgame Curve Framework
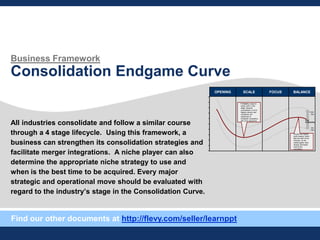
- 1. Business Framework Consolidation Endgame Curve All industries consolidate and follow a similar course through a 4 stage lifecycle. Using this framework, a business can strengthen its consolidation strategies and facilitate merger integrations. A niche player can also determine the appropriate niche strategy to use and when is the best time to be acquired. Every major strategic and operational move should be evaluated with regard to the industry’s stage in the Consolidation Curve. BALANCEFOCUSSCALEOPENING Avg. Profitability + Std. Dev. Std. – Dev. Profitability drops to lowest point in this stage, because consolidation is at its highest velocity and companies are responded to increased competition with price reductions We see the highest profit margins (other than the start of the industry), as the market giants have already eliminated most of the competition Find our other documents at http://flevy.com/seller/learnppt
- 2. 3 Contents • Overview - Stages of Consolidation - Growth Study Implications - Key Takeaways • Consolidation / Endgame Curve - Market Consolidation - Revenue Growth and Profitability - Strategy and Operations - Management and Organization • Acquisition Targets • Niche Strategies - Case Examples • US Airlines Case Example
- 3. 5 The Consolidation Curve has 4 stages—Opening, Scale, Focus, and finally, Balance & Alliance Overview – Stages of Consolidation In the final stage, industry titans dominate the landscape, controlling 70% of the market—any number of businesses can occupy the remaining 30%. Source: Winning the Merger Endgame, 2002 Stage IV BALANCE & ALLIANCE Stage III FOCUS Stage II SCALE Stage I OPENING DESCRIPTION COMBINED SHARE OF TOP 3 PLAYERS The industries operating in the Opening stage include newly deregulated industries, startups, and spin-off industries New industry catalysts can include new technology, new regulation, new ideas, and new consumer needs There is little to no market concentration at this point In the Scale stage, major players begin to emerge and size begins to matter—these players take the lead in consolidation Niche players begin to feel pressure Concentration rates can be as high as 45% in some industries In the Focus stage, successful players continue to aggressively outgrow competition These companies focus— meaning they extend their core business and eliminate secondary business units The supply and value chains begin to be streamlined In the final stage, consolidation rates reach 90%, so a few players dominate each industry at this point Large companies form alliances with each other, as growth is challenging at this stage Companies often look for new Opening-stage industries to expand into 41% 42% 50% 70%
- 4. 7 For a business to survive through the industry’s evolution, it must acquire or merge—it cannot solely rely on organic growth Growth Strategy Implications This is no optimal or maximum company size—to survive, company must just continuously grow Organic growth is not the route to successful growth—mergers are inevitable if a business wants to outgrow its competition There are few protectable niche markets—as all industries become global, niche players will be consolidated during the Focus and Balance & Alliance stages – There are successful niche strategies at various stages of the curve that companies can adopt (more on this in the Niche Strategies section) Each stage implies specific strategic and operational imperatives Learning how to successfully integrate an acquisition or merger partner is quickly becoming a core competence of successful endgame players (i.e. a top 3 company) Companies should strive to optimize their aggregate portfolio of subsidiaries and business units across the different stages A merger or acquisition should advance the resulting entity along the curve Aside: very few mergers between major technology companies have resulted in increased shareholder value and improved customer relationships
- 5. 9 Contents • Overview - Stages of Consolidation - Growth Study Implications - Key Takeaways • Consolidation / Endgame Curve - Market Consolidation - Revenue Growth and Profitability - Strategy and Operations - Management and Organization • Acquisition Targets • Niche Strategies - Case Examples • US Airlines Case Example
- 6. 11 Revenue growth remains relatively stable through the Consolidation Curve Revenue Growth Revenue growth is highest at the onset, as companies make territorial claims—in Scale, revenues drop slightly due to consolidation, but stabilize again in the final two stages. Source: Winning the Merger Endgame, 2002 Stage I OPENING Stage II SCALE Stage III FOCUS Stage IV BALANCE & ALLIANCE 30% 0% Revenue Growth 20% 10% Avg 10.5% Avg 7.6% Avg 8.8% Avg 8.1% Growth rate spread
- 7. 13 The operational focus and challenges change significantly from stage to stage Strategy and Operations While technology can significantly streamline operations and reduce costs, poor post- merger technology/system integration can become a company’s bane. Stage I OPENING Stage II SCALE Stage III FOCUS Stage IV BALANCE & ALLIANCE Product quality and production is still in infancy Systems and formal planning are minimal to nonexistent At this point, the company’s strategy is simply to survive The business is trying to generate enough cash to cover the demands Companies shift the focus from product development to financial ones (e.g. optimizing capital structure, financing growth) Product quality and production have been refined to confirm with industry standards and defined customer expectations Systems and processes are improved, but still lack the capability of handling significant growth—this issue is exacerbated as companies merge and need to also merge processes and IT systems Goal is now to maximize operational efficiency Detailed operational and strategic planning is streamlined through the course of this stage Cost reduction and management initiatives are pursued to manage profitability and remain competitive Systems are now fully built out to accommodate existing operations and projected future growth There is a looming, continued risk of commoditization from competitors For a successful top 3 player, continued innovation is key Companies build out budgets, strategic planning, management best practices, and cost systems (as needed) KEY STRATEGIC AND OPERATIONAL TRAITS
- 8. 15 Consolidation / Endgame Curve – Template Bumper. Stage I OPENING Stage II SCALE Stage III FOCUS Stage IV BALANCE & ALLIANCE 100% 0% Combined Share of Top 3 Players Time
- 9. 17 The Value-Building Growth Matrix is a great tool for identifying and evaluating potential acquisition targets Value-Building Growth Matrix Source: The Value Growers, 2000 RevenueGrowth Value Growth HighLow Low High Profit SeekersUnderperformers Value GrowersSimple Growers The Value-Building Growth (VBG) Matrix is a useful tool for identifying good acquisition targets. Your vertical axis represents revenue growth, where input data can be collected from annual reports and SEC filings. Your horizontal axis represents value growth, where input data can be collected from historical share price. For both axes, the mid point represents the industry average for that metric. Plot the potential targets in the matrix. Be sure to also take into consideration the position of your own business. The objective in any acquisition or merger is for the resulting entity to move closer to the top-right corner of the VBG matrix. The objective of any acquisition is to move closer to the top-right corner of the Value- Building Growth Matrix.
- 10. 19 Each quadrant of the VBG Matrix presents different key challenges Value-Building Growth Matrix – Key Challenges Source: The Value Growers, 2000 Profit SeekersUnderperformers Value GrowersSimple Growers CHALLENGES FOR UNDERPERFORMERS • How to restructure and align both strategy and operations? CHALLENGES FOR SIMPLE GROWERS • How to increase value creation? • How to increase focus on core activities and competences? CHALLENGES FOR PROFIT SEEKERS • How to break out of the profit trap? • How to capitalize on profit gains already realized? CHALLENGES FOR VALUE GROWERS • How to maintain stamina in ―value-building‖ growth? • How to prepare for next growth step? In assessing an acquisition target, it is important to understand the key challenges in relation to the management team’s ability to combat these challenges.
- 11. 21 Value-Building Growth Matrix – Template RevenueGrowth Value Growth HighLow Low High Profit SeekersUnderperformers Value GrowersSimple Growers X% Y%
- 12. 23 Nine proven niche strategies have been identified (after analyzing 600,000+ private companies) Niche Strategies Regional • These companies have a solid understanding of customers in a clearly defined regional market • Example: Local/regional breweries (e.g. Jever Pilsner) NICHE STRATEGY DETAILS Target Group • These companies target certain customer segments and provide extensive personalized services • Example: luxury hotel chains (e.g. Four Seasons, Ritz Carlton) Product • These companies excel at providing a specific product • Example: CNN Branding and Lifestyle • These companies combine the strategies of Target Group and Product to create communities of loyal customers who value the brand name • Example: luxury companies (e.g. Porsche, Mont-Blanc) Speed and Lightning- Consolidation • These companies grow very rapidly and cut out the market leaders (referred to as ―rabbits‖) • Example: Internet startups (e.g. Facebook, Amazon) Innovation • These companies are able to constantly out innovate other companies to maintain their market position • Example: Apple, Logitech Cooperation • These are smaller companies that form alliances to compete against larger companies • Example: airline alliances (e.g. Star Alliance), Ace Hardware Market Splitting • These companies identify weaknesses in the value chain and play in those areas • Example: IBM, when it split the market by dividing its offerings for distinct markets Counter • These ―counter-niche‖ companies exploit the weaknesses or strengths of the industry leader • Example: NetJets, Dell Source: Beating the Global Consolidation Endgame, 2008
- 13. 25 Rolls-Royce adopted the Product/Target Group strategy, launching a luxury car at the end of the Opening stage Niche Player Case Study – Rolls-Royce Rolls-Royce adopted the correct niche strategy, but sold itself 40 years too late—for a company following a niche strategy, cash-out value is a key performance indicator. NICHE STRATEGY Product/Target Group Rolls-Royce is a car manufacturer founded in 1906 by Charles Stewart Rolls and Frederick Henry Royce It adopted a Product/Target Group niche strategy, where it produced cars exclusively for the highest luxury class DETAILS • When Rolls-Royce entered the automotive industry, the market was already widespread—in fact, the industry was just coming out of its Opening stage • The strategy of both Product (cars) and Target Group (the wealthy) was an effective strategy • For many decades, the Rolls-Royce was the vehicle of choice for the target customer group—not only for royalty and popes, but also dictators and leaders of the underworld • However, after WWII, many of society’s wealthy class was hit hard financially, and as a result, so was Rolls-Royce • Despite the reduction of its target market, Rolls-Royce stayed with its niche strategy and ultimately went bankrupt in 1971 • In 1972, the company was nationalized • In 2003, the brand was acquired by BMW • BMW is a master of the product/target-group strategy and positioned the Rolls-Royce brand for the wealthy • All of the interior engineering of the vehicles were replaced with BMW technology
- 14. 27 For a niche player, there is a time to fight and a time to sell Niche Strategy Conclusions Adopting the correct niche strategy is critical—90% of companies existent today will not be around in 25 years. If you are a niche player, be sure to adopt the appropriate strategy for the current stage of your industry’s development For every niche company, there is to a time to fight and there is time to sell—selling at the wrong time can cost a lot of money If a niche company doesn’t sell, it must evolve its niche strategy For every global consolidator, there are thousands of acquisition opportunities For a company following a niche strategy, cash-out value should be a key performance indicator
- 15. 29 The US Airline Industry was deregulated in 1978—since then, we’ve seen a rapid growth in new entrants, followed by consolidation Consolidation / Endgame Curve – US Airline Industry The airline industry has already been globalizing through global alliance partnerships—e.g. Star Alliance, SkyTeam, and Oneworld. Stage I OPENING Stage II SCALE Stage III FOCUS Stage IV BALANCE & ALLIANCE 100% 0% Combined Share of Top 3 Players Time1978 American 13.8% United 21.6% Delta 12.3% Northwest 2.7% Continental 4.6% 1991 American 19.1% United 17.0% Delta 17.0% Northwest 9.2% Continental 9.1% Southwest 3.4% New airlines rapidly—by 1983, there are 196 carriers 1993 2010 By 1993, 130 carriers remain— airlines focus on innovation and cost reduction programs (e.g. employee ownership, ticketless travel, loyalty programs, corporate discounts/contracts) American 19.7% United 17.8% Delta 17.3% Northwest 9.4% Continental 8.7% Southwest 4.7% United + 18.0% Continental Delta + 16.7% Northwest American 13.8% Southwest 4.7% By 2010, we see 2 big mergers—Delta merges with Northwest (2008), United merges with Continental (2010) Source: Kellogg School of Management US airline industry is deregulated in 1978