SlideShare une entreprise Scribd logo
1  sur  16
Scenario

Present Value

Contract is renewed
A) With liabilities

$962,622

B) Without liabilities

$1,197,234

Contract is NOT renewed
A) With liabilities

$239,249

B) Without liabilities

$480,305

Market Value
Free Cash Flow Valuation -- Professional Services Firm
(Modifying variables in red will dynamically update the MV of the company)
Forecasting Variables:

2013

2014

2015

2016

2017

2018

2019

2020

2021

Revenue growth factor

35%

35%

35%

30%

30%

30%

20%

20%

20%

Expected gross profit margin

18%

19%

20%

20%

21%

22%

22%

23%

24%

S, G, & A expense % of revenue

20%

21%

21%

22%

23%

24%

25%

25%

26%

Depr. & Amort. % of revenue

4%

4%

4%

4%

5%

5%

5%

5%

5%

2013

2014

2015

2016

2017

2018

2019

2020

2021

($16,989)

($838)

Income tax rate
Assumed long-term sustainable growth rate
Discount rate

35%
4.72% per year after 2022
11.22%

Valuation Model Outputs:

Free cash flow
Terminal value
PV of Company Operations ($ mil)
Add: Total Assets
Less: Total Liabilities
Market Value of Company Assets ($ mil)

$848

$25,961

$4,963

$29,035

$37,745

($20,131)

$54,353

$1,077,589
$126,089.0
$241,056.0
$962,622

Note 1: Long Term Growth Rate
The long term GDP growth rate from 1947-2010 was 3.23%. Using the industry Beta of 1.46 as a proxy for sustainable growth rate above the average growth rate of the
economy, the long term growth rate assumption is 4.72%. Note that infinite growth above trend GDP is only reasonable because higher betas imply
greater risk of insolvency. If the company survives, a long term growth rate above average GDP is reasonable.
Data obtained from:
http://www.tradingeconomics.com/united-states/gdp-growth
Note 2: Total Liabilities
I used total liabilities because they represent the obligations of the company, unless discharged in the merger. If you want to use long term liabilities, use $131,096 in cell C22
2022
20%
25%
26%
5%

2022
$65,224
$2,943,431
The Discounted Free Cash Flow Model for A Professional Services Firm

Actual
2012
Total revenue

Cost of Goods Sold

Years Ending December 31
|------------------------------------------------------------------------------------------ Forecast ----------------------------------------------------------------------------------------|
2013
2014
2015
2016
2017
2018
2019
2020
2021
2022

$1,551,738

$2,094,846

$2,828,043

$3,817,857

$4,963,215

$6,452,179

$8,387,833

$10,065,399

$12,078,479

$14,494,175

$17,393,010

1,270,527

1,717,774

2,290,714

3,054,286

3,970,572

5,097,221

6,542,509

7,851,011

9,300,429

11,015,573

13,044,757

Gross profit

281,211

377,072

537,328

763,571

992,643

1,354,958

1,845,323

2,214,388

2,778,050

3,478,602

4,348,252

Selling, general and administrative expenses

312,474

418,969

593,889

801,750

1,091,907

1,484,001

2,013,080

2,516,350

3,019,620

3,768,485

4,522,183

Earnings before interest, taxes, depr. & amort. (EBITDA)

(31,263)

(41,897)

(56,561)

(38,179)

(99,264)

(129,044)

(167,757)

(301,962)

(241,570)

(289,883)

9,520

75,414

107,466

145,079

198,529

322,609

419,392

503,270

603,924

724,709

Earnings before Interest and taxes (EBIT)
Net taxable earnings

(40,783)
(40,783)

(117,311)
(117,311)

(164,026)
(164,026)

(183,257)
(183,257)

(297,793)
(297,793)

(451,653)
(451,653)

(587,148)
(587,148)

(805,232)
(805,232)

(845,494)
(845,494)

(1,014,592)
(1,014,592)

(1,043,581)
(1,043,581)

Federal and State Income Taxes

(14,274)

(41,059)

(57,409)

(64,140)

(104,228)

(158,078)

(205,502)

(281,831)

(295,923)

(355,107)

(365,253)

Net Operating Profit After-Tax (NOPAT)

(26,509)

(76,252)

(106,617)

(119,117)

(193,565)

(293,574)

(381,646)

(523,401)

(549,571)

(659,485)

(678,327)

9,520

75,414

Depreciation and amortization

Add back depreciation and amortization
Free Cash Flow

869,650

107,466

145,079

198,529

322,609

419,392

503,270

603,924

724,709

869,650

($838)

$848

$25,961

$4,963

$29,035

$37,745

($20,131)

$54,353

$65,224

$191,323
$2,943,431
$913,781

(753)

($16,989)

686

18,870

3,244

17,061

19,942

(9,563)

23,215

25,047

66,060

Terminal Value, 2023
Terminal Value, 2013

Present Value of Free Cash Flows @ 11.22%
Total Present Value of Company Operations
$1,077,589
Plus Current Assets $ 119,645
Total Market Value of Great Expectations' Assets

(173,930)

$1,197,234
Free Cash Flow Valuation -- Professional Services Firm
(Modifying variables in red will dynamically update the MV of the company)
Forecasting Variables:

2013

2014

2015

2016

2017

2018

2019

2020

2021

Revenue growth factor

35%

35%

35%

30%

30%

30%

20%

20%

20%

Expected gross profit margin

18%

19%

20%

20%

21%

22%

22%

23%

24%

S, G, & A expense % of revenue

20%

21%

21%

22%

23%

24%

25%

25%

26%

Depr. & Amort. % of revenue

4%

4%

4%

4%

5%

5%

5%

5%

5%

2014

2015

2016

2017

2018

2019

2020

2021

Income tax rate
Assumed long-term sustainable growth rate
Discount rate

35%
4.72% per year after 2022
11.22%

2013
Valuation Model Outputs:

Free cash flow
Terminal value
PV of Company Operations ($ mil)
Add: Total Assets
Less: Total Liabilities
Market Value of Company Assets ($ mil)

($275)

$279

$8,534

$1,631

$9,544

$12,407

($6,617)

$17,867

$21,440

$354,216
$126,089.0
$241,056.0
$239,249

Note 1: Long Term Growth Rate
The long term GDP growth rate from 1947-2010 was 3.23%. Using the industry Beta of 1.46 as a proxy for sustainable growth rate above the average growth rate of the
economy, the long term growth rate assumption is 4.72%. Note that infinite growth above trend GDP is only reasonable because higher betas imply
greater risk of insolvency. If the company survives, a long term growth rate above average GDP is reasonable.
Data obtained from:
http://www.tradingeconomics.com/united-states/gdp-growth
Note 2: Total Liabilities
I used total liabilities because they represent the obligations of the company, unless discharged in the merger. If you want to use long term liabilities, use $131,096 in cell C22
2022
20%
25%
26%
5%

2022
$62,890
$967,538
The Discounted Free Cash Flow Model for Professional Services Firm

Actual
2012
Total revenue

$510,076

Cost of Goods Sold

1,270,527

Gross profit

Selling, general and administrative expenses
Earnings before interest, taxes, depr. & amort. (EBITDA)

Depreciation and amortization
Earnings before Interest and taxes (EBIT)
Net taxable earnings

Years Ending December 31
|------------------------------------------------------------------------------------------ Forecast ----------------------------------------------------------------------------------------|
2013
2014
2015
2016
2017
2018
2019
2020
2021
$688,603

$929,614

$1,254,978

$1,631,472

$2,120,913

$2,757,187

$3,308,625

$3,970,350

$4,764,419

564,654

752,987

1,003,983

1,305,177

1,675,521

2,150,606

2,580,727

3,057,169

3,620,959

(760,451)

123,948

176,627

250,996

326,294

445,392

606,581

727,897

913,180

1,143,461

312,474

137,721

195,219

263,545

358,924

487,810

661,725

827,156

992,587

1,238,749

(13,772)

(18,592)

(12,550)

(32,629)

(42,418)

(55,144)

(99,259)

(79,407)

(1,072,925)

9,520
(1,082,445)
(1,082,445)

(95,288)

24,790

35,325

47,689

65,259

106,046

137,859

165,431

198,517

238,221

(38,562)
(38,562)

(53,918)
(53,918)

(60,239)
(60,239)

(97,888)
(97,888)

(148,464)
(148,464)

(193,003)
(193,003)

(264,690)
(264,690)

(277,924)
(277,924)

(333,509)
(333,509)

Federal and State Income Taxes

(378,856)

(13,497)

(18,871)

(21,084)

(34,261)

(51,962)

(67,551)

(92,641)

(97,274)

(116,728)

Net Operating Profit After-Tax (NOPAT)

(703,590)

(25,065)

(35,046)

(39,155)

(63,627)

(96,502)

(125,452)

(172,048)

(180,651)

(216,781)

24,790

Add back depreciation and amortization
Free Cash Flow

9,520

35,325

47,689

65,259

106,046

137,859

165,431

198,517

238,221

($275)

$279

$8,534

$1,631

$9,544

$12,407

($6,617)

$17,867

$21,440

(248)

($694,069)

225

6,203

1,066

5,608

6,555

(3,143)

7,631

8,233

Terminal Value, 2023
Terminal Value, 2013

Present Value of Free Cash Flows @ 11.22%
Total Present Value of Company Operations
$354,216
Plus Total Assets $ 126,089
Total Market Value of Great Expectations' Assets

$480,305
----------------------------------------------------|
2022
$5,717,303

4,287,978
1,429,326

1,486,499
(57,173)

285,865
(343,038)
(343,038)

(120,063)
(222,975)

285,865
$62,890
$967,538
$300,370

21,715
Professional Services Firm Discount Rate Determination
100 Year Average US 10-year Treasury Yield:
Average Equity Risk Premium
Industry Beta
Expected Return from CAPM
Discount Rate ( r )

4.90%
4.33%
1.46
11.22%
11.22%

Note 1: 100 Year Average Treasury Yield
100 year average 10-year US treasury rate of 4.90% was obtained from:
http://observationsandnotes.blogspot.com/2010/11/100-years-of-bond-interest-rate-history.html
Note 2: Average Equity Risk Premium
The annual compounded return on the US equity composite index for the 1928-2011 time period was 9.23%.
The annual compounded return from US Treasury rates was 4.90% for the same period. The difference (4.33%) is the equity risk premium for the composite stock market.
The annual compounded return data was obtained from:
http://aswathdamodaran.blogspot.com/2012/03/equity-risk-premiums-2012-edition.html
Note 3: Industry Beta
The industry I used to compare R.A.D. is the "Human Resources" sector.
Summary Statistics

Industry Name
Human Resources

# Firms
25

Unlevere
Avg. Beta D/E Ratio Tax Rate d Beta
1.38

10.80%

26.61%

1.28

Cash/Firm
Value

Unlevered Beta
corrected for
cash

12.49%

1.46

I chose the unlevered Beta corrected for cash due to R.A.D.'s low cash position. The average Beta (1.38) is very close, and either number would work.
Data obtained from:
http://pages.stern.nyu.edu/~adamodar/New_Home_Page/datafile/Betas.html
Note 4: Discount Rate Derived from CAPM
The Capital Asset Pricing Model (CAPM):
Expected Return ( r ) = Risk free rate + Beta(Equity Risk Premium)
r = 4.9 + 1.46(4.33)
r = 11.22%
Fixed assets:
Computer Equipment
Accumulated Depreciation (Computer Equipment)
Computer Software
Accumulated Depreciation (Software)
Furniture and Fixtures
Accumulated Depreciation (FF&E)
Motor Vehicles
Accumulated Depreciation (Motor Vehicles)
Total fixed assets

2012
8,860.00
(7,990.00)
1,686.00
(1,685.00)
12,556.00
(12,360.00)
33,359.00
(27,982.00)
6,444.00

Depreciable Basis
$8,860.00

Yearly Depreciation Expense
$1,772.00

$1,686.00
$12,556.00

$2,511.20

$33,360.00
Sum:

$337.20

$6,672.00

$56,462.00 Sum:

$9,520.40

Note 1:
Yearly depreciation and amortization expense calculated by assuming a 5 year useful life and straight line depreciation
Note 2:
Depreciation and amortization expense is added back to EBITDA to determine FCFF
Note 3:
The depreciable basis is calculated as the book value (cost) of the asset less the balance in the associated accumulated depreciation account
Note 4:
New investment in PP&E will use the same 5 year useful life and straight line depreciation method to add to EBITDA to come up with FCFF
Professional Services Firm
Revenue
Gross sales

Less sales returns and allowances
Net sales
Cost of Sales
Salaries
Payroll Taxes
Commissions
Health Insurance
Reference Checks
Total COGS
Gross profit (loss)
Operating Expenses

Income Statement
Year to Date
Amount
$1,558,779
(7,041)
1,551,738
Amount
$1,095,795
$127,206
$17,157
$30,009
$360
$1,270,527
$281,211

% of Sales

100%
Year to Date
% of Sales
71%
8%
1%
2%
0%
82%
18%
Year to Date

Amount

% of Sales

$2,049
$1,976
$645
$5,051
$68
$580
$1,397
$10
$595
$271
$45,583
$2,086
$3,598
$13,058
$35
$9,196
$12,489
$1,846
$2,165
$4,227
$34,555
$163,249
$500
$759
$4,032
$2,454
312,474
($31,263)

0%
0%
0%
0%
0%
0%
0%
0%
0%
0%
3%
0%
0%
1%
0%
1%
1%
0%
0%
0%
2%
11%
0%
0%
0%
0%
20%

Selling, General and Administrative (SG&A)

Advertising
Auto Expense
Bad Debt Expense
Bank Service Charges
Client Lunch
Computer Expense
Dues and Subscriptions
Employee Relations
Entertainment
Gifts
Insurance
Legal and Accounting
Office Expenses
Outside Services
Parking
Payroll Expenses
Payroll Taxes
Postage and Delivery
Printing and Reproduction
Profit Sharing
Rent
Salaries and wages
Suspense
Taxes -- Other
Telephone
Utilities
Total SG&A
Net income before taxes
Taxes on income
Net income after taxes
Extraordinary gain or loss
Income tax on extraordinary gain
Net Income (Loss)

$0
($31,263)
$0
$0
($31,263)
Professional Services Firm

Balance Sheet

Assets
Current assets:
Cash
Accounts Receivable
Allowance for Bad Debts
Officer's Loan Receivable
Deposits
Total current assets

2012
9,950.00
112,151.00
(10,000.00)
4,132.00
3,412.00
119,645.00

Fixed assets:
Computer Equipment
Accumulated Depreciation (Computer Equipment)
Computer Software
Accumulated Depreciation (Software)
Furniture and Fixtures
Accumulated Depreciation (FF&E)
Motor Vehicles
Accumulated Depreciation (Motor Vehicles)
Total fixed assets

2012
8,860.00
(7,990.00)
1,686.00
(1,685.00)
12,556.00
(12,360.00)
33,359.00
(27,982.00)
6,444.00

Total assets

126,089.00

Liabilities and owner's equity
Current liabilities:
Credit Cards
Cash Overdraft
401K Contributions Payable
Federal W/H and FICA Payable
MA W/H Payable
FUTA Payable
SUI & MA Health Payable
Child Support Payable
Total current liabilities

2012
24,236.00
3,500.00
(200.00)
65,293.00
530.00
200.00
16,215.00
186.00
109,960.00

Long-term liabilities:
Accrued State Income Taxes
Deferred Income Taxes
Reserve Credit -- Fleet
Fleet -- Loan Payable
Sovereign Credit Line
Total long-term liabilities

2012

Owner's equity:

2012

456.00
5,858.00
13,922.00
36,097.00
74,763.00
131,096.00
Common Stock
Retained Earnings
Net Income
Total owner's equity

Total liabilities and owner's equity

3,175.00
(53,404.00)
(64,738.00)
(114,967.00)

126,089.00
Line Item Growth Factors and Assumptions

Revenue Growth Factor:
Comparable competitor, On Assignment (ASGN), five year TTM revenues:
12 months 12 months 12 months
ending 2011- ending 2010- ending 200912-31
12-31
12-31
Revenues
($MM)

597.28

438.06

416.61

Average
Annual
Compound
Growth Rate

20%

Gross Profit Growth Factor:
Current growth profit percentage is 18%, assume will gradually increase to ASGN's gross profit percentage to 25% (ASGN at 34% for reference)
25%
Selling, General and Administrative as a Percent of Revenues Growth Factor:
Current SG&A expense as a percent of revenues is 20%
Assume gradually increase to ASGN's SG&A percent of revenues of 25% (ASGN at 26% for reference)
26%
Depreciation and Amortization as a Percent of Revenues Growth Factor
Current SG&A expense as a percent of revenues is 3.6%
Assume gradually increase to ASGN's SG&A expense percent of revenus of 5%
5%

Contenu connexe

En vedette

Relative Valuation: Business Valuation Article
Relative Valuation: Business Valuation ArticleRelative Valuation: Business Valuation Article
Relative Valuation: Business Valuation ArticleCorporate Professionals
 
Risk engineering management ppt for agsb oct 19, 2011
Risk engineering   management ppt for agsb oct 19, 2011Risk engineering   management ppt for agsb oct 19, 2011
Risk engineering management ppt for agsb oct 19, 2011Mr A
 
Frustration of Contracts and Force Majeure clauses
Frustration of Contracts and Force Majeure clausesFrustration of Contracts and Force Majeure clauses
Frustration of Contracts and Force Majeure clausesEversheds Sutherland
 
Offshore Production Platform Risk Management & Safety Services
Offshore Production Platform Risk Management & Safety ServicesOffshore Production Platform Risk Management & Safety Services
Offshore Production Platform Risk Management & Safety ServicesSantiago Alexis Rodriguez
 
Early Stage Startup Valuation
Early Stage Startup ValuationEarly Stage Startup Valuation
Early Stage Startup Valuationstartany
 
Valuation for Start-ups
Valuation for Start-ups Valuation for Start-ups
Valuation for Start-ups Kesava Reddy
 
FInancial Modeling and Valuations for Startups: Telling your Story with Numbers
FInancial Modeling and Valuations for Startups: Telling your Story with NumbersFInancial Modeling and Valuations for Startups: Telling your Story with Numbers
FInancial Modeling and Valuations for Startups: Telling your Story with NumbersForesight Valuation Group
 
Safety Management System framework
Safety Management System  frameworkSafety Management System  framework
Safety Management System frameworkS P Singh
 
Corporate valuation
Corporate valuationCorporate valuation
Corporate valuationsavi_raina
 
Investor readiness: 99 questions from investors by Startups.be
Investor readiness: 99 questions from investors by Startups.beInvestor readiness: 99 questions from investors by Startups.be
Investor readiness: 99 questions from investors by Startups.beStartUps.be
 
Investor readiness: Startup valuation by Startups.be
Investor readiness: Startup valuation by Startups.beInvestor readiness: Startup valuation by Startups.be
Investor readiness: Startup valuation by Startups.beStartUps.be
 
PPT on merger & acuqisitions
PPT on merger & acuqisitionsPPT on merger & acuqisitions
PPT on merger & acuqisitionsITC Limited
 
Merger and acquisition ppt
Merger and acquisition pptMerger and acquisition ppt
Merger and acquisition pptSwati Garg
 
Risk Management and Insurance
Risk Management and InsuranceRisk Management and Insurance
Risk Management and InsuranceJohn Daniel
 
Merger & acquisition with case study
Merger & acquisition with case studyMerger & acquisition with case study
Merger & acquisition with case studyPraful Metange
 

En vedette (17)

Relative Valuation: Business Valuation Article
Relative Valuation: Business Valuation ArticleRelative Valuation: Business Valuation Article
Relative Valuation: Business Valuation Article
 
Risk engineering management ppt for agsb oct 19, 2011
Risk engineering   management ppt for agsb oct 19, 2011Risk engineering   management ppt for agsb oct 19, 2011
Risk engineering management ppt for agsb oct 19, 2011
 
Frustration of Contracts and Force Majeure clauses
Frustration of Contracts and Force Majeure clausesFrustration of Contracts and Force Majeure clauses
Frustration of Contracts and Force Majeure clauses
 
Offshore Production Platform Risk Management & Safety Services
Offshore Production Platform Risk Management & Safety ServicesOffshore Production Platform Risk Management & Safety Services
Offshore Production Platform Risk Management & Safety Services
 
Early Stage Startup Valuation
Early Stage Startup ValuationEarly Stage Startup Valuation
Early Stage Startup Valuation
 
Valuation for Start-ups
Valuation for Start-ups Valuation for Start-ups
Valuation for Start-ups
 
FInancial Modeling and Valuations for Startups: Telling your Story with Numbers
FInancial Modeling and Valuations for Startups: Telling your Story with NumbersFInancial Modeling and Valuations for Startups: Telling your Story with Numbers
FInancial Modeling and Valuations for Startups: Telling your Story with Numbers
 
Safety Management System framework
Safety Management System  frameworkSafety Management System  framework
Safety Management System framework
 
Corporate valuation
Corporate valuationCorporate valuation
Corporate valuation
 
Investor readiness: 99 questions from investors by Startups.be
Investor readiness: 99 questions from investors by Startups.beInvestor readiness: 99 questions from investors by Startups.be
Investor readiness: 99 questions from investors by Startups.be
 
Valuation
ValuationValuation
Valuation
 
Investor readiness: Startup valuation by Startups.be
Investor readiness: Startup valuation by Startups.beInvestor readiness: Startup valuation by Startups.be
Investor readiness: Startup valuation by Startups.be
 
Valuation
ValuationValuation
Valuation
 
PPT on merger & acuqisitions
PPT on merger & acuqisitionsPPT on merger & acuqisitions
PPT on merger & acuqisitions
 
Merger and acquisition ppt
Merger and acquisition pptMerger and acquisition ppt
Merger and acquisition ppt
 
Risk Management and Insurance
Risk Management and InsuranceRisk Management and Insurance
Risk Management and Insurance
 
Merger & acquisition with case study
Merger & acquisition with case studyMerger & acquisition with case study
Merger & acquisition with case study
 

Plus de Flevy.com Best Practices

100 Case Studies on Strategy & Transformation.pdf
100 Case Studies on Strategy & Transformation.pdf100 Case Studies on Strategy & Transformation.pdf
100 Case Studies on Strategy & Transformation.pdfFlevy.com Best Practices
 
[Whitepaper] Business Transformation Success Factors
[Whitepaper] Business Transformation Success Factors[Whitepaper] Business Transformation Success Factors
[Whitepaper] Business Transformation Success FactorsFlevy.com Best Practices
 
[Whitepaper] 5 Dimensions of Employee Engagement Scorecard
[Whitepaper] 5 Dimensions of Employee Engagement Scorecard[Whitepaper] 5 Dimensions of Employee Engagement Scorecard
[Whitepaper] 5 Dimensions of Employee Engagement ScorecardFlevy.com Best Practices
 
[Whitepaper] Digital Transformation: Workforce Digitization
[Whitepaper] Digital Transformation: Workforce Digitization[Whitepaper] Digital Transformation: Workforce Digitization
[Whitepaper] Digital Transformation: Workforce DigitizationFlevy.com Best Practices
 
[Whitepaper] Strategic Human Resources: Evolution of Competition
[Whitepaper] Strategic Human Resources: Evolution of Competition[Whitepaper] Strategic Human Resources: Evolution of Competition
[Whitepaper] Strategic Human Resources: Evolution of CompetitionFlevy.com Best Practices
 
[Whitepaper] 8 Key Steps of Data Integration: Restructuring Redeployment Asse...
[Whitepaper] 8 Key Steps of Data Integration: Restructuring Redeployment Asse...[Whitepaper] 8 Key Steps of Data Integration: Restructuring Redeployment Asse...
[Whitepaper] 8 Key Steps of Data Integration: Restructuring Redeployment Asse...Flevy.com Best Practices
 
[Whitepaper] Strategy Classics: Value Disciplines Model
[Whitepaper] Strategy Classics: Value Disciplines Model[Whitepaper] Strategy Classics: Value Disciplines Model
[Whitepaper] Strategy Classics: Value Disciplines ModelFlevy.com Best Practices
 
[Whitepaper] The Definitive Guide to Strategic Planning: Here’s What You Need...
[Whitepaper] The Definitive Guide to Strategic Planning: Here’s What You Need...[Whitepaper] The Definitive Guide to Strategic Planning: Here’s What You Need...
[Whitepaper] The Definitive Guide to Strategic Planning: Here’s What You Need...Flevy.com Best Practices
 
[Whitepaper] The Definitive Introduction to Strategy Development and Strategy...
[Whitepaper] The Definitive Introduction to Strategy Development and Strategy...[Whitepaper] The Definitive Introduction to Strategy Development and Strategy...
[Whitepaper] The Definitive Introduction to Strategy Development and Strategy...Flevy.com Best Practices
 
[Whitepaper] The “Theory of Constraints:” What’s Limiting Your Organization?
[Whitepaper] The “Theory of Constraints:” What’s Limiting Your Organization?[Whitepaper] The “Theory of Constraints:” What’s Limiting Your Organization?
[Whitepaper] The “Theory of Constraints:” What’s Limiting Your Organization?Flevy.com Best Practices
 
[Whitepaper] Transportation Cost Reduction in Supply Chain Management
[Whitepaper] Transportation Cost Reduction in Supply Chain Management[Whitepaper] Transportation Cost Reduction in Supply Chain Management
[Whitepaper] Transportation Cost Reduction in Supply Chain ManagementFlevy.com Best Practices
 
[Whitepaper] A Great Leadership Experience: Dr. Rachid Yazami, Inventor of th...
[Whitepaper] A Great Leadership Experience: Dr. Rachid Yazami, Inventor of th...[Whitepaper] A Great Leadership Experience: Dr. Rachid Yazami, Inventor of th...
[Whitepaper] A Great Leadership Experience: Dr. Rachid Yazami, Inventor of th...Flevy.com Best Practices
 
[Whitepaper] Finding It Hard to Manage Conflict at the Workplace? Use the Tho...
[Whitepaper] Finding It Hard to Manage Conflict at the Workplace? Use the Tho...[Whitepaper] Finding It Hard to Manage Conflict at the Workplace? Use the Tho...
[Whitepaper] Finding It Hard to Manage Conflict at the Workplace? Use the Tho...Flevy.com Best Practices
 
[Whitepaper] Key Account Management: Handling Large Global Accounts the Right...
[Whitepaper] Key Account Management: Handling Large Global Accounts the Right...[Whitepaper] Key Account Management: Handling Large Global Accounts the Right...
[Whitepaper] Key Account Management: Handling Large Global Accounts the Right...Flevy.com Best Practices
 
[Whitepaper] Nudge Theory: An Effective Way to Transform Negative Behaviors
[Whitepaper] Nudge Theory: An Effective Way to Transform Negative Behaviors[Whitepaper] Nudge Theory: An Effective Way to Transform Negative Behaviors
[Whitepaper] Nudge Theory: An Effective Way to Transform Negative BehaviorsFlevy.com Best Practices
 
[Whitepaper] Business Model Innovation: Creation of Scalable Business Models ...
[Whitepaper] Business Model Innovation: Creation of Scalable Business Models ...[Whitepaper] Business Model Innovation: Creation of Scalable Business Models ...
[Whitepaper] Business Model Innovation: Creation of Scalable Business Models ...Flevy.com Best Practices
 
[Whitepaper] Shareholder Value Traps: How to Evade Them and Focus on Value Cr...
[Whitepaper] Shareholder Value Traps: How to Evade Them and Focus on Value Cr...[Whitepaper] Shareholder Value Traps: How to Evade Them and Focus on Value Cr...
[Whitepaper] Shareholder Value Traps: How to Evade Them and Focus on Value Cr...Flevy.com Best Practices
 

Plus de Flevy.com Best Practices (20)

100 Case Studies on Strategy & Transformation.pdf
100 Case Studies on Strategy & Transformation.pdf100 Case Studies on Strategy & Transformation.pdf
100 Case Studies on Strategy & Transformation.pdf
 
Project Management for MBA (in French)
Project Management for MBA (in French)Project Management for MBA (in French)
Project Management for MBA (in French)
 
4 Stages of Disruption
4 Stages of Disruption4 Stages of Disruption
4 Stages of Disruption
 
Customer-centric Culture
Customer-centric CultureCustomer-centric Culture
Customer-centric Culture
 
[Whitepaper] Business Transformation Success Factors
[Whitepaper] Business Transformation Success Factors[Whitepaper] Business Transformation Success Factors
[Whitepaper] Business Transformation Success Factors
 
[Whitepaper] 5 Dimensions of Employee Engagement Scorecard
[Whitepaper] 5 Dimensions of Employee Engagement Scorecard[Whitepaper] 5 Dimensions of Employee Engagement Scorecard
[Whitepaper] 5 Dimensions of Employee Engagement Scorecard
 
[Whitepaper] Digital Transformation: Workforce Digitization
[Whitepaper] Digital Transformation: Workforce Digitization[Whitepaper] Digital Transformation: Workforce Digitization
[Whitepaper] Digital Transformation: Workforce Digitization
 
[Whitepaper] Strategic Human Resources: Evolution of Competition
[Whitepaper] Strategic Human Resources: Evolution of Competition[Whitepaper] Strategic Human Resources: Evolution of Competition
[Whitepaper] Strategic Human Resources: Evolution of Competition
 
[Whitepaper] 8 Key Steps of Data Integration: Restructuring Redeployment Asse...
[Whitepaper] 8 Key Steps of Data Integration: Restructuring Redeployment Asse...[Whitepaper] 8 Key Steps of Data Integration: Restructuring Redeployment Asse...
[Whitepaper] 8 Key Steps of Data Integration: Restructuring Redeployment Asse...
 
[Whitepaper] Strategy Classics: Value Disciplines Model
[Whitepaper] Strategy Classics: Value Disciplines Model[Whitepaper] Strategy Classics: Value Disciplines Model
[Whitepaper] Strategy Classics: Value Disciplines Model
 
[Whitepaper] The Definitive Guide to Strategic Planning: Here’s What You Need...
[Whitepaper] The Definitive Guide to Strategic Planning: Here’s What You Need...[Whitepaper] The Definitive Guide to Strategic Planning: Here’s What You Need...
[Whitepaper] The Definitive Guide to Strategic Planning: Here’s What You Need...
 
[Whitepaper] The Definitive Introduction to Strategy Development and Strategy...
[Whitepaper] The Definitive Introduction to Strategy Development and Strategy...[Whitepaper] The Definitive Introduction to Strategy Development and Strategy...
[Whitepaper] The Definitive Introduction to Strategy Development and Strategy...
 
[Whitepaper] The “Theory of Constraints:” What’s Limiting Your Organization?
[Whitepaper] The “Theory of Constraints:” What’s Limiting Your Organization?[Whitepaper] The “Theory of Constraints:” What’s Limiting Your Organization?
[Whitepaper] The “Theory of Constraints:” What’s Limiting Your Organization?
 
[Whitepaper] Transportation Cost Reduction in Supply Chain Management
[Whitepaper] Transportation Cost Reduction in Supply Chain Management[Whitepaper] Transportation Cost Reduction in Supply Chain Management
[Whitepaper] Transportation Cost Reduction in Supply Chain Management
 
[Whitepaper] A Great Leadership Experience: Dr. Rachid Yazami, Inventor of th...
[Whitepaper] A Great Leadership Experience: Dr. Rachid Yazami, Inventor of th...[Whitepaper] A Great Leadership Experience: Dr. Rachid Yazami, Inventor of th...
[Whitepaper] A Great Leadership Experience: Dr. Rachid Yazami, Inventor of th...
 
[Whitepaper] Finding It Hard to Manage Conflict at the Workplace? Use the Tho...
[Whitepaper] Finding It Hard to Manage Conflict at the Workplace? Use the Tho...[Whitepaper] Finding It Hard to Manage Conflict at the Workplace? Use the Tho...
[Whitepaper] Finding It Hard to Manage Conflict at the Workplace? Use the Tho...
 
[Whitepaper] Key Account Management: Handling Large Global Accounts the Right...
[Whitepaper] Key Account Management: Handling Large Global Accounts the Right...[Whitepaper] Key Account Management: Handling Large Global Accounts the Right...
[Whitepaper] Key Account Management: Handling Large Global Accounts the Right...
 
[Whitepaper] Nudge Theory: An Effective Way to Transform Negative Behaviors
[Whitepaper] Nudge Theory: An Effective Way to Transform Negative Behaviors[Whitepaper] Nudge Theory: An Effective Way to Transform Negative Behaviors
[Whitepaper] Nudge Theory: An Effective Way to Transform Negative Behaviors
 
[Whitepaper] Business Model Innovation: Creation of Scalable Business Models ...
[Whitepaper] Business Model Innovation: Creation of Scalable Business Models ...[Whitepaper] Business Model Innovation: Creation of Scalable Business Models ...
[Whitepaper] Business Model Innovation: Creation of Scalable Business Models ...
 
[Whitepaper] Shareholder Value Traps: How to Evade Them and Focus on Value Cr...
[Whitepaper] Shareholder Value Traps: How to Evade Them and Focus on Value Cr...[Whitepaper] Shareholder Value Traps: How to Evade Them and Focus on Value Cr...
[Whitepaper] Shareholder Value Traps: How to Evade Them and Focus on Value Cr...
 

Dernier

PHX May 2024 Corporate Presentation Final
PHX May 2024 Corporate Presentation FinalPHX May 2024 Corporate Presentation Final
PHX May 2024 Corporate Presentation FinalPanhandleOilandGas
 
Rice Manufacturers in India | Shree Krishna Exports
Rice Manufacturers in India | Shree Krishna ExportsRice Manufacturers in India | Shree Krishna Exports
Rice Manufacturers in India | Shree Krishna ExportsShree Krishna Exports
 
Over the Top (OTT) Market Size & Growth Outlook 2024-2030
Over the Top (OTT) Market Size & Growth Outlook 2024-2030Over the Top (OTT) Market Size & Growth Outlook 2024-2030
Over the Top (OTT) Market Size & Growth Outlook 2024-2030tarushabhavsar
 
Cracking the 'Career Pathing' Slideshare
Cracking the 'Career Pathing' SlideshareCracking the 'Career Pathing' Slideshare
Cracking the 'Career Pathing' SlideshareWorkforce Group
 
Lucknow Housewife Escorts by Sexy Bhabhi Service 8250092165
Lucknow Housewife Escorts  by Sexy Bhabhi Service 8250092165Lucknow Housewife Escorts  by Sexy Bhabhi Service 8250092165
Lucknow Housewife Escorts by Sexy Bhabhi Service 8250092165meghakumariji156
 
SEO Case Study: How I Increased SEO Traffic & Ranking by 50-60% in 6 Months
SEO Case Study: How I Increased SEO Traffic & Ranking by 50-60%  in 6 MonthsSEO Case Study: How I Increased SEO Traffic & Ranking by 50-60%  in 6 Months
SEO Case Study: How I Increased SEO Traffic & Ranking by 50-60% in 6 MonthsIndeedSEO
 
Unveiling Falcon Invoice Discounting: Leading the Way as India's Premier Bill...
Unveiling Falcon Invoice Discounting: Leading the Way as India's Premier Bill...Unveiling Falcon Invoice Discounting: Leading the Way as India's Premier Bill...
Unveiling Falcon Invoice Discounting: Leading the Way as India's Premier Bill...Falcon Invoice Discounting
 
Katrina Personal Brand Project and portfolio 1
Katrina Personal Brand Project and portfolio 1Katrina Personal Brand Project and portfolio 1
Katrina Personal Brand Project and portfolio 1kcpayne
 
Power point presentation on enterprise performance management
Power point presentation on enterprise performance managementPower point presentation on enterprise performance management
Power point presentation on enterprise performance managementVaishnaviGunji
 
Phases of Negotiation .pptx
 Phases of Negotiation .pptx Phases of Negotiation .pptx
Phases of Negotiation .pptxnandhinijagan9867
 
How to Get Started in Social Media for Art League City
How to Get Started in Social Media for Art League CityHow to Get Started in Social Media for Art League City
How to Get Started in Social Media for Art League CityEric T. Tung
 
Falcon Invoice Discounting: Empowering Your Business Growth
Falcon Invoice Discounting: Empowering Your Business GrowthFalcon Invoice Discounting: Empowering Your Business Growth
Falcon Invoice Discounting: Empowering Your Business GrowthFalcon investment
 
Mckinsey foundation level Handbook for Viewing
Mckinsey foundation level Handbook for ViewingMckinsey foundation level Handbook for Viewing
Mckinsey foundation level Handbook for ViewingNauman Safdar
 
Lundin Gold - Q1 2024 Conference Call Presentation (Revised)
Lundin Gold - Q1 2024 Conference Call Presentation (Revised)Lundin Gold - Q1 2024 Conference Call Presentation (Revised)
Lundin Gold - Q1 2024 Conference Call Presentation (Revised)Adnet Communications
 
Famous Olympic Siblings from the 21st Century
Famous Olympic Siblings from the 21st CenturyFamous Olympic Siblings from the 21st Century
Famous Olympic Siblings from the 21st Centuryrwgiffor
 
Uneak White's Personal Brand Exploration Presentation
Uneak White's Personal Brand Exploration PresentationUneak White's Personal Brand Exploration Presentation
Uneak White's Personal Brand Exploration Presentationuneakwhite
 
joint cost.pptx COST ACCOUNTING Sixteenth Edition ...
joint cost.pptx  COST ACCOUNTING  Sixteenth Edition                          ...joint cost.pptx  COST ACCOUNTING  Sixteenth Edition                          ...
joint cost.pptx COST ACCOUNTING Sixteenth Edition ...NadhimTaha
 
Pre Engineered Building Manufacturers Hyderabad.pptx
Pre Engineered  Building Manufacturers Hyderabad.pptxPre Engineered  Building Manufacturers Hyderabad.pptx
Pre Engineered Building Manufacturers Hyderabad.pptxRoofing Contractor
 

Dernier (20)

PHX May 2024 Corporate Presentation Final
PHX May 2024 Corporate Presentation FinalPHX May 2024 Corporate Presentation Final
PHX May 2024 Corporate Presentation Final
 
Rice Manufacturers in India | Shree Krishna Exports
Rice Manufacturers in India | Shree Krishna ExportsRice Manufacturers in India | Shree Krishna Exports
Rice Manufacturers in India | Shree Krishna Exports
 
Over the Top (OTT) Market Size & Growth Outlook 2024-2030
Over the Top (OTT) Market Size & Growth Outlook 2024-2030Over the Top (OTT) Market Size & Growth Outlook 2024-2030
Over the Top (OTT) Market Size & Growth Outlook 2024-2030
 
Cracking the 'Career Pathing' Slideshare
Cracking the 'Career Pathing' SlideshareCracking the 'Career Pathing' Slideshare
Cracking the 'Career Pathing' Slideshare
 
Lucknow Housewife Escorts by Sexy Bhabhi Service 8250092165
Lucknow Housewife Escorts  by Sexy Bhabhi Service 8250092165Lucknow Housewife Escorts  by Sexy Bhabhi Service 8250092165
Lucknow Housewife Escorts by Sexy Bhabhi Service 8250092165
 
SEO Case Study: How I Increased SEO Traffic & Ranking by 50-60% in 6 Months
SEO Case Study: How I Increased SEO Traffic & Ranking by 50-60%  in 6 MonthsSEO Case Study: How I Increased SEO Traffic & Ranking by 50-60%  in 6 Months
SEO Case Study: How I Increased SEO Traffic & Ranking by 50-60% in 6 Months
 
Unveiling Falcon Invoice Discounting: Leading the Way as India's Premier Bill...
Unveiling Falcon Invoice Discounting: Leading the Way as India's Premier Bill...Unveiling Falcon Invoice Discounting: Leading the Way as India's Premier Bill...
Unveiling Falcon Invoice Discounting: Leading the Way as India's Premier Bill...
 
Katrina Personal Brand Project and portfolio 1
Katrina Personal Brand Project and portfolio 1Katrina Personal Brand Project and portfolio 1
Katrina Personal Brand Project and portfolio 1
 
Power point presentation on enterprise performance management
Power point presentation on enterprise performance managementPower point presentation on enterprise performance management
Power point presentation on enterprise performance management
 
Buy gmail accounts.pdf buy Old Gmail Accounts
Buy gmail accounts.pdf buy Old Gmail AccountsBuy gmail accounts.pdf buy Old Gmail Accounts
Buy gmail accounts.pdf buy Old Gmail Accounts
 
Phases of Negotiation .pptx
 Phases of Negotiation .pptx Phases of Negotiation .pptx
Phases of Negotiation .pptx
 
How to Get Started in Social Media for Art League City
How to Get Started in Social Media for Art League CityHow to Get Started in Social Media for Art League City
How to Get Started in Social Media for Art League City
 
Mifty kit IN Salmiya (+918133066128) Abortion pills IN Salmiyah Cytotec pills
Mifty kit IN Salmiya (+918133066128) Abortion pills IN Salmiyah Cytotec pillsMifty kit IN Salmiya (+918133066128) Abortion pills IN Salmiyah Cytotec pills
Mifty kit IN Salmiya (+918133066128) Abortion pills IN Salmiyah Cytotec pills
 
Falcon Invoice Discounting: Empowering Your Business Growth
Falcon Invoice Discounting: Empowering Your Business GrowthFalcon Invoice Discounting: Empowering Your Business Growth
Falcon Invoice Discounting: Empowering Your Business Growth
 
Mckinsey foundation level Handbook for Viewing
Mckinsey foundation level Handbook for ViewingMckinsey foundation level Handbook for Viewing
Mckinsey foundation level Handbook for Viewing
 
Lundin Gold - Q1 2024 Conference Call Presentation (Revised)
Lundin Gold - Q1 2024 Conference Call Presentation (Revised)Lundin Gold - Q1 2024 Conference Call Presentation (Revised)
Lundin Gold - Q1 2024 Conference Call Presentation (Revised)
 
Famous Olympic Siblings from the 21st Century
Famous Olympic Siblings from the 21st CenturyFamous Olympic Siblings from the 21st Century
Famous Olympic Siblings from the 21st Century
 
Uneak White's Personal Brand Exploration Presentation
Uneak White's Personal Brand Exploration PresentationUneak White's Personal Brand Exploration Presentation
Uneak White's Personal Brand Exploration Presentation
 
joint cost.pptx COST ACCOUNTING Sixteenth Edition ...
joint cost.pptx  COST ACCOUNTING  Sixteenth Edition                          ...joint cost.pptx  COST ACCOUNTING  Sixteenth Edition                          ...
joint cost.pptx COST ACCOUNTING Sixteenth Edition ...
 
Pre Engineered Building Manufacturers Hyderabad.pptx
Pre Engineered  Building Manufacturers Hyderabad.pptxPre Engineered  Building Manufacturers Hyderabad.pptx
Pre Engineered Building Manufacturers Hyderabad.pptx
 

Valuation Model for Professional Services Firm

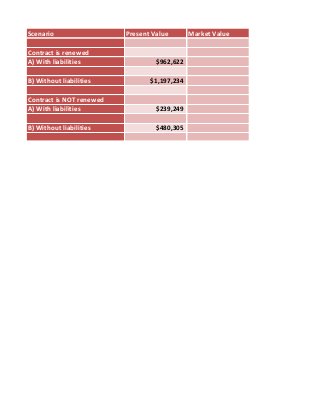
  • 1. Scenario Present Value Contract is renewed A) With liabilities $962,622 B) Without liabilities $1,197,234 Contract is NOT renewed A) With liabilities $239,249 B) Without liabilities $480,305 Market Value
  • 2. Free Cash Flow Valuation -- Professional Services Firm (Modifying variables in red will dynamically update the MV of the company) Forecasting Variables: 2013 2014 2015 2016 2017 2018 2019 2020 2021 Revenue growth factor 35% 35% 35% 30% 30% 30% 20% 20% 20% Expected gross profit margin 18% 19% 20% 20% 21% 22% 22% 23% 24% S, G, & A expense % of revenue 20% 21% 21% 22% 23% 24% 25% 25% 26% Depr. & Amort. % of revenue 4% 4% 4% 4% 5% 5% 5% 5% 5% 2013 2014 2015 2016 2017 2018 2019 2020 2021 ($16,989) ($838) Income tax rate Assumed long-term sustainable growth rate Discount rate 35% 4.72% per year after 2022 11.22% Valuation Model Outputs: Free cash flow Terminal value PV of Company Operations ($ mil) Add: Total Assets Less: Total Liabilities Market Value of Company Assets ($ mil) $848 $25,961 $4,963 $29,035 $37,745 ($20,131) $54,353 $1,077,589 $126,089.0 $241,056.0 $962,622 Note 1: Long Term Growth Rate The long term GDP growth rate from 1947-2010 was 3.23%. Using the industry Beta of 1.46 as a proxy for sustainable growth rate above the average growth rate of the economy, the long term growth rate assumption is 4.72%. Note that infinite growth above trend GDP is only reasonable because higher betas imply greater risk of insolvency. If the company survives, a long term growth rate above average GDP is reasonable. Data obtained from: http://www.tradingeconomics.com/united-states/gdp-growth Note 2: Total Liabilities I used total liabilities because they represent the obligations of the company, unless discharged in the merger. If you want to use long term liabilities, use $131,096 in cell C22
  • 4. The Discounted Free Cash Flow Model for A Professional Services Firm Actual 2012 Total revenue Cost of Goods Sold Years Ending December 31 |------------------------------------------------------------------------------------------ Forecast ----------------------------------------------------------------------------------------| 2013 2014 2015 2016 2017 2018 2019 2020 2021 2022 $1,551,738 $2,094,846 $2,828,043 $3,817,857 $4,963,215 $6,452,179 $8,387,833 $10,065,399 $12,078,479 $14,494,175 $17,393,010 1,270,527 1,717,774 2,290,714 3,054,286 3,970,572 5,097,221 6,542,509 7,851,011 9,300,429 11,015,573 13,044,757 Gross profit 281,211 377,072 537,328 763,571 992,643 1,354,958 1,845,323 2,214,388 2,778,050 3,478,602 4,348,252 Selling, general and administrative expenses 312,474 418,969 593,889 801,750 1,091,907 1,484,001 2,013,080 2,516,350 3,019,620 3,768,485 4,522,183 Earnings before interest, taxes, depr. & amort. (EBITDA) (31,263) (41,897) (56,561) (38,179) (99,264) (129,044) (167,757) (301,962) (241,570) (289,883) 9,520 75,414 107,466 145,079 198,529 322,609 419,392 503,270 603,924 724,709 Earnings before Interest and taxes (EBIT) Net taxable earnings (40,783) (40,783) (117,311) (117,311) (164,026) (164,026) (183,257) (183,257) (297,793) (297,793) (451,653) (451,653) (587,148) (587,148) (805,232) (805,232) (845,494) (845,494) (1,014,592) (1,014,592) (1,043,581) (1,043,581) Federal and State Income Taxes (14,274) (41,059) (57,409) (64,140) (104,228) (158,078) (205,502) (281,831) (295,923) (355,107) (365,253) Net Operating Profit After-Tax (NOPAT) (26,509) (76,252) (106,617) (119,117) (193,565) (293,574) (381,646) (523,401) (549,571) (659,485) (678,327) 9,520 75,414 Depreciation and amortization Add back depreciation and amortization Free Cash Flow 869,650 107,466 145,079 198,529 322,609 419,392 503,270 603,924 724,709 869,650 ($838) $848 $25,961 $4,963 $29,035 $37,745 ($20,131) $54,353 $65,224 $191,323 $2,943,431 $913,781 (753) ($16,989) 686 18,870 3,244 17,061 19,942 (9,563) 23,215 25,047 66,060 Terminal Value, 2023 Terminal Value, 2013 Present Value of Free Cash Flows @ 11.22% Total Present Value of Company Operations $1,077,589 Plus Current Assets $ 119,645 Total Market Value of Great Expectations' Assets (173,930) $1,197,234
  • 5. Free Cash Flow Valuation -- Professional Services Firm (Modifying variables in red will dynamically update the MV of the company) Forecasting Variables: 2013 2014 2015 2016 2017 2018 2019 2020 2021 Revenue growth factor 35% 35% 35% 30% 30% 30% 20% 20% 20% Expected gross profit margin 18% 19% 20% 20% 21% 22% 22% 23% 24% S, G, & A expense % of revenue 20% 21% 21% 22% 23% 24% 25% 25% 26% Depr. & Amort. % of revenue 4% 4% 4% 4% 5% 5% 5% 5% 5% 2014 2015 2016 2017 2018 2019 2020 2021 Income tax rate Assumed long-term sustainable growth rate Discount rate 35% 4.72% per year after 2022 11.22% 2013 Valuation Model Outputs: Free cash flow Terminal value PV of Company Operations ($ mil) Add: Total Assets Less: Total Liabilities Market Value of Company Assets ($ mil) ($275) $279 $8,534 $1,631 $9,544 $12,407 ($6,617) $17,867 $21,440 $354,216 $126,089.0 $241,056.0 $239,249 Note 1: Long Term Growth Rate The long term GDP growth rate from 1947-2010 was 3.23%. Using the industry Beta of 1.46 as a proxy for sustainable growth rate above the average growth rate of the economy, the long term growth rate assumption is 4.72%. Note that infinite growth above trend GDP is only reasonable because higher betas imply greater risk of insolvency. If the company survives, a long term growth rate above average GDP is reasonable. Data obtained from: http://www.tradingeconomics.com/united-states/gdp-growth Note 2: Total Liabilities I used total liabilities because they represent the obligations of the company, unless discharged in the merger. If you want to use long term liabilities, use $131,096 in cell C22
  • 7. The Discounted Free Cash Flow Model for Professional Services Firm Actual 2012 Total revenue $510,076 Cost of Goods Sold 1,270,527 Gross profit Selling, general and administrative expenses Earnings before interest, taxes, depr. & amort. (EBITDA) Depreciation and amortization Earnings before Interest and taxes (EBIT) Net taxable earnings Years Ending December 31 |------------------------------------------------------------------------------------------ Forecast ----------------------------------------------------------------------------------------| 2013 2014 2015 2016 2017 2018 2019 2020 2021 $688,603 $929,614 $1,254,978 $1,631,472 $2,120,913 $2,757,187 $3,308,625 $3,970,350 $4,764,419 564,654 752,987 1,003,983 1,305,177 1,675,521 2,150,606 2,580,727 3,057,169 3,620,959 (760,451) 123,948 176,627 250,996 326,294 445,392 606,581 727,897 913,180 1,143,461 312,474 137,721 195,219 263,545 358,924 487,810 661,725 827,156 992,587 1,238,749 (13,772) (18,592) (12,550) (32,629) (42,418) (55,144) (99,259) (79,407) (1,072,925) 9,520 (1,082,445) (1,082,445) (95,288) 24,790 35,325 47,689 65,259 106,046 137,859 165,431 198,517 238,221 (38,562) (38,562) (53,918) (53,918) (60,239) (60,239) (97,888) (97,888) (148,464) (148,464) (193,003) (193,003) (264,690) (264,690) (277,924) (277,924) (333,509) (333,509) Federal and State Income Taxes (378,856) (13,497) (18,871) (21,084) (34,261) (51,962) (67,551) (92,641) (97,274) (116,728) Net Operating Profit After-Tax (NOPAT) (703,590) (25,065) (35,046) (39,155) (63,627) (96,502) (125,452) (172,048) (180,651) (216,781) 24,790 Add back depreciation and amortization Free Cash Flow 9,520 35,325 47,689 65,259 106,046 137,859 165,431 198,517 238,221 ($275) $279 $8,534 $1,631 $9,544 $12,407 ($6,617) $17,867 $21,440 (248) ($694,069) 225 6,203 1,066 5,608 6,555 (3,143) 7,631 8,233 Terminal Value, 2023 Terminal Value, 2013 Present Value of Free Cash Flows @ 11.22% Total Present Value of Company Operations $354,216 Plus Total Assets $ 126,089 Total Market Value of Great Expectations' Assets $480,305
  • 9. Professional Services Firm Discount Rate Determination 100 Year Average US 10-year Treasury Yield: Average Equity Risk Premium Industry Beta Expected Return from CAPM Discount Rate ( r ) 4.90% 4.33% 1.46 11.22% 11.22% Note 1: 100 Year Average Treasury Yield 100 year average 10-year US treasury rate of 4.90% was obtained from: http://observationsandnotes.blogspot.com/2010/11/100-years-of-bond-interest-rate-history.html Note 2: Average Equity Risk Premium The annual compounded return on the US equity composite index for the 1928-2011 time period was 9.23%. The annual compounded return from US Treasury rates was 4.90% for the same period. The difference (4.33%) is the equity risk premium for the composite stock market. The annual compounded return data was obtained from: http://aswathdamodaran.blogspot.com/2012/03/equity-risk-premiums-2012-edition.html Note 3: Industry Beta The industry I used to compare R.A.D. is the "Human Resources" sector. Summary Statistics Industry Name Human Resources # Firms 25 Unlevere Avg. Beta D/E Ratio Tax Rate d Beta 1.38 10.80% 26.61% 1.28 Cash/Firm Value Unlevered Beta corrected for cash 12.49% 1.46 I chose the unlevered Beta corrected for cash due to R.A.D.'s low cash position. The average Beta (1.38) is very close, and either number would work. Data obtained from: http://pages.stern.nyu.edu/~adamodar/New_Home_Page/datafile/Betas.html Note 4: Discount Rate Derived from CAPM The Capital Asset Pricing Model (CAPM): Expected Return ( r ) = Risk free rate + Beta(Equity Risk Premium) r = 4.9 + 1.46(4.33) r = 11.22%
  • 10. Fixed assets: Computer Equipment Accumulated Depreciation (Computer Equipment) Computer Software Accumulated Depreciation (Software) Furniture and Fixtures Accumulated Depreciation (FF&E) Motor Vehicles Accumulated Depreciation (Motor Vehicles) Total fixed assets 2012 8,860.00 (7,990.00) 1,686.00 (1,685.00) 12,556.00 (12,360.00) 33,359.00 (27,982.00) 6,444.00 Depreciable Basis $8,860.00 Yearly Depreciation Expense $1,772.00 $1,686.00 $12,556.00 $2,511.20 $33,360.00 Sum: $337.20 $6,672.00 $56,462.00 Sum: $9,520.40 Note 1: Yearly depreciation and amortization expense calculated by assuming a 5 year useful life and straight line depreciation Note 2: Depreciation and amortization expense is added back to EBITDA to determine FCFF Note 3: The depreciable basis is calculated as the book value (cost) of the asset less the balance in the associated accumulated depreciation account Note 4: New investment in PP&E will use the same 5 year useful life and straight line depreciation method to add to EBITDA to come up with FCFF
  • 11.
  • 12. Professional Services Firm Revenue Gross sales Less sales returns and allowances Net sales Cost of Sales Salaries Payroll Taxes Commissions Health Insurance Reference Checks Total COGS Gross profit (loss) Operating Expenses Income Statement Year to Date Amount $1,558,779 (7,041) 1,551,738 Amount $1,095,795 $127,206 $17,157 $30,009 $360 $1,270,527 $281,211 % of Sales 100% Year to Date % of Sales 71% 8% 1% 2% 0% 82% 18% Year to Date Amount % of Sales $2,049 $1,976 $645 $5,051 $68 $580 $1,397 $10 $595 $271 $45,583 $2,086 $3,598 $13,058 $35 $9,196 $12,489 $1,846 $2,165 $4,227 $34,555 $163,249 $500 $759 $4,032 $2,454 312,474 ($31,263) 0% 0% 0% 0% 0% 0% 0% 0% 0% 0% 3% 0% 0% 1% 0% 1% 1% 0% 0% 0% 2% 11% 0% 0% 0% 0% 20% Selling, General and Administrative (SG&A) Advertising Auto Expense Bad Debt Expense Bank Service Charges Client Lunch Computer Expense Dues and Subscriptions Employee Relations Entertainment Gifts Insurance Legal and Accounting Office Expenses Outside Services Parking Payroll Expenses Payroll Taxes Postage and Delivery Printing and Reproduction Profit Sharing Rent Salaries and wages Suspense Taxes -- Other Telephone Utilities Total SG&A Net income before taxes
  • 13. Taxes on income Net income after taxes Extraordinary gain or loss Income tax on extraordinary gain Net Income (Loss) $0 ($31,263) $0 $0 ($31,263)
  • 14. Professional Services Firm Balance Sheet Assets Current assets: Cash Accounts Receivable Allowance for Bad Debts Officer's Loan Receivable Deposits Total current assets 2012 9,950.00 112,151.00 (10,000.00) 4,132.00 3,412.00 119,645.00 Fixed assets: Computer Equipment Accumulated Depreciation (Computer Equipment) Computer Software Accumulated Depreciation (Software) Furniture and Fixtures Accumulated Depreciation (FF&E) Motor Vehicles Accumulated Depreciation (Motor Vehicles) Total fixed assets 2012 8,860.00 (7,990.00) 1,686.00 (1,685.00) 12,556.00 (12,360.00) 33,359.00 (27,982.00) 6,444.00 Total assets 126,089.00 Liabilities and owner's equity Current liabilities: Credit Cards Cash Overdraft 401K Contributions Payable Federal W/H and FICA Payable MA W/H Payable FUTA Payable SUI & MA Health Payable Child Support Payable Total current liabilities 2012 24,236.00 3,500.00 (200.00) 65,293.00 530.00 200.00 16,215.00 186.00 109,960.00 Long-term liabilities: Accrued State Income Taxes Deferred Income Taxes Reserve Credit -- Fleet Fleet -- Loan Payable Sovereign Credit Line Total long-term liabilities 2012 Owner's equity: 2012 456.00 5,858.00 13,922.00 36,097.00 74,763.00 131,096.00
  • 15. Common Stock Retained Earnings Net Income Total owner's equity Total liabilities and owner's equity 3,175.00 (53,404.00) (64,738.00) (114,967.00) 126,089.00
  • 16. Line Item Growth Factors and Assumptions Revenue Growth Factor: Comparable competitor, On Assignment (ASGN), five year TTM revenues: 12 months 12 months 12 months ending 2011- ending 2010- ending 200912-31 12-31 12-31 Revenues ($MM) 597.28 438.06 416.61 Average Annual Compound Growth Rate 20% Gross Profit Growth Factor: Current growth profit percentage is 18%, assume will gradually increase to ASGN's gross profit percentage to 25% (ASGN at 34% for reference) 25% Selling, General and Administrative as a Percent of Revenues Growth Factor: Current SG&A expense as a percent of revenues is 20% Assume gradually increase to ASGN's SG&A percent of revenues of 25% (ASGN at 26% for reference) 26% Depreciation and Amortization as a Percent of Revenues Growth Factor Current SG&A expense as a percent of revenues is 3.6% Assume gradually increase to ASGN's SG&A expense percent of revenus of 5% 5%