Microsoft Word Chartsrosenblatt
•
0 j'aime•239 vues

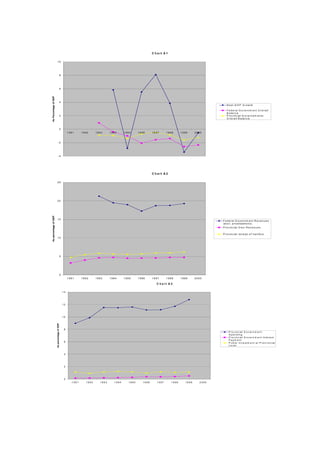
The document contains 9 charts showing economic indicators for different levels of government in India from 1984-2000. The charts show trends in GDP growth, government balances, revenues, expenditures, and public investment at the central/federal, state, and provincial levels of government over this period.

Recommandé
Contenu connexe
Similaire à Microsoft Word Chartsrosenblatt
Similaire à Microsoft Word Chartsrosenblatt (20)
Plus de G Garcia
Plus de G Garcia (20)
Dernier
Dernier (20)
Microsoft Word Chartsrosenblatt
- 1. C h a rt A 1 10 8 6 As Percentage of GDP 4 R e a l G D P G ro w th F e d e r a l G o v e r n m e n t O v e r a ll B a la n c e 2 P r o v in c ia l G o v e r n e m e n t s O v e r a ll B a la n c e 0 1991 1992 1993 1994 1995 1996 1997 1998 1999 2000 -2 -4 C h a rt A 2 25 20 As percentage of GDP 15 F e d e ra l G o v e rn m e n t R e v e n u e s ( e x c l. p r iv a tiz a tio n s ) P r o v in c ia l O w n R e v e n u e s P r o v in c ia l r e c e ip t o f tr a n f e r s 10 5 0 1991 1992 1993 1994 1995 1996 1997 1998 1999 2000 C h a rt A 3 14 12 10 As percentage of GDP 8 P r o v in c ia l G o v e r n m e n t S p e n d in g P r o v in c ia l G o v e r n m e n t I n t e r e s t P a ym e n t 6 P u b li c I n v e s t m e n t a t P r o n v in c ia l Level 4 2 0 1991 1992 1993 1994 1995 1996 1997 1998 1999 2000
- 2. C h a rt C 1 8 6 4 2 As percentage of GDP 0 G D P g r o w th 1984 1985 1986 1987 1988 1989 1990 1991 1992 1993 1994 1995 1996 1997 1998 1999 2000 C e n tr a l G o v e r n m e n t B a la n c e -2 L o c a l G o v e rn m e n t B a la n c e -4 -6 -8 -1 0 C h a rt C 2 18 16 14 12 As percentage of GDP 10 C e n tr a l G o v e r n m e n t R e ven ue Local G o vernm ent O w n R e ven ue 8 Local G o vernm ent R e c e ip t o f T r a n s f e r s 6 4 2 0 1984 1985 1986 1987 1988 1989 1990 1991 1992 1993 1994 1995 1996 1997 1998 1999 2000 C h a rt C 3 14 12 10 As percentage of GDP 8 L o c a l G o v e r n m e n t S p e n d in g L o c a l G o v e r n m e n t In te r e s t P a y m e n ts 6 P u b lic I n v e s tm e n t a t lo c a l le v e l 4 2 0 1984 1985 1986 1987 1988 1989 1990 1991 1992 1993 1994 1995 1996 1997 1998 1999 2000
- 3. C h a rt B 1 8 6 4 As percentage of GDP 2 R e a l G D P G r o w th 0 F e d e r a l G o v e r n m e n t O v e r a ll B a la n c e 1992 1993 1994 1995 1996 1997 1998 1999 2000 S ta t e O v e r a ll B a la n c e -2 -4 -6 -8 C h a rt B 2 25 20 As percentage of GDP 15 F e d e ra l G o v e rn m e n t R e v e n u e S ta te s o w n R e v e n u e S t a t e s re c e i p t s o f t ra n s f e rs 10 5 0 1992 1993 1994 1995 1996 1997 1998 1999 2000 C h a rt B 3 25 20 As percentage of GDP 15 S t a te G o v e r n m e n t S p e n d in g S t a te G o v e r n m e n t I n te r e s t P a y m e n t s P u b lic In v e s tm e n t a t S ta te L e v e l 10 5 0 1992 1993 1994 1995 1996 1997 1998 1999 2000
- 4. C h a rt M 1 8 6 4 As Percentage of GDP 2 R e a l G D P g r o w th 0 F e d e r a l G o v t F is c a l B a la n c e 1989 1990 1991 1992 1993 1994 1995 1996 1997 1998 1999 2000 S ta te O v e r a ll B a la n c e -2 -4 -6 -8 C h a rt M 2 20 18 16 14 As percentage of GDP 12 F e deral R evenue s 10 S ta t e O w n R e v e n u e s S ta t e r e c e ip t o f T r a n s f e r s 8 6 4 2 0 1989 1990 1991 1992 1993 1994 1995 1996 1997 1998 1999 2000 C h a rt M 3 8 7 6 As percentage of GDP 5 T o ta l S ta te E x p e n d itu re s 4 T o ta l S ta te In te r e s t P a y m e n ts S t a t e P u b lic I n v e s t m e n t 3 2 1 0 1989 1990 1991 1992 1993 1994 1995 1996 1997 1998 1999 2000