SlideShare une entreprise Scribd logo
1  sur  59
BA 490: Senior Seminar in Business
Dr. Lori D. Paris
March 11, 2012
Table of Contents
Basic Company Information/History3
Industry Dominant Economic Features5
Five Forces Analysis of the PC industry 14
Strategic implications of Five Forces17
Driving Forces in the Industry 18
Industry Key Success Factors 20
Identify Industry Competitors 21
Strategic Maps 24
Summary of the industry and the overall attractiveness 27
Defining Strategy 28
SWOT analysis 30
Key Resources & Competencies 36
Competitive Strength Assessment 37
Apple’s Leadership and Corporate Culture 37
Financial Analysis 38
Recommendations 42
Appendix A: Financial Ratios 45
References 53
History
In 2011, Diane Hamilton described Apple Inc.’s mission
statement as; “Apple is committed to bringing the best personal
computing experience to students, educators, creative
professionals and consumers around the world through its
innovative hardware, software and internet offerings” (para.3).
Apple’s vision statement is “Man is the creator of change in this
world. As such he should be above systems and structures, and
not subordinate to them" (Huzefa et al, 2009, p.15). With a
common objective to create a low-cost and easy to use
computer, the consummate salesperson Steve Jobs and the
technical genius Steve “Woz” Wozniak got together in 1976 and
founded Apple. In that same year, their first system, the Apple
I, was launched and sold for $666.66 per unit (Powell, para 1).
In 1977, Apple II was released and sold for $1,298.00, and sales
spiked significantly (Huzefa et al., 2009, p.15).
By 1980, Apple became a publicly traded company, and the
Apple III was released. A number of business and technical
issues, such as overpricing of the product, resulted in a
profitable fiasco. The poor revenue and technical failure
resulted in the firing of 40 employees by the CEO at the time,
Michael Scott. The 40 employees accounted for nearly half the
original Apple II team. The first commercially successful
personal computer was Apple’s Macintosh (Mac). Released in
1984 under the guidance of chairman Steve Jobs, it was the first
computer that included a mouse and a graphic. The Mac sold for
$2,495.00. “By the time the Apple II and the Mac rolled around,
Jobs and Woz had popularized the personal computing
revolution, and the rest, as they say, is history” (Powell, para.
1).
During the years between 1985 and 1993, Apple grew from $600
million in annual sales to $8 billion by 1993. Business issues
for Apple in the following years included the release of
Microsoft’s Windows 95 operating system and cheap PC clones
able to run the Macintosh operating system, resulting in
significant quarterly losses in 1996 (Huzefa et al, 2009, p. 11-
12).
In 1985, Steve had been fired from Apple by the board of
directors after ongoing internal conflict within the company. He
began a competing company, NeXT, which designed high-end
computer systems and a refined operating system. Much of
NeXT’s mission was to personally compete with Apple due to a
longstanding grudge Steve carried against the board. 1997 saw
the triumphant return of Steve Jobs to Apple. The great icon and
visionary of the Macintosh, returned to the company when Steve
negotiated the buyout of NeXT by Apple.
Steve Jobs’s return to Apple “steered the company away from
the clones and reversed direction with a back-to-basics
approach” (Powell, para. 15). He officially became the CEO in
January 2000. Steve reinvented Apple’s product line by
introducing stylish hardware and a revamped operating system.
His first success back with the company was the release of the
iMac. The computer’s stylish colors and simple design quickly
became a cultural icon and brought Apple out of near
bankruptcy.
In October 2001, Apple and the entire music industry were
revolutionized, by the released of the iPod. Jobs’s ability to
innovate new products and ideas, as well as implementing
several key structural changes, helped turn the company’s
previous poor performance in the right direction (Thompson et
al, Case 7, p. 148). Between 2001 and 2010, Apple has seen the
international opening of a total of 324 stores (approximately
72% are in the U.S), and sales that have been steadily
increasing year after year (Fig. 1) (Jade, 2011, para. 5). As of
January 2012, Apple had 60,000 full time employees.
FIGURE 1.
Sales for Apple retail stores between 2001-2010
Note: Store total for fiscal year
Industry Dominant Economic Features
Apple operates in the personal computer (PC) industry. They
have experienced incredible growth in the last decade,
somewhat due to the overall year-after-year growth in the PC
industry, as well as their innovative approaches to shaping the
future of the industry. The analysis of the dominant economic
features in the PC industry will focus on the global market
rather than just the U.S. alone, because PC manufacturers sell
there products world-wide.
Before analysis of the industry can be performed, it is crucial to
decide whether to include tablets as part of the PC industry.
Tablet computers, such as the iPad and various competing
products, can arguably be considered personal computing
devices, or alternatively, a separate niche product of an
emerging industry. This potential ambiguity is an important
consideration because the growth of tablet devices could be a
potential “industry-changer” resulting in the future success of
companies such as Apple. For this analysis, tablet devices will
be included in the broader PC industry, and not as a separate
niche industry. Tablet devices contain all the major internal
components of traditional laptop computers, and current
operating systems allow them to nearly replace traditional
computers in some applications.
Market size and growth rate
PC sales have grown exponentially since the beginning of the
century, but have plateaued in recent years. A sharp upswing in
growth rate is apparent after the introduction of tablets. Figure
2 is telling of the industry’s position and product life cycle as
growth generally has been slow for traditional PCs, but with the
advent of tablet computers, has sharply risen. Before the
introduction of the tablet, computer sales consisted of laptops
and desktop PCs. It is difficult to say if in recent years the
stagnation in sales of standard PCs is the result of consumers
finding their needs met by tablets, whereas in the past they
would have purchased a standard PC. In any case, the global
success of Apple’s iPad is a clear indication of the shift of sales
from standard PCs towards tablets accounting for present
growth in the industry.
FIGURE 2
Worldwide PC Unit Shipments, 2000-2015
Note: Source IC Insights. From Electronics.ca Research
Network (2012).
As evidenced in Figure 2 (“Impressive Growth Continues,”
2012) the industry life cycle excluding tablets, is clearly at the
maturity stage. Sales of standard PCs have slowed from their
previous growth years. When including tablets, a different trend
can be observed. There is clearly an exponential growth in sales
for the PC industry, indicating that they are yet again in a
growth stage of their life cycle. The PC industry has gone from
growth stages to maturity in sales of standard PCs, but the
innovation of the release of the tablet has resulted in a renewed
growth stage.
Number of rivals
Five corporations have approximately 70% of the PC market.
These are Acer, Apple, Dell, HP, and Lenovo. Although there
are a number of companies that are competing in the PC
industry, there are only five that can be considered very large
players dominating the industry (Fig. 3) (Elmer-DeWitt, J.
2012). There exist a number of small companies that put
together standard PCs for niche markets, such as gaming and
certain high-end graphic design machines. While small
companies cater to niche markets, the five largest compete for
market share amongst your average computer customers.
FIGURE 3
Global computing share including and excluding iPads
Scope of competitive rivalry
As shown in Figure 4 (Arthur, 2011), the majority of the PC
makers sell their goods in global markets. Consolidations have
also led many companies to become global through the
acquisition of international operating units. Overall, between
2006-2009, profit margins for the companies in the PC industry
increased significantly, mainly due to consolidations in the
industry (“Market Environment.” 2011 para. 2). Therefore, the
significance for PC manufacturers to have a presence in the
foreign market is obvious in order to survive in a competitive
market.
FIGURE 4
Millions of PC sales by region, 2009 Q1-2001Q3
Degree of product differentiation
The importance of contrasting products and services among
rivals in the PC industry is an absolute necessity for all players
trying to improve their market share in a far from perfect
competitive environment. However, the number one reason for
the high price competition in the PC industry is due to the
similarity among marketed products due to mimicking. Copying
other companies’ product releases is as common as the PC
itself. HP’s European personal systems group head, Eric Cador,
announced HP’s response to the successful iPad and claimed
that: “In the tablet world, we’re going to become better than
number one. We call it number one plus” (Tung, 2011 para. 2).
Along with mimicking other company products, the five main
players in the PC industry are constantly trying to win customer
base through product differentiation.
· Acer are striving to distinguish its products by focusing on
value-added benefits, and strive to become the very first super
brand ultra extreme notebook (Ren, 2012 para. 1), as well as
designing environmentally friendly products (Tarsus, para. 2)
· Apple’s have clearly succeeded to differentiate their products
form others, with its regular innovative approach in improving
the features (i.e. style and ease of use) and groundbreaking
technology of its products (Welker, para. 2-3). Apple also
boasts incredible customer support.
· Dell differentiated its products with a strategy on delivering
solutions. “To deliver solutions those are highly capable,
affordable and flexible to meet the needs of large enterprises,
public institutions, small and mid-size businesses” (Dell, para.
2). They have focused on enterprise users, providing scalable
products for different business needs.
· HP has a genuine commitment to sustainability, as well as
striving to provide superior customer service (HP. 2010 para.
2).
· Lenovo differentiates itself by its in-house manufacturing
expertise as well as its corporate target audience, rather than the
individual market (Garg, 2011 p. 32).
Product innovation
Perhaps the most vital part of a company’s economic feature is
the product innovation aspect. The PC has undergone
considerable rapid innovation and change since its introduction,
and the steady price decline in recent years, mainly credited to
globalization of cheaper production, has further stimulated the
urge for innovation (Dedrick, et al, 2006 p. 4).
An effect caused by the rapid innovation is the shortening of
product lifecycles, which is the time between a products release
day until the day it is withdrawn from the market. There is an
inverse relationship between shortening product lifecycles and
PC makers spending in research and development (R&D)
(Bayus, 1998, para. 1). The importance of R&D rests in its
ability to satisfy customers needs for innovative PC products
that fit different lifestyles, ultimately resulting in increased
market share for the successful company.
Supply and Bargaining Power
There are mainly two segments in the PC industry supply-chain,
peripheral components providers and operating systems
providers. There are manufacturers that supply the PC makers
with components such as memory chips, keyboards, and
monitors. The majorities of these components are homogeneous
and are available from a large number of suppliers. The other
component of the PC suppliers is the manufactures that supply
PC makers with key components products, such as
microprocessors and operating systems (OS).
FIGURE 5
Market Share of PC Suppliers
Hardware components are becoming increasingly commoditized,
which limit the bargaining power of suppliers. Therefore, the
PC maker is not limited to a single supplier, but instead chooses
among the best suitable alternative. The latter part of the
supply-chain has considerably more bargaining power.
Microsoft and Intel are good examples of suppliers in the PC
industry that have established a dominant strategic position in
the industry and have significant bargaining power (Simister,
2011 para. 3). This is due to their considerable dominant market
shares. Figure 5 shows that multinational semiconductor chip
maker, Intel, possessed a 60.7% market share in the graphics
processor industry, and their share is forecasted to grow through
the future (GfxS Staff, 2011). Microsoft also has significant
bargaining power due to their 80% market share in operating
systems and is therefore the single major supplier of that
component (Keaton, 2011) (Fig, 6)
FIGURE 6
Total Market Share of the Larges Operating System Makers
Demand and Bargaining Power
As shown in Figure 7, PC buyers are divided into three
categories: business, home, and education. Not only does this
show a 27.7% increase in Apple’s total growth of shipments
versus a decline of 1.2% in the rest of the market, but it also
illustrates a generalized picture of the PC markets overall
segmentation sizes of its buyers. The PC market is dominated
by large-scale buyers, such as business and educational
institutions, that in turn have significant more influence in price
setting.
FIGURE 7
Mac Growth vs. the PC Market
Pace of technological change
The exponential increase of technological change in the past is
not by any means expected to change. Bill Gates, Microsoft
Chairman, predicted in 2008 that technological spikes in the
next 10 years would be even larger that what we have seen in
the past decade (Barakat, 2008 para 1). Hence, it is clear that
big players in the PC industry need to be at the forefront of any
technology advancement in order to stay in business, since
technology is the core factor behind all computers.
Prevalence of background/forward integration
Even though vertical integration can be a complex and costly
strategy to implement successfully, it can be beneficial for a
company in many ways. There are benefits such as increased
control over the value chain, improved cost control through the
distribution process, and increase competitive advantage while
blocking competitors access to valuable resources. Apple is one
of the most vertically integrated companies in the world. In
addition to
operating their own retail chains, they design the hardware and
software in-house, and run their own digital content store,
iTunes (Chen, 2011). In 2008, they acquired the microprocessor
design house, Palo Alto Semiconductor (Fish, 2011). A decade
ago, Dell was one of the world’s most integrated companies in
the world, after acquiring Compaq and Electronic Data Systems
(EDS). As of 2011, HP switched approach and are now at its
shedding stage becoming less vertically integrated in an effort
to trim operating expenses (Takahashi, 2011). A vertical
integration strategy has both pros and cons, but it is necessary
to understand that “for each big company, the calculation is
always different” (Takahashi, 2011, para. 5).
Economies of scale/experience curve effect
Two commonly known concepts: economies of scale and
experience curve effect, which can be used by players in the
computer industry in order to decrease unit costs as volume
rises. Hence, it widens a business’s chances to win market share
over rivals, which in turn is a decisive factor, especially in the
PC industry. When the PC producers double their production
volume, the unit cost is approximately 50% (Bailom et al. 2007
p. 48). Consequently, it would be almost prohibitively
competitive for any small firm to enter the PC industry, while in
absence of these competitive advantages: economies of scale
and experience curve effect.
Entry/exit barriers
The economics of scale as well as the experience curve effect
advantages possessed by the dominant players in the PC
industry works as a barrier for new competitors to enter the
industry. Even though it is relatively cheap to enter the PC
industry due to cheap raw material of building PCs, the capital
requirement that would be required to compete with the
established industry giants is prohibitively large. Taking into
account that Apple spent an estimated $109 billion in research
and development (R&D) last year alone makes a person likely to
think twice about entering the industry (Dignan, 2011). Finally,
well-known brand names established by the big players like
Apple and Dell, have certain intrinsic value that is associated
with their products. Not only is the brand name a great
determinant of the company’s market position, but also works as
a barrier to enter the extremely competitive industry.
Conclusively, the barriers to entry the PC industry are a
challenge. They reduce the rate of entry of new firms, thus
maintaining the level of profits for those already in the
industry. However, with technological savvy, the opportunity to
develop an innovative product that can be marketed to the large
companies exists. The most probable situation for creating
profit with the PC business would be to sell a technology to
currently established companies.
Five Forces Analysis of the PC industry
Threat of new Entrants (WEAK)
· The presence of dominant players with established brands
deters the entry of new players into the market. Strong brand
preferences and customer loyalty works as a high barrier to
entry.
· Because the five leading companies in the PC industry can
take advantage of economies of scale associated with large-
scale operations, the threat of new entries is lowered.
· There is a tremendous disadvantage for new entrants due to
the resource disadvantage associated with the possession of
proprietary technology by large players.
· The presence of copyrights on software etc. works as an
absolute cost advantage for the firms possessing the rights,
therefore working as a barrier to entry.
· The ease in making computers and the low capital requirement
lowers the entry barrier.
The threat of new entrants in the PC industry is very weak, due
to the evidence provided above. The possibility of newcomers
entering the industry and succeeding is therefore extremely
slim.
The Threat of Substitute Products and Services (LOW)
· The price of substitutes, such as netbooks and handheld
mobile devices, with a lower price tag, increases the threat of
substitutes in the PC market.
· The performance characteristic of substitute products does not
reach the standards of PCs capabilities. This lowers the threat
of substitute products.
· The switching cost to substitutes is low, another factor that
increases the treat of alternative products.
The relative price/performance relationship of substitutes in the
PC industry implies that the PCs still are way beyond any such
substitute device due to its wide variety of functions. Even
though smartphones can be considered a threat, the PC has itself
come to work as a substitute to many products in the market
such as TV, CD-player, photo album, book etc. Conclusively,
the threat for substitute products is low. However, it is worth
mentioning that if we were excluding iPads as a category of
PCs, the treat of substitutes would be significantly stronger,
because iPads are clearly cannibalizing the traditional PC sales.
Bargaining Power of Suppliers (Moderate/High)
· Suppliers of highly standardized/commodities components
such as memory chips, keyboards, monitors etc., have low
bargaining power due to the availability and the low switching
cost of these products from a large number of suppliers.
· Suppliers such as Intel and Microsoft dominate the industry in
their field. They supply the PC makers with differentiated
components and therefore have large bargaining power.
· Intel and Microsoft also have a significant impact on many
large PC makers value chain. This further increases their
barging power.
Consequently, since there are mainly two segments in the PC
industry supply-chain, it is fairly straightforward to determine
the bargaining power of those suppliers. The large bargaining
power possessed by Intel and Microsoft due to their
differentiated products as well as their importance in the value
chain of PC makers, weights more than the lack of bargaining
power owned by the commodity suppliers. Therefore, supplier
bargaining power in the PC industry is moderate to high,
making the industry unattractive.
Bargaining Power of Buyers (Moderate)
· Bargaining power of large quantity buyers is large, such as
government and large corporation/businesses, while individual
buyers do not have much barging power.
· Because switching costs are low, buyers have the ability to
switch when quality, service or price offered elsewhere is more
competitive.
The overall bargaining power of buyers is moderate, making the
industry unattractive from a profit making standpoint.
Industry Rivalry (Strong)
· Five large players dominate approximately 70% of the entire
PC industry, which increases rivalry between the firms.
· HP and Apple, are the two largest players in the PC industry.
Their market shares are within approximately 10% of each
other. All the other players have market shares within 5% of
each other. This balanced segmentation of market shares
between players, increases the rivalry and makes the industry
less attractive.
· The relative low strategic difference among large PC players
in the industry also increases the rivalry between players,
because they are, to an extent, fighting for the same market.
· The PC industry growth rate for standard PCs is maturing,
which increases rivalry. On the other hand, the growth rate for
tablet PCs has realized rapid growth since its birthdate. So
while there is less rivalry in the market for tablet PCs, it is
fierce rivalry between standard PC makers.
· All players in the PC industry realize revenue from other
industries, but the majority of the revenue is from PC sales.
This increases the rivalry among firms.
· The cost for buyers to switch between the industries giants is
minimal, therefore stronger rivalry in the industry.
· Because the market share of the tablets are mainly in Apple,
companies make aggressive moves to improve their market
prospects, rivalry increases.
Clearly, the PC industry rivalry is very strong and unattractive
from an earnings standpoint.
Strategic implications of Five Forces
By evaluating Porter’s Five Forces the PC industry’s potential
profit and attractiveness can be examined through an assessment
of its competitive environment. Strong rivalry among the
players in the PC industry, the moderate bargaining power of
customers, and the moderate/high bargaining power of suppliers
makes the competitive environment unattractive from an earning
standpoint. On the other hand, the competitive environment is
ideal from a profit-making standpoint because entry barriers are
high, and good substitutes do not exists. While it would be
relatively unwise for newcomers to enter the PC industry, the
industry itself has moderate opportunities for profit making.
Driving Forces in the Industry
Product Innovation
Gartner, the world’s leading technology research company,
recognized netbooks as the one force driving the PC industry in
2009 (Hruska, 2008, para. 1). Today, the innovative
introduction of tablets appears to be a driving force that will
cause the PC industry environment to change. A potential effect
of product innovation could be a wider customer base, renewed
industry growth, and broadening the degree of product
differentiation. Rivals that successfully incorporate product
innovation can see a strengthening market share, to the expense
of less successful competitors (Chaneta, p. 41).
Technological Improvement
Ultimately, product innovation in the PC industry is based upon
technological improvement. Technological improvements
generally are focused on building smaller and more energy
efficient components. Most computer components depend on the
size of semiconductor materials to create the various microchips
and circuitry. Moore’s Law describes that roughly every two
years the number of transistors that can be placed on an
integrated circuit doubles. The decrease in size and cost of
building components from cheaper and small semiconductors
allows smaller products to be developed. These developments
result in cheaper devices and smaller products (Kanter, 2011
para. 1-3).
The past is evidential enough to conclude that technological
improvement can alter the industry landscape significantly. Not
only does it allow for the development of advanced product
lines, but it can also present an opportunity to minimize unit
cost, which in itself can result in lower price to customers. This
can positively affect large players in the industry that can take
advantage of economies of scale and experience curve effect to
increase profit margin.
Changes in Customer Expectations & Demographics
Industry conditions will change along with the realized
consumers expectation philosophy of: “access everything,
everywhere”. Prices of computers have decreased throughout
the PC industry’s existence to a price affordable to most
households. Also, “we use them for everything from storing
home movies, music and photos, through to planning trips and
holidays, socializing, online shopping, gaming, finding a cure
for cancer and searching for extraterrestrial life” (Dexter, 2011
para. 5).
Leslie Fiering, research vice president at Gartner, strongly
believes that kids, under the age of 15, will account for 50% of
touchscreens users as of 2015. Garner also expects a significant
increase in touchscreen devices for educational purposes
(Schroeder, 2010 para. 2-5). According to J. Thomas, “Apple
totally flipped the demographics of the tablet market almost
overnight” (para, 11). As of 2010, males made up approximately
66% of the tablet market, and 62% were younger than 34, while
no more than 10% were over 65. As of 2011, 49% of all users
are women and 30% of users were 55 and older (Thomas, 2010).
The availability of information at our fingertips will have a
profound effect on the PC industry and force adjustments to
adapt to market demand. The result will force an extension in
PC maker’s product line and the potential for increased profits
is large. An expansion in target markets to women, as well as
younger and older generations will arguably increase profits as
well.
Impact of Driving Forces
PC makers that are able to successfully incorporate innovation
will most likely be able to win market share and realize positive
returns. Less successful players will loose market share, but an
overall renewal of growth and profitability in the PC industry
will most likely be the effect of product innovation. The
technological driving force will undoubtedly present an
opportunity for an increased profitability among large players in
the PC industry, which can take advantage of economies of
scale lower cost and increase unit shipments. Geographic shifts,
such as changes in those who buy the products and how the
products are used, will most likely expand the PC makers’
product lines and target market. This can have a profound effect
on competitor’s income statements.
Industry Key Success Factors
There are particular competitive factors that are important to all
players within the PC industry. These are termed “key success
factors” (KSF). All of these are core elements that determine
the future competitive success of the players in the PC industry.
Technology-related KSFs
Technological advancement is the core factor in the PC
industry. According to Moore’s law, the number of transistors
on a microchip will double about every two years. This law lays
the foundation for the survival of any player in the PC industry.
Without the ability to adopt new technological capabilities at
the same time as improving energy efficiency, there is no
chance of survival in this highly competitive industry.
Skills-related KSFs
There are two main reasons why Apple manufactured the iPhone
in China rather than in the U.S. The principal and most obvious
reason is the utilization of the cheap workforce in China. The
second reason is the lack of qualified engineers in the U.S.
Approximately 8,700 industrial engineers were required to
oversee the assembly-line production, and Apple analyst’s
forecasted that it would take as much as nine months to acquire
the needed workforce. On the other hand, it would take 15 days
in China (Chan, 2012 para. 3).
Effective cost control KSFs
The constant lowering of prices of PCs are predicted to
continue. Because of this reason, PC manufactures need to
establish an efficient cost control system, in order to make
profit and to keep or improve market share.
Innovation KSFs
Figure 8 illustrates the significance of innovation in the fierce
competitive PC industry. The shift away from traditional PCs to
tablets and smartphones highlights the innovative approach that
PC manufacturers need to focus on in order to maintain market
share (Kingsley. H, 2012 para.1).
Figure 8
Units Shipped Per Year (Log Scale)
Marketing-related KSFs
During FY2010, Apple spent approximately $691 million on
advertising. This was an increase of $190 million from 2009.
Apple saw a tremendous increase in revenue due to efficient
advertising strategies (Dilger, 2010 para 1). PC makers need to
use efficient marketing related strategies such as advertising is
clearly essential for the survival of the companies.
Identify Industry Competitors
There are primarily five competitors in the PC industry: Apple,
Dell, HP, Lenovo, and Acer. A brief introduction of each
corporation follows herein.
Apple Inc.
Apple Inc. and its wholly owned subsidiaries, collectively
called “Apple,” are designing and manufacturing a wide range
of technological product/services such as digital music players,
software, personal computers, and mobile communication
devices. The company was founded in 1977 in California. Apple
is a global vendor who sells its products through its retail
stores, online stores, direct sales force, and retailers. Apple’s
customers are consumer, businesses, educational institutions,
enterprises, as well as government and creative markets (Apple
Inc., 10-K, 2010 p. 1). As of 2011, Apple has approximately
22% of the computer market share (see Fig. 6) and a net income
of $14,013 million in 2010 (Apple Inc., 10-K, 2010 p. 47).
Hewlett-Packard (HP)
HP was founded in 1939 and was incorporated from California
to Delaware 1947. HP is a global, leading provider of software
and technologies to businesses, government, enterprises, and
educational institutions (HP, 10-K, 2010 p. 3). In 2011, HP
retained approximately 15% computing market share in the PC
industry (see Fig. 6) and a net income of $8,761 million as of
2010 (HP, 10-K, 2010 p. 73).
Lenovo
1984 is the year when Legend Holdings was formed in China.
They were incorporated in Hong Kong in 1988. Legend Holding
changed its name to Lenovo as of 2004. Lenovo is a global
corporation with employees in 60 countries, but serves customer
in more than 160 countries. Lenovo supply customers
(businesses, educational institutions, government) with
technology products and services such PCs, servers, mobile
devices, and workstations (About Lenovo, 2012 para. 1-5).
Lenovo had, as of 2011, approximately 12% computing market
share in the PC industry (see Fig. 6), with a net income of $76
million in 2010 (Lenovo, 10-K, 2010 p. 71).
Acer Inc.
Acer, the now globally operating corporation was founded in
1976. Acer supply customers (consumers, businesses, and
educational institutions) with services and products such as
PCs, netbooks, tablets, and projectors. (About Acer, 2012 para.
1). Acer maintained approximately 11% computing market share
in the PC industry in 2011 (see Fig. 6), and realized $519
million as of 2010 (Acer Inc., 10-K, 2010 p. 75).
Dell Inc.
Dell is a global corporation and was founded in 1984. They
offer a broad range of products (mobile products, desktop PCs,
software, and servers) to a broad customer based including
businesses, educational institutions, and consumers (Dell Inc.,
10-K, 2010 p.1). As of 2011, Dell had accumulated
approximately 7% global computing market share in the PC
industry (see Fig. 6), and realized $1,433 million in net income
as of 2010 (Dell Inc., 10-K, 2010 p.51).
Strategic Mapping
In order to analyze current market position of the five main
rivals in the PC industry, strategic group mappings are
presented in Figures 9, 10, and 11. The figures represent the
competitive characteristics that separate the major rivals in the
industry such as price, quality, support, inventory levels, and
product-line breadth.
According to Fig. 9, the PC rivals product line breadth has an
inverse relationship with the product price, quality, and support.
While Apple has a narrow product line relative to rivals, this is
not necessarily “the best place to be” for all companies. Apple
has adopted a narrow product-line. Their position on the
strategic map is clearly favorable for them, because their
narrow product-line along with high quality products and
excellent customer support, allows them to charge premium
prices for niche products.
Fig. 10 reveals the inverse relationship between PC makers
inventory turnover ratio and the product price, quality, and
support. Apple’s high inventory turnover along with its high
profit margin reveals two competitive advantages that Apple can
use to win market share over rivals.
Lastly, Fig. 11 shows the inverse relationship between the PC
maker’s profit margin ratio and the total asset turnover ratio
(TATO). Analysis demonstrates that there is not “best place to
be” on the strategic map. It depends on the specific company
strategy. Nonetheless, a company that has a high PM along with
a low TATO, ultimately have a so called “consumer advantage”.
For Apple, this comes from their strong brand name as well as
their ability to take advantage of economies of scale (Meier,
2010).
FIGURE 9
FIGURE 10
FIGURE 11
Summary of the industry and the overall attractiveness
The current state of the competitive environment in the PC
industry was assessed with Porter’s five forces. Conclusively,
there is an opportunity to make profit in the PC industry, mainly
because entry barriers are relatively high and the lack of any
real threatening substitute products. A cause of concern is the
strong rivalry, moderate bargaining power of customers, and the
moderate/high bargaining power of suppliers working as
barriers for industry members to make profit.
Product innovation, technological change, and changes in who
buys the products and who use it, are all driving forces that can
alter the industry landscape in the near future. Players in the
industry that successfully incorporate product innovation
strategies have the opportunity to realize large profits and gain
market share. Technology development in the PC industry will
benefit large players that have the capabilities to take advantage
of economies of scale and experience curve effect. Changes in
buyers demographics puts a tremendous pressure on PC makers
to adapt to market demand, but success in doing so will most
likely result in large profits. Overall, successful adaption to
future changes in the PC industry will positively favor the
industry profitability.
The PC industry clearly has tremendous growth potential,
mainly because our whole lives is dependent on technology and
computers. Past evidence shows that worldwide PC unit
shipments have growing steadily from FY2000 and is expected
to grow even more up until FY2015 (Fig. 4).
Mounting competition between large players in the industry will
inevitably squeeze industry profitability. Even though there is a
relatively balanced segmentation of market positions and
rivalries, Apple and HP currently have the largest market
shares. This competitive position among rivals in the industry
may inevitably result in plenty of opportunity for profitability
for the top rivals, while the smaller rivals having to fight an
intense battle with stronger rivals, and this will inevitably hurt
their success.
Defining Strategy
Arenas
Apple offers a wide range of products such as Macintosh
desktops and laptops, software, iPod, iPhone, iPad, iTunes,
Apple TV, and iCloud (K10 p. 3). Apple’s main customers are
in the consumer, small to medium businesses, education,
enterprise and government market (10k p. 6). Apple has
business operations in the U.S., Asia, and Europe. As of July
2011, the company had 357 retail stores in ten countries.
However, Apple’s largest geographic market is the U.S., which
accounted for approximately 39% of sales, as of 2011. (10k p.
8)
Apple’s operating system, Mac OS X, contains highly
sophisticated core technologies such as Grand Central Dispatch,
OpenCL, and 64-Bit throughput. These are developed so that the
users can increase the speed and responsiveness while using
applications (Core Technologies, 2012).
Differentiators
Apple’s logo, the symbol of lust and knowledge, is one of the
most recognized brand symbols in the world. Apple’s
unmatchable aesthetics as well as premium quality and
reliability, allow them to charge premium prices due to the
quality of the products. According to PC World’s “Reliability
and Service Survey,” Apple “smoked” its competitors when it
came to quality and reliability (Mick, 2010 para. 1-3).
Vehicle
On top of Apple’s internal development team that strives to
create value for the customer, they have established many
acquisitions in eight countries, as well multiple licensing
agreements to many entities worldwide.
Staging
Apple opened their first retail outlet in 2001, located in
Virginia. While pundits projected failure of Apple’s retail
expansion, the company had 10 years of aggressive expansion,
opening location after location. In the end of March 2011,
Apple had openef 323 retail stores around the world, and they
planned to open another 40 stores by the end of September
(Zibreg, 2011 para. 1-2).
Economic logic
Due to Apple’s extraordinary innovative approach to aesthetics,
they have the advantage to charge customer premium prices due
to unmatchable services and proprietary product features.
Apple’s Strategy
With an aggressive approach of retail expansion, as well as its
own internal development team, acquisitions, and licensing
agreements worldwide, Apple strives to add value to its
customer’s throughout the globe. The company’s unmatchable
aesthetics, premium quality and reliability, superior ease-of-use,
and seamless integration, allow them to charge premium prices
for high quality, differentiated products. Apple’s successful
innovative approach, as well as its operating system, hardware,
and software, has established one of the most recognized brand
symbols in the world.
SWOT analysis
Strengths
1. Brand Recognition & Customer Loyalty
According to Brand Finance, a consulting company that value
brands names of large corporations, Apple’s logo rated second
in the world, after Google. Apple’s logo was valued in 2011, to
$39.3 billion. This was a 33% increase from the previous year,
as well as the first year they beat corporate giants such as
Microsoft, IBM, Wal-Mart, and General Electric (Elmer-
DeWitt, 2011). Apple’s brand loyalty among users is
extraordinary. When Apple has any issues with its products,
users are very patient and forgiving, and keep buying their
products.
2. Design and Innovation
Apple’s aesthetic product design, ease of use, and reliability has
allowed them to maintain tremendous customer loyalty all over
the globe. Even though Apple’s product design is consistent,
their portfolio is not. Innovation has allowed Apple to offer
customers a variety of ways to utilize their products, such as the
iPad, iPod, and MacBook Air.
3. Marketing
Apple and advertising go hand in hand. Their first significant ad
campaign was the “1984” Super Bowl commercial, marking the
beginning of two decades of an extremely successful marketing
career. The very successful “Think Different” ad campaign that
was debuted in 1997 came to be remarkably popular (Hormby,
2009 para. 28). Ultimately, Apple’s success in marketing their
products has been a major reason for their successful earnings
history.
4. Research and Development (R&D)
As illustrated by Figure 11, Apple’s R&D budget is
significantly more effective than its rivals, with less than 10%
of net income devoted to R&D. Hence, Apple have not spared
expenses on its R&D (see Figure 12). The following thesis is
still valid: “Apple develops market-dominating products on a
bargain-basement R&D budget” (Apple’s Research and
Development Advantage, 2011 para. 2).
FIGURE 11. R&D as a Percentage of Net Income
FIGURE 12. Research & Development Dollars
5. Retail Location
Between 2009 and 2010, Apple’s retail sales increased by $3.1
billion or 47%, and $4.3 billion or 44% the following year. In
the end of 2009, 2010, and 2011, Apple owned 273, 317, and
357 retail stores, respectively. The vast majority of stores are in
the U.S. (Apple Inc., Form 10-K, 2011 p.34). This illustrates
Apple’s magical retail store success and according to
RetailSales, Apple ranked number one in sales per square feet
as it generates, annually, more than $5,626 per square foot
(Reisinger, 2011)
Weaknesses
1. Ultimate Control
Apple is in complete control over operations, supply chain and
manufacturing activities. It can be argued that this is the secret
behind their overall success. On the other hand, the fact they
only offer their own OS on their own devices, can be seen as a
significant weakness, particularly in the mobile phone market.
The Android OS works on many various devices, and this is the
main reason why Android are ahead of the iPhone, as far as
sales goes.
2. Yearly Upgrades
Apple recently announced that they are moving OS X to a
yearly release cycle. Some might argue that this is on of
Apple’s strengths, because it poses a great opportunity to
introduce new features for consumers. However, it is more than
likely to create problems and dissatisfaction among consumers,
especially large-scale buyers such as businesses and schools
(Faas, 2012). When a relatively expensive product becomes
obsolete after only 12 months, many consumers become
unsatisfied, and one can only speculate on whether consumers
will be loyal enough to pay for pricy Mac system upgrades.
Albeit, to date Apple has done an excellent job of pricing OS
upgrades.
3. Higher Prices & Less Market Share than Rivals
Apple is known for charging premium prices for niche product
designs. This could be seen as a weakness due to the limited
market segmentation that they can target. Also, as illustrated in
Fig 6, Apple has a larger market share than its four largest
rivals, when including the iPad as a PC. However, when we take
away the iPad out of the calculation, Apple’s PC market share is
far below all four rivals. This phenomenon tells us that Apple’s
PC sales are significantly dependable upon one product, the
iPad. Hence, it can be seen as an internal weakness.
4. Little Sales to Businesses
According to IDC, Mac sales in the last quarter of 2010 were
seven times as much as the overall PC market. This is also the
19th quarter that Mac has surpassed the whole market. Hence,
their biggest increase came from business and government sales.
For the last quarter in 2010, business sales grew 65.4% and
government sales grew 549.5%. Even though this arguably is a
very large number, compared to the overall market, there is a
drawback that is easily overlooked. Government sales are still
only 1% of the overall total sales of the Mac, while business
accounts for as little as 3% (Foresman, 2010 para. 1-2). This
small-scale sale to business and government can be seen as an
internal weakness of Apple’s ability to efficiently sell their
product to vital enterprises.
Opportunities
1. International Sales and Growth rate of PC industry
As of FY2011, 35% of Apple’s net sales were domestic.
However, the fastest growing market was Asia-Pacific, with a
growth rate of 174% from the previous year (Apple Inc., Form
10-K, 2011 p.30). This clearly indicates that Apple have the
opportunity to grow in other market segments worldwide.
2. Innovative Products
It is no question that Apple iPad is the driving force behind
tablet computers. As illustrated in Fig. 4, tablet computers are
projected to grow at double-digit growth rate at least until 2015.
This demonstrates the opportunities that lie behind an
innovative product strategy.
3. Increase Market Share
With a large enough scope of market share, a company has
monopoly power. Approximately 90% of all PC users worldwide
run Windows. Microsoft’s dominance in the software market
have allowed them to earn generous profits, primarily because
they have been able to hold about 90% of the market. As of
2011, Windows market share dropped below 90%, due to other
operating systems such as Apple’s OS X (Brodkin, 2011 para.
1). Clearly, there is an opportunity for successful companies to
win market share from rivals and realize larger returns.
4. Changing Demographics
In 2010, when the original iPad was released, things changed. It
suddenly became “cool” to use an iPad. According to J.
Thomas, “Apple totally flipped the demographics of the tablet
market almost overnight” (para, 11). Apple also made it
extremely easy to use the iPad, which in turn changes their
target market to an even younger generation. As of 2010, males
made up approximately 66% of the tablet market, and 62% were
younger than 34, while no more than 10% were over 65. As of
2011, 49% of all users are women and 30% of users were 55 and
older (Thomas, 2010).
Threats
1. EHS Liabilities
Foxconn has one of the most sophisticated manufacturing
system on earth, which has allowed Apple and many other
companies to increase the speed of manufacturing to a level that
could only be dreamed of. There has been some serious safety
problem and issues associated with this multi-billion dollar
corporation such as excessive overtime, underage workers,
improperly disposal of hazardous waste, serious work injuries,
and suicides among workers. These hazards also included the
well-known explosions that occurred at the Chengdu plant in
2011. According to the Chinese group that publishes the
warning for hazardous conditions inside the plant, Apple was
well aware of the situation but did not do anything to prevent it
from happening (Duhigg, 2012 para. 5-8). This could potentially
harm Apple’s reputation tremendously, and that can ultimately
have a negative effect on the company’s profit.
2. Competition in Technology
The fierce global competition over technology between the main
players in the PC industry can be seen as a threat for all players.
Even though there are not more suppliers than buyers, the
existing suppliers are enormous in size. They all have sizeable
resources to employ threatening competitive moves than can
come to affect other companies’ profitability negatively. Hence,
competition can be a threat for Apple.
3. Steve Jobs Death
The death of Apple’s founder Steve Jobs will possibly have a
negative effect on the company’s future. Steve Jobs reinvented
Apple and brought it back from the brink of insolvency in 1997.
He has been an integral part of the design of all the Apple
products over the last decade. Analysts speculate on the effect
this could have on rivals, and weather this will work as an
opportunity for competitors to catch up with Apple’s
technological superiority (Kim, M. et al, 2011 para. 1).
Key Resources & Competencies.
Apple’s resources, both tangible and intangible, have allowed
them to gain a competitive advantage in multiple areas.
· As of December 2011, Apple reported $138,681 million in
total assets and $25,922 in net income.
· Apple undeniable influence in the technological world has
changes how people see technology, and the list of
technological advancement is endless. Some examples are Mac
OS X, the iPad, iPhone, and iTunes.
· Apple’s human resources (HR) team, with its diverse
employee base, has added enormous value to the company
throughout its history. Steve Jobs exceptional business approach
was evidently one of the most important, if not the most
important, resource they ever had.
· Apple’s retail locations, which are rare in the PC industry,
have added tremendous value to the company’s success. Even
though speculators were extremely pessimistic when the first
store opened, Apple has shown otherwise. Apple makes
approximately $5,626 per square foot of floor space in stores
annually, making them by far the most profitable retailer in the
U.S. Second to Apple was Tiffany & Co, with sales of $2,974
per square foot (Reisinger, 2011 para. 2-3).
· Innovative design and technology is definitely their most
significant core competence, and the reason why they are
realizing enormous returns, year after year. The “Think
Differently” advertising campaign illustrates this core
competence.
· Apple’s well-known reputation and brand loyalty is a key
resource that takes years to build up. This is evident when their
logo was valued, in 2011, to $39.3 billion.
Competitive Strength Assessment
Table 1 demonstrates a weighted competitive strength
assessment of Apple’s two closest rivals, Dell and HP.
TABLE 1.
Leadership and Corporate Culture
Apple’s solid corporate result driven culture and leadership
have clearly promoted successful strategy implementation and
execution. Many would agree that the legend, Steve Jobs, is the
primary reason for the Apple’s success. According to Denny
Strigl, Steve Jobs “created, lived and drove Apple’s culture”
(para.2). All managers of Apple clearly want to improve their
customer’s existence, and they also “live” the company’s
culture (Strigl, 2011). Steve Jobs’ description of Apple’s
corporate culture was “that of a startup” (Merchant, 2010,
para.1). It is mimicking the entrepreneurship and innovation
characteristics of any new business, as well as the superior
products, velocity, and growth. What Jobs did to Apple right
before its potential collapse in the end the 1990’s, was
something historical. He gave all focus on establishing a high-
performance culture. This was done in three ways. First, Jobs
changed Apple’s strategy to a “one-thing” strategy, which
meant that he got rid of certain business segments, even profit
generating ones. Jobs also encouraged more debates when
developing new ideas, at the same time as eliminating any
earlier passive-aggressiveness. Finally, he imposed cohesion in
all operational stages throughout the company, from concept to
product to sales (Golson, 2011).
Financial Analysis
One of the most accurate tools to evaluate how well a
company’s strategy is working, is by analyzing the company’s
financial statements and comparing the numbers with
benchmarks. This does not only allow us to see if the company
has achieved strategic success, but it let us see whether the
company has successfully accomplished the corporations
primary goal to maximize shareholders wealth. A detailed ratio
analysis will be presented, containing Apple’s finances between
FY2008-FY2010. Three benchmarks, Dell, HP, and Lenovo, will
be used to evaluate whether Apple is above or below close
rivals in the PC industry. All graphs related to the financial
analysis are in Appendix A.
Profitability & Leverage Ratios
In order to see how Apple is performing in terms of its ability
to generate profit, a number of profitability ratios are assessed
and evaluated. As shown in Figure 13, Apple had a gross profit
margin of 39%, 40%, and 35% for 2008, 2009, and 2010,
respectively. This figure was almost double its closest rival,
HP, for all three years. Figure 14 reveals Apple’s operating
profit margin, and it is significantly higher than its rivals, with
a positive trend line from 2008 to 2010. This indicated that
Apple has a favorable position when it comes to paying off their
fixed costs. The company’s profit margin (PM) (Figure 15) from
2008-2010 is also significantly higher than all of the
benchmarks. It is worth mentioning here that one reason for
Apple’s high profit margin is because they have no long-term
debt, and therefore no interest expense. The profitability of the
entire enterprise, measured by the PM also shows a positive
trend line from 2008-2010. This indicated that Apple’s overall
operations are efficient relative to the benchmarks.
Return on Asset (ROA) (Fig 16), shows how efficient
management is at using its assets to generate earnings. Apple’s
ROA is also here showing a positive trend from 2008-2010, and
relative to its rivals, Apple’s management team have efficiently
succeeded to allocate its resources.
Apple’s return on equity (ROE) (Fig 17), which indicates the
company’s return on the owners’ investment, was 42%, 26%,
and 29% in 2008, 2009, and 2010, respectively. Relative to its
rivals, Apple is outperforming all of them in 2010, but comes
only at second place, after Dell, in 2008 and 2009. Also, there
is no specific trend that can be seen over the three years. A
more extensive analysis needs to be made in order to see why
Apple is showing this relative inefficiency and inconsistency in
its ROE.
In order to do so, a so-called DuPont analysis is executed. It is
an expression that breaks down ROE into three components,
PM, total asset turnover (TATO), and equity multiplier (EM).
As already established, Apple’s PM is well above its
benchmarks, and this indicates the company’s efficiency in
generating profits, therefore it is not the cause to the firm’s low
ROE. As illustrated by Figure 18, Apple’s TATO is below all of
its benchmark companies. This ratio demonstrates how many
times the profit margin is earned each year, and Apple’s
relatively low TATO indicates that the firm may have an asset
management problem and are not utilizing its assets as
efficiently as its benchmarks. Finally, Apples EM (Fig 19) is
also lower than its benchmarks for all three years, and there is
no clear trend line going in any one direction.
This relatively low EM indicates lower financial leverage, and
this once again has to do with Apple’s lack of interest expense.
Other financial ratios that further prove Apple’s unleveraged
approach are their debt-to-equity ratio (Fig.20) as well as their
debt-to-asset ratio (Fig.21). This approach eliminates the firm’s
risk of going bankrupt.
Conclusively, there are mainly two reasons why Apple has a
lower ROE in comparison to Dell: a low TATO ratio as well as
a low EM. Hence, this does not necessarily need to be seen as a
negative thing, because of primarily two reasons. First, a
company that has a high PM along with a low TATO, ultimately
have a so called “consumer advantage”. For Apple, this
consumer advantage can come from a number of different
sources. One is their strong brand name, which in turn allows
them to charge premium prices for niche products. This
consumer advantage also comes from the company’s ability to
take advantage of economies of scale (Meier, 2010). The second
reason to why Apple’s ROE is low, but not necessarily bad, is
because their low EM will inevitably push down their ROE.
Hence, a low EM simply means that the company does not use
much debt to finance its operations, which in turn means that
the company is operating with less risk of going into default.
Liquidity Ratios
In order to appraise Apple’s ability to pay off short-term debt
obligations, three liquidity ratios will be evaluated: current
ratio (Fig. 22), quick ratio (Fig. 23), as well as its working
capital (Fig. 24).
Apple’s current and quick ratios are well above its benchmarks,
in all three years. As for both ratios, the values went up slightly
from 2008-2009, but fell 0.7x the following year. Hence, even
with this latter decrease, Apple’s ability to meet creditor’s
demands is still significantly larger than the benchmarks. As
shown by Figure 24, Apple’s working capital has been stable
between 2008-2010, and drastically higher than its benchmark
companies. This further supports proof that Apple clearly has
the ability to pay off short-term creditors. Overall, Apple does
not seem to have any problem when it comes to their ability in
paying off short-term obligations.
Activity Ratios
The final class of financial metrics that will be analyzed is
activity ratios, which illustrates a company’s ability to convert
its balance sheets accounts into sales. Days of inventory (Fig.
25), inventory turnover ratio (Fig. 26), and average collection
period (Fig. 27) are some of those ratios.
Days of inventory ratio estimates how long it takes for the firm
to turn its inventory into cash. Apple and Dell have
significantly lower measures than HP and Lenovo. Hence, Apple
lacks a preferably negative trend between 2008-2010. The
second metric, inventory turnover ratio, shows how many times
the company’s inventory is sold and replaced over the year.
Apple’s relatively high inventory turnover in comparison to its
benchmarks implies strong sales and healthy inventory levels.
Hence, even though there was a dip of approximately 32% from
2009-2010, it does not imply ineffective buying because the
benchmarks ratios overall trend was the same as Apple’s. The
average collection period ratio shows whether the company is
effective in collecting payments from customers, in terms of
account receivables. As illustrated in Figure 28, Apple’s
average collection period was the same in 2008 and 2009, but
increased by 0.03x the following year. Hence, in 2010, Apple
had the largest collection period in comparison to its rivals.
This implies that Apple may take too long to turn its receivables
into cash.
Overall, Apple’s ability to convert its balance sheets accounts
into sales are relatively weak in comparison to its benchmarks,
due to their days of inventory negative trend between 2008-
2010 as well as their relatively high average collection period.
Recommendations
Even though Apple are financially preforming above average in
the PC industry, proven by the financial analysis, it does not
mean there is no room for improvements. Ultimately, there is no
need for radical changes in the company’s strategic approach,
but a number of recommendations will be given in regards to
their operations in order for them to further keep improving and
prospering as one of the most successful companies in the world
and for to secure their strategic success.
Aggressive Expansion Outside the U.S.
Between 2010 and 2011, Apple’s sales in Europe, Japan, and
Asia-Pacific grew 49%, 37%, and 175%, respectively. Retail net
sales grew 44% (Apple Inc., Form 10-K, 2011 p.30).
According to these historical sales figures, Apple could earn
large revenues by expanding their already established retail
segment and operations outside the U.S. As of 2010,
approximately only 28% of Apple’s retail stores are located
outside the U.S. Apple would be able to earn even more revenue
if they aggressively expanded their already established retail
base in emerging markets such as China and India.
Elimination of Product Bottlenecks
One of Apple’s weaknesses is the fact that they have actually
less market share than rivals, if the iPad were taken out of the
equation. This could be improved by taking advantage of
opportunities in the external environment. The opportunity
being the changing customer expectations philosophy of “access
everything, everywhere”. Recognizing and removing current
bottlenecks throughout the product line could achieve this
(Figure 28). One example of a product that seems to negatively
affect Apple’s sales is the iPod. The iPods net sale decreased by
12% between 2008-2009 and increased only 2% the following
year (Apple 10-k, 2010). Hence, redirecting resources, such as
R&D, from the bottlenecks to more efficiently revenue
generating innovations, such as the iPad, could potentially
result in larger overall profits and therefore increase the
company’s market share.
FIGURE 28
Apple’s Revenue Mix
Source: Apple Business Model Is Iconic And Sustainable.
(2011)
Seeking Alpha
Decrease Marketing Spending
Apple has and always will be subject to external competitive
threats. The company’s ability to remain successful is heavily
depended on their ability in continuing to innovate new
technologies and products. In order to do so, Apple needs to
take advantage of its already established internal strengths,
more specifically their core competence in innovation as well as
their well established brand recognition and well known
marketing capabilities. The company did spend $486, $501, and
$691 million on advertising alone in 2008, 2009, and 2010,
respectively. R&D for the same years was, $1,333, $1,782, and
$2,429, respectively. Hence, efficiency could be improved by
cutting costs in advertising at the same time as further increase
spending in R&D, in an attempt to further secure their
innovative competence. Apple’s brand name is already so
incredibly strong that a cut in spending on that front would not
hurt the company’s revenue by any significant amount.
Aggressive sales to business segment
Apple could take advantage of the opportunity of growth rate in
the PC industry, to improve their relatively low sales figures to
enterprises such as businesses and government. As of the last
quarter in 2010, Apple’s Mac sales to businesses was only 3%
(a 64.5% increase from the previous quarter) of their net sales,
and as little as 1% (549.5% increase from the previous quarter)
to government. Also, this was the 19th quarter that Mac sales
have outgrown the overall market. Clearly, there is a potential
for Mac sales increase, nonetheless to business and government,
but the current percentages of sales to these entities are very
small. Conclusively, if Apple were to aggressively promote
their product to the business segment and the government, they
could increase revenue significantly. This was a 66% increase
from the previous year, as well as the highest figure since 1997
(Evans, 2011 para. 2).
Appendix A: Financial Ratios
Profitability Ratios
FIGURE 13
FIGURE 14
FIGURE 15
FIGURE 16
FIGURE 17
FIGURE 18
FIGURE 19
FIGURE 20
FIGURE 21
FIGURE 22
FIGURE 23
FIGURE 24
FIGURE 25
FIGURE 26
FIGURE 27
References
Hamilton, D. (2011, January 13). Top 10 company mission
statements in 2012. Retrieved from
http://drdianehamilton.wordpress.com/2011/01/13/top-10-
company-mission-statements-in-2011/
Huzefa., Deepti, A.N., Gaurav, D., Vinay., &Singh, H. (2009).
A strategic analysis of Apple Corporation.Retrieved from
http://www.scribd.com/doc/11983566/A-Strategic-Analysis-of-
Apple-Corporation
Powell, K. Tech Tip 90 - An insanely great thirty years of
innovation: A brief history of Apple Computers. Retrieved
form http://www.geeks.com/techtips/2006/techtips-10aug06.htm
Thompson Jr, A. A., Strickland III, A. J., Gamble, J.E., 2010,
Crafting and executing strategy, New York, NY, McGraw-Hill
Irvin.
Jade, C. (2011, May). The Apple store at 10: Past, present,
and future. Retrieved from http://gigaom.com/apple/the-apple-
store-at-10-past-present-and-future/
Worldwide PC market (2010). eTForecasts. Retrieved from
http://www.etforecasts.com/products/ES_pcww1203.htm
Nusca, A. (Dec. 2008). Lenovo: PC industry consolidation
coming, acquisitions possible. Zdnet. Retrieved from
http://www.zdnet.com/blog/gadgetreviews/lenovo-pc-industry-
consolidation-coming-acquisitions-possible/615
Vance, A. (July 2009). Acer’s chief urges more consolidation of
the PC industry. The New York Times. Retrieved from
http://bits.blogs.nytimes.com/2009/07/07/acers-ceo-urges-more-
consolidation-of-the-pc-industry/
(October 2011). Consumer PC market weak, vendor
consolidation underway. TechJournal. Retrieved from
http://www.techjournalsouth.com/2011/10/consumer-pc-market-
weak-vendor-consolidation-underway/
(2011). PC unit market share in U.S., Q2 201, Gartner: Apple
Now 3rd Largest PC Vendor in the U.S. Gartner. Retrieved from
http://news.softpedia.com/newsImage/Gartner-Apple-Now-3rd-
Largest-PC-Vendor-in-the-U-S-2.png/
Elmer-DeWitt, P. (Jan. 2012). Snapshot of the computer market,
with and without iPad. CNNMoney. Retrieved from
http://tech.fortune.cnn.com/2012/01/13/snapshot-of-computer-
market-with-and-without-the-ipad/
(2011). Market Environment of HP Company , Dell Inc., IBM
Corporation, Apple Inc., Oracle Corp. Retrieved from
http://dineshperspective.blogspot.com/2011/06/v-
behaviorurldefaultvmlo.html
Welker, J. (Jan. 2009). Product differentiation in imperfectly
competitive markets – the MacBook Wheel. Retrieved from
http://welkerswikinomics.com/blog/2009/01/28/product-
differentiation-in-imperfectly-competitive-markets-the-
macbook-wheel/
The Economist. The dream of the personal computer: The PC’s
25th birthday. 380(8488) July 29-August 4, 2006:17.
Tung, L. (May, 2011). Tablet product differentiation easier than
PCs. CRN. Retrieved from
http://www.crn.com.au/News/258386,hp-exec-bets-touchpad-
will-topple-ipad.aspxRen, Wengjian. (Jan. 2012). Wengjian
Ren: Acer strive to become the first brand of ultra-extreme.
Aicuxiao.org. Retrieved from
http://www.aicuxiao.org/wengjian-ren-acer-strive-to-become-
the-first-brand-of-ultra-extreme/
Dell. (July, 2011). Dell Efficient IT
Solution
s Growth Strategy Driving Its Stronger Financial Performance.
Dell. Retrieved from
http://content.dell.com/us/en/corp/d/secure/2011-0715-
annualmtg-release
HP enterprise services. (Jan. 2010). The New Edge:
Differentiation Through Superior Customer Service. HP Inc.
Retrieved from http://h10134.www1.hp.com/news/features/the-
new-edge/
Simister, Paul. (Oct. 2011). Bargaining Power Of Suppliers :
Uses & Abuses. Differentiate your business. Retrieved from
http://www.differentiateyourbusiness.co.uk/bargaining-power-
of-suppliers-uses-abuses
GfxS, Staff. (Aug. 2011). JPR: Graphics shipments up 6.3% in
second quarter; Intel increases market share. Graphic Speak.
Retrieved from http://gfxspeak.com/2011/08/05/jpr-graphics-
shipments-up-6-3-in-second-quarter-intel-increases-market-
share/
Keaton, Kit. (May, 2011). Apple Takes A Bite Out Of
Microsoft's PC Market Share, Browser Use. Fast Company.
Retrieved from
http://www.fastcompany.com/1751059/microsoft-slipping-pc-
market-share-browser-use-being-munched-by-apple
Arthur, Charles. (Oct. 2011) HP, Lenovo and Apple benefit as
PC sales inch ahead in third quarter. The Guardian. Retrieved
from http://www.guardian.co.uk/technology/2011/oct/15/hp-
lenovo-apple-pc-sales-quarterly
Garg, S. (2011). Feasibility of notebooks against desktops.
Retrieved from
http://www.scribd.com/doc/66696979/40/Product-
Differentiation-Wider-Quality-Spectrum
Dedrick, J., Kraemer, K. L. (May 2008). Globalization of
Innovation: The Personal Computing Industry. Retrieved from
web.mit.edu/is08/pdf/Globalization%20of%20Innovation%20PC
.PDF
Bayus, B. L., (1998). An analysis of product lifetimes: a
technologically dynamic industry. Retrieved from
http://www.jstor.org/pss/2634645
Hughes, N. (May 2011). Apple makes huge inroads in enterprise
as corporate Mac sales surge 66%. Apple Insider. Retrieved
from
http://www.appleinsider.com/articles/11/05/20/apple_makes_hu
ge_inroads_in_enterprise_as_corporate_mac_sales_surge_66.ht
ml
Barakat, M. (March 2008). Bill Gates: Expect 'rapid advance' in
technology. USA TODAY. Retrieved from
http://www.usatoday.com/tech/news/techinnovations/2008-03-
13-gates-tech-advances_N.htm
Bailom, F., Matzler, K., Tschemernjak. D. (Nov 2007).
Enduring Success: What Top Companies Do Differently. Google
Books. Retrieved form
http://books.google.com/books?id=Mns04Ys5YwgC&pg=PA48
&lpg=PA48&dq=experience+curve+effects+in+PC&source=bl&
ots=xjj00C_k2I&sig=Lgom4WTujg1NnT3Njn7HO2gYWVw&hl
=en&sa=X&ei=reEpT5O5EaqZiALX5p3TCg&ved=0CEsQ6AEw
Bg#v=onepage&q=experience%20curve%20effects%20in%20PC
&f=false
Dignan, L. (Oct. 2011). Apple's R&D spending hits bottom as
percentage of revenue. ZD Net. Retrieved from
http://www.zdnet.com/blog/btl/apples-r-d-spending-hits-bottom-
as-percentage-of-revenue/60872
Bauys, L. (Jun. 1998). An analysis of product lifetimes in a
technologically dynamic industry. JSTOR. Retrieved from
http://www.jstor.org/pss/2634645
29
Hruska, Joeal. (2008). 2009 to be a nightmare for PC industry,
says analyst. Ars Technica. Retrieved from
http://arstechnica.com/business/news/2009/03/2009-to-be-a-
nightmare-for-pc-industry-says-analyst.arsChaneta, I. Role of
situation analysis in strategy-making. Journal of Comprehensive
Research, Volume 6, Page 39. Retrieved from
jupapadoc.startlogic.com/compresearch/papers/JCR08-
5.pdfKanter, D. (2011). State of the PC 2011: an Technology
Change Our Life Quarterly Report. Tech Life. Retrieved from
http://www.917wy.com/business/news/2011/03/state-of-the-pc-
2011-an-ars-technica-quarterly-report.arsThompson, A. A.,
Strickland III, A. J., Gamble, J. E. (2010). Crafting and
executing strategy: The quest for competitive advantage. New
York, NY: McGraw-Hill/Irwin.
Dexter, A. (Noc. 2011). 10 ways PCs will change over the next
25 years. Techradar. Retrieved from
http://www.techradar.com/news/computing/10-ways-pcs-will-
change-over-the-next-25-years-1040168Schroeder, Stan. (April
2010). Gartner: Most Kids Will Use PCs With Touchscreens by
2015. Mashable Tech. Retrieved from
http://mashable.com/2010/04/07/50-percent-pcs-touchscreens/
Chan, C. (Jan. 2012). Why Apple Doesn’t Make the iPhone in
America. Gizmodo. Retrieved from
http://gizmodo.com/5878209/why-apple-doesnt-make-the-
iphone-in-america
Kingsley, H. A. (Jan. 2012). The PC industry is heading for
collapse. ZD Net. Retrieved from
http://www.zdnet.com/blog/hardware/the-pc-industry-is-
heading-for-collapse/17828
Dilger, E. D. (Oct. 2010). Apple's 2010 ad budget increases by
$190 million, but still outpaced by new sales growth. Apple
Insider. Retrieved form
http://www.appleinsider.com/articles/10/10/27/apples_2010_ad_
budget_increases_by_190_million_but_still_outpaced_by_new_
sales_growth.html
Mick, J. (Nov. 2010). Survey: Apple "Smokes the Competition"
in Quality, Reliability. Daily Tech. Retrieved form
http://www.dailytech.com/Survey+Apple+Smokes+the+Competi
tion+in+Quality+Reliability/article20280.htm
Zibreg, C. (May. 2011). Feature: Retail stores, Apple's risky
gamble that paid off big time. 9TO5Mac: Apple Intelligence.
Retrieved form http://9to5mac.com/2011/05/19/feature-retail-
stores-apples-big-gamble-that-paid-off-big-time/
Figure 4. Impressive Growth Continues for Tablet Computers:
Average Annual Growth of 81% Forecast From 2010 Through
2015. (2012, January 13). Electronics.ca Publications. Retrieved
form
http://www.electronics.ca/presscenter/articles/1650/1/Impressiv
e-Growth-Continues-for-Tablet-Computers-Average-Annual-
Growth-of-81-Forecast-From-2010-Through-2015/Page1.html
Fish, Russell. (2011, January 7). World Domination Through
Vertical Integration. Venray Technology Ltd. Retrieved form
https://www.venraytechnology.com/PaperWorld_Domination_V
ertical_Integration.htm
Chen, B. X. (2011, February 18). Why Nobody Can Match the
iPad’s Price. Gadget Lab. Retrieved form
http://www.wired.com/gadgetlab/2011/02/ipad-price/
Takahashi, Dean. (2011, August 18). With HP’s PC spinoff,
vertical integration falls out of favor. Spotfire. Retrieved from
http://venturebeat.com/2011/08/18/with-hps-pc-spinoff-vertical-
integration-falls-out-of-favor/
Apple Inc, Form 10-K. (2010). Retrieved from
http://sec.gov/Archives/edgar/data/320193/00011931251023804
4/d10k.htm
Dell, Form 10-K. (2010). Retrieved
fromhttp://content.dell.com/us/en/corp/d/corporate~financials~e
n/Documents~fy10-year-in-
review~FY10_Form10K_Final.pdf.aspx
HP, Form 10-K. (2010). Retrieved from
http://h30261.www3.hp.com/phoenix.zhtml?c=71087&p=irol-
reportsAnnual
Lenovo Inc, Form 10-K. (2010). Retrieved from
http://www.lenovo.com/ww/lenovo/annual_interim_report.html
Acer, Form 10-K. (2010). Retrieved from
http://quicktake.morningstar.com/stocknet/secdocuments.aspx?s
ymbol=acid&country=gbr
About Lenovo. (2012). Retrieved from
http://www.lenovo.com/lenovo/us/en/our_company.html
About Acer. (2012). Acer Inc. Retrieved from
http://us.acer.com/ac/en/US/content/company
Core Technologies. (2012). Apple. Retrieved from
https://developer.apple.com/technologies/mac/core.html
Apple Inc, Form 10-K. (2011). Retrieved form
http://investor.apple.com/secfiling.cfm?filingID=1193125-11-
282113&CIK=320193
Elmer-DeWitt, Philip. (2011, September 15). Apple's brand
value rises to No. 2 in the world, after Google. CNN Money.
Retrieved from http://tech.fortune.cnn.com/2011/09/15/apples-
brand-value-rises-to-no-2-in-the-world-after-google/
Duhigg, C., Barboza, D. (2012, January 25). In China, Human
Costs Are Built Into an iPad. The New York Times. Retrieved
from http://www.nytimes.com/2012/01/26/business/ieconomy-
apples-ipad-and-the-human-costs-for-workers-in-
china.html?pagewanted=all
Faas, Ryan. (2012, February 17). Apple’s New Annual Upgrade
Cycle May Wreak Havoc On Schools. Cult of Mac. Retrieved
from http://www.cultofmac.com/147273/apples-new-annual-
upgrade-cycle-may-wreak-havoc-on-schools/
Brodkin, Jon. (2011, Februaty 2). Windows drops below 90%
market share. NETWORKWORLD. Retrieved from
http://www.networkworld.com/community/blog/windows-drops-
below-90-market-share
Reisinger, Don. (2011, August 24). Another Apple win: Retail
sales per square foot. CNet News. Retrieved from
http://news.cnet.com/8301-13506_3-20096519-17/another-
apple-win-retail-sales-per-square-foot/Read more:
http://news.cnet.com/8301-13506_3-20096519-17/another-
apple-win-retail-sales-per-square-foot/#ixzz1ml0oIWWf
Apple's Research And Development Advantage. (2011,
November 21). Seeking Alpha. Retrieved from
http://seekingalpha.com/article/309448-apple-s-research-and-
development-advantage
Kim, M., Jin. H. (2011, October 6). Without Jobs, Apple’s gap
with rivals could narrow. Al Arabiya News. Retrieved from
http://www.alarabiya.net/articles/2011/10/06/170466.html
Berndt, T. J. (2002). Friendship quality and social development.
Current Directions in Psychological Science, 11, 7-10.
Strigl, D. (2011, October 12). The Apple Way: The Legacy of
Steve Jobs’ Culture-Driven Organization. Managers, can you
hear me now? Retrieved from
http://managerscanyouhearmenow.wordpress.com/2011/10/12/th
e-apple-way-the-legacy-of-steve-jobs%E2%80%99-culture-
driven-organization/
Golson, J. (2011, September 11). Steve Jobs: Apple Almost
Went Bankrupt Because It Failed to Innovate. MacRumors.
Retrieved from http://www.macrumors.com/2011/09/19/steve-
jobs-apple-almost-went-bankrupt-because-it-failed-to-innovate/
Meier, D. (2010, August 18). Here’s How Apple Creates Its
Advantage. The Motley Fool. Retrieved form
http://www.fool.com/investing/general/2010/08/18/heres-how-
apple-creates-its-advantage.aspx
Thomas, J. (2011, December 17). How Apple Reinvented the
Tablet and the Changing Demographic of the iPad. Nexttag
News. Retrieved from
http://nextagnews.nextag.com/2011/12/17/how-apple-
reinvented-the-tablet-and-the-changing-demographic-of-the-
ipad/
Thormby, T. (2007, September 4). 'Think Different': The Ad
Campaign that Restored Apple's Reputation. Low End Mac.
Retrieved from http://lowendmac.com/orchard/07/apple-think-
different.html
Apple Business Model Is Iconic And Sustainable. (2011).
Seeking Alpha. Retrieved from
http://seekingalpha.com/article/298572-apple-business-model-
is-iconic-and-sustainable
Evans, J. (2011, May 23). Apple's Mac steals Windows
enterprise sales. Computerworld. Retrieved from
http://blogs.computerworld.com/18330/apples_mac_steals_wind
ows_enterprise_sales
Foresman, C. (2010). IDC: Big business giving Apple major
sales boost. Ars Technica. Retrieved from
http://arstechnica.com/apple/news/2011/02/apple-outgrows-pc-
market-for-nearly-five-years-aided-by-enterprise.ars
Gross Profit Margin
Apple2010.02009.02008.00.3937753928708320.4013984384104
420.352004481075459Dell2010.02009.02008.00.175059544062
6060.1793260339437980.19091161892922HP2010.02009.02008
.00.2375885680734410.2359452475731550.244246561454496L
enovo2010.02009.02008.00.1077988557663350.1206040268456
380.14983793040181
Operating Profit Margin
Apple2010.02009.02008.00.2818704484476810.2736277823097
540.222106638926676Dell2010.02009.02008.00.041057048882
840.0522086381564950.056270753929956HP2010.02009.02008
.00.09107932049542580.08848383266987920.08848129498834
1Lenovo2010.02009.02008.00.0131887985546522-
0.01288590604026850.0305180111308177
Profit Margin
Apple2010.02009.02008.00.2148409352242240.1919356718331
20.163212504334374Dell2010.02009.02008.00.0270878227666
2510.04055580105071930.0482063697184826HP2010.02009.02
008.00.06951354010457580.06686919477617150.07036767936
19682Lenovo2010.02009.02008.00.00776874435411021-
0.01516778523489930.0296617943856645
ROA
Apple2010.02009.02008.00.1863852200630460.1733647712679
730.154629536035581Dell2010.02009.02008.00.042582907405
20630.09350943396226420.106930333817126HP2010.02009.02
008.00.07279342666441780.06956506589778650.07639569049
95104Lenovo2010.02009.02008.00.0214381420276909-
0.02567200241618850.0634700315457414
ROE
Apple2010.02009.02008.00.2932142035111210.2602718078381
790.421070740434902Dell2010.02009.02008.00.254032972877
1490.5801919925076090.769451697127937HP2010.02009.0200
8.00.2148304357421350.1879109017760770.213882183760464
Lenovo2010.02009.02008.00.0803237858032378-
0.1725190839694660.221851145038168
TATO
Apple2010.02009.02008.00.8675498450447570.9032441422285
860.94741231173557Dell2010.02009.02008.01.5720313800071
312.3056981132075422.218178519593614HP2010.02009.02008
.01.0122888605093860.9978484133137061.044409737847544L
enovo2010.02009.02008.01.8540643144260832.2500755058894
62.063217665615144
Equity Multiplier
2010.02009.02008.01.5731623108953571.501295828065741.88
16928197812662010.02009.02008.05.965608934586076.204635
9166471457.195822454308094HP2010.02009.02008.03.078024
1785952682.8333539008317482.910251142725078Lenovo2010.
02009.02008.01.9346201743462042.3351145038167944.673899
566026027
Debt-to-Equity-Ratio
Apple2010.02009.02008.00.5731623108953560.5012958280657
40.881692819781265Dell2010.02009.02008.04.9656089345860
75.2046359166471456.195822454308094HP2010.02009.02008.
02.0780241785952681.8333539008317521.910251142725078Le
novo2010.02009.02008.04.5765877957658824.05110602593440
13.67389956602604
Debt-to-Asset-Ratio
Apple2010.02009.02008.00.3643376827208280.3339087598155
830.468563630850096Dell2010.02009.02008.00.832372518721
0270.8388301886792450.861030478955007HP2010.02009.0200
8.00.6751162622587410.6470613855521390.656387043262655
Lenovo2010.02009.02008.00.3459929192146780.404380516508
6630.786045894680993
Current Ratio
Apple2010.02009.02008.02.0112923462986192.7424821832087
522.461680386034628Dell2010.02009.02008.01.278744725738
3971.3561477892186561.072854830005397HP2010.02009.0200
8.01.0967754994635961.2217519707927350.977124615123067
Lenovo2010.02009.02008.01.5153846153846131.504469987228
6081.044739022369511
Quick Ratio
Apple2010.02009.02008.01.9605733037351612.7029375977750
762.425560601759864Dell2010.02009.02008.01.223312236286
921.2977993135473431.009174311926605HP2010.02009.02008
.00.9658927595490161.0792502848638480.828292940932015L
enovo2010.02009.02008.00.3884615384615380.9297573435504
470.947183098591549
Working Capital
Apple2010.02009.02008.020956.020049.020598.0Dell2010.020
09.02008.05285.05292.01350.0HP2010.02009.02008.04781.095
36.0-1211.0Lenovo2010.02009.02008.0402.0395.0216.0
Days of Inventory
Apple2010.02009.02008.09.701702030803476.46633960207141
7.646102559881465Dell2010.02009.02008.08.79024312000180
26.3109245373324638.707694796005014HP2010.02009.02008.
024.5615002757858825.5555047758329232.14875802088226Le
novo2010.02009.02008.021.6314546068174412.5352972601694
310.86802927075448
Inventory Turnover Ratio
Apple2010.02009.02008.037.6222645099904456.446153846153
9147.73673870333993Dell2010.02009.02008.041.52331113225
50557.8362168396770541.91694915254222HP2010.02009.0200
8.014.8606557377049314.2826370757180311.35347125269705
Lenovo2010.02009.02008.016.8735763097949929.11777777777
77933.58474576271185
Average Collection Period
Apple2010.02009.02008.00.1513035523707880.1168708111855
790.124260355029586Dell2010.02009.02008.00.109580040174
9680.07696938144665340.125050817139605HP2010.02009.020
08.00.1462127565309580.1439038610475390.14257679252752
1Lenovo2010.02009.02008.00.08297483646649770.0461155508
9741910.0676597272074659
KSF/Strength
Measure Importance
Weight Strength
Rating Score Strength
Rating Score
Technology
0.25 8 2.00 8 2.00 8 2.00
Skills
0.15 9 1.35 7 1.05 7 1.05
Effective
cost
control
0.25 10 2.50 2 0.50 5 1.25
Innovation 0.25 10 2.50 5 1.25 5 1.25
Marketing 0.10 10 1.00 6 0.60 6 0.60
Sum
of
importance
Weight 1.00
Weighted
overall
strength
rating 47 9.35 28 5.40 31 6.15
Dell HPApple
Inc.
Weighted
Competetive
Strength
Assessment
KSF/StrengthMeasureImportanceWeightStrengthRatingScoreStr
engthRatingScoreStrengthRatingScore
Technology 0.25 82.00 82.00 82.00
Skills 0.15 91.35 71.05 71.05
Effectivecostcontrol 0.25 102.50 20.50 51.25
Innovation 0.25 102.50 51.25 51.25
Marketing 0.10 101.00 60.60 60.60
SumofimportanceWeight 1.00
Weightedoverallstrengthrating 479.35 285.40 316.15
Dell HPAppleInc.
WeightedCompetetiveStrengthAssessment
ATT00001
ATT00002
Presentation Rubrics instructions .docx
Presentation Rubrics
Topic
Comments
Score
Basic Company Information
· Brief company history and information
· Hambrick Model
· Vision and mission
Please follow the same order when you do the power points
Vision is not found in power points
(20)
Industry and Competitive Analysis
· Industry Characteristics
· Porter’s 5 Forces
· Key Success Factors
· Driving Forces
· Identify Major Competitors (this should be on one of the
slides and it has to be 3)
· Strategic Map
· Summary of Industry Prospects
(45)
Strategic Position
· SWOT Analysis
· Competitive Strength Assessment
· Company Resources/Competencies
· Leadership and Corporate Culture
· Tie to Strategy Execution
· Financial Performance
· 3 Year Analysis
· Created own charts/graphs/maps
· Summary of Competitive Position
(45)
Group Recommendations
· Conclusions
· Recommendations
· Rigorous Arguments
· Stock Purchase
(20)
Please change the
presentation rubrics.pdf
Scan.pdf

Contenu connexe

Similaire à BA 490 Senior Seminar in BusinessDr. Lori D. Paris.docx

mba project report-on-apple-inc
mba project report-on-apple-inc mba project report-on-apple-inc
mba project report-on-apple-inc Home
 
Midterm
MidtermMidterm
Midtermsmehro
 
Please revise the answer bellow.Q1. What historically have been Ap.pdf
Please revise the answer bellow.Q1. What historically have been Ap.pdfPlease revise the answer bellow.Q1. What historically have been Ap.pdf
Please revise the answer bellow.Q1. What historically have been Ap.pdffathimalinks
 
Porter's five force analysis on computer industry
Porter's five force analysis on computer industryPorter's five force analysis on computer industry
Porter's five force analysis on computer industryRajath Menon
 
CASE 16 APPLE INC. STILL TAKING A BITE OUT OF THE COMPETIT.docx
CASE 16  APPLE INC. STILL TAKING A BITE OUT OF THE COMPETIT.docxCASE 16  APPLE INC. STILL TAKING A BITE OUT OF THE COMPETIT.docx
CASE 16 APPLE INC. STILL TAKING A BITE OUT OF THE COMPETIT.docxjasoninnes20
 
Computer Engineer.pdfComputer Engineer
Computer Engineer.pdfComputer EngineerComputer Engineer.pdfComputer Engineer
Computer Engineer.pdfComputer EngineerChristina Berger
 
Final project of apple inc. (riasat minhas)
Final project of apple inc. (riasat minhas)Final project of apple inc. (riasat minhas)
Final project of apple inc. (riasat minhas)Asad Ali Minhas
 
Apple Computer
Apple ComputerApple Computer
Apple ComputerEric Moon
 
Ukessays.com analysis of dell in macro environment
Ukessays.com analysis of dell in macro environmentUkessays.com analysis of dell in macro environment
Ukessays.com analysis of dell in macro environmentMai Ngoc Duc
 
Apple inc. document
Apple inc. document Apple inc. document
Apple inc. document AkramMad1
 
The PC Industry Wars
The PC Industry WarsThe PC Industry Wars
The PC Industry WarsAkash Jauhari
 
STEVE JOBS AND STRATEGIC FLEXIBILITY
STEVE JOBS AND STRATEGIC FLEXIBILITY STEVE JOBS AND STRATEGIC FLEXIBILITY
STEVE JOBS AND STRATEGIC FLEXIBILITY Samy Kaizer Badibanga
 

Similaire à BA 490 Senior Seminar in BusinessDr. Lori D. Paris.docx (17)

mba project report-on-apple-inc
mba project report-on-apple-inc mba project report-on-apple-inc
mba project report-on-apple-inc
 
Midterm
MidtermMidterm
Midterm
 
Please revise the answer bellow.Q1. What historically have been Ap.pdf
Please revise the answer bellow.Q1. What historically have been Ap.pdfPlease revise the answer bellow.Q1. What historically have been Ap.pdf
Please revise the answer bellow.Q1. What historically have been Ap.pdf
 
Porter's five force analysis on computer industry
Porter's five force analysis on computer industryPorter's five force analysis on computer industry
Porter's five force analysis on computer industry
 
Apple
AppleApple
Apple
 
CASE 16 APPLE INC. STILL TAKING A BITE OUT OF THE COMPETIT.docx
CASE 16  APPLE INC. STILL TAKING A BITE OUT OF THE COMPETIT.docxCASE 16  APPLE INC. STILL TAKING A BITE OUT OF THE COMPETIT.docx
CASE 16 APPLE INC. STILL TAKING A BITE OUT OF THE COMPETIT.docx
 
Computer Engineer.pdfComputer Engineer
Computer Engineer.pdfComputer EngineerComputer Engineer.pdfComputer Engineer
Computer Engineer.pdfComputer Engineer
 
Case Study Apple Inc
Case Study Apple IncCase Study Apple Inc
Case Study Apple Inc
 
Final project of apple inc. (riasat minhas)
Final project of apple inc. (riasat minhas)Final project of apple inc. (riasat minhas)
Final project of apple inc. (riasat minhas)
 
Apple Computer
Apple ComputerApple Computer
Apple Computer
 
Apple SWOT Analysis
Apple SWOT AnalysisApple SWOT Analysis
Apple SWOT Analysis
 
Ukessays.com analysis of dell in macro environment
Ukessays.com analysis of dell in macro environmentUkessays.com analysis of dell in macro environment
Ukessays.com analysis of dell in macro environment
 
Apple inc. document
Apple inc. document Apple inc. document
Apple inc. document
 
The PC Industry Wars
The PC Industry WarsThe PC Industry Wars
The PC Industry Wars
 
Apple
AppleApple
Apple
 
STEVE JOBS AND STRATEGIC FLEXIBILITY
STEVE JOBS AND STRATEGIC FLEXIBILITY STEVE JOBS AND STRATEGIC FLEXIBILITY
STEVE JOBS AND STRATEGIC FLEXIBILITY
 
Innovation In Apple
Innovation In AppleInnovation In Apple
Innovation In Apple
 

Plus de ikirkton

Analyze MVPIThe motives, values, and preferences inventory (MV.docx
Analyze MVPIThe motives, values, and preferences inventory (MV.docxAnalyze MVPIThe motives, values, and preferences inventory (MV.docx
Analyze MVPIThe motives, values, and preferences inventory (MV.docxikirkton
 
Analyze and interpret the following quotation The confrontation of.docx
Analyze and interpret the following quotation The confrontation of.docxAnalyze and interpret the following quotation The confrontation of.docx
Analyze and interpret the following quotation The confrontation of.docxikirkton
 
Analyze and prepare a critique of the following situationMary h.docx
Analyze and prepare a critique of the following situationMary h.docxAnalyze and prepare a critique of the following situationMary h.docx
Analyze and prepare a critique of the following situationMary h.docxikirkton
 
Analyze the anthropological film Jero A Balinese Trance Seance made.docx
Analyze the anthropological film Jero A Balinese Trance Seance made.docxAnalyze the anthropological film Jero A Balinese Trance Seance made.docx
Analyze the anthropological film Jero A Balinese Trance Seance made.docxikirkton
 
analyze and synthesize the financial reports of an organization of t.docx
analyze and synthesize the financial reports of an organization of t.docxanalyze and synthesize the financial reports of an organization of t.docx
analyze and synthesize the financial reports of an organization of t.docxikirkton
 
Analyze financial statements using financial ratios.• .docx
Analyze financial statements using financial ratios.• .docxAnalyze financial statements using financial ratios.• .docx
Analyze financial statements using financial ratios.• .docxikirkton
 
Analyze and prepare a critique of the following situationMary has.docx
Analyze and prepare a critique of the following situationMary has.docxAnalyze and prepare a critique of the following situationMary has.docx
Analyze and prepare a critique of the following situationMary has.docxikirkton
 
Analyze Alternative Exchange Rate RegimesThere are several argum.docx
Analyze Alternative Exchange Rate RegimesThere are several argum.docxAnalyze Alternative Exchange Rate RegimesThere are several argum.docx
Analyze Alternative Exchange Rate RegimesThere are several argum.docxikirkton
 
Analyze and evaluate the different leadership theories and behavior .docx
Analyze and evaluate the different leadership theories and behavior .docxAnalyze and evaluate the different leadership theories and behavior .docx
Analyze and evaluate the different leadership theories and behavior .docxikirkton
 
Analytical essay report about polio 1ِ- An introductory paragraph .docx
Analytical essay report about polio 1ِ- An introductory paragraph .docxAnalytical essay report about polio 1ِ- An introductory paragraph .docx
Analytical essay report about polio 1ِ- An introductory paragraph .docxikirkton
 
Analysis Essay 1DUE Feb 23, 2014 1155 PMGrade DetailsGrade.docx
Analysis Essay 1DUE Feb 23, 2014 1155 PMGrade DetailsGrade.docxAnalysis Essay 1DUE Feb 23, 2014 1155 PMGrade DetailsGrade.docx
Analysis Essay 1DUE Feb 23, 2014 1155 PMGrade DetailsGrade.docxikirkton
 
AnalogíasComplete the analogies. Follow the model.Modelomuer.docx
AnalogíasComplete the analogies. Follow the model.Modelomuer.docxAnalogíasComplete the analogies. Follow the model.Modelomuer.docx
AnalogíasComplete the analogies. Follow the model.Modelomuer.docxikirkton
 
ANA Buenos días, señor González. ¿Cómo (1) (2) SR. GONZÁLEZ .docx
ANA Buenos días, señor González. ¿Cómo (1)  (2) SR. GONZÁLEZ .docxANA Buenos días, señor González. ¿Cómo (1)  (2) SR. GONZÁLEZ .docx
ANA Buenos días, señor González. ¿Cómo (1) (2) SR. GONZÁLEZ .docxikirkton
 
Analyze symbolism in Jane Eyre from a Feminist point of view.  Exa.docx
Analyze symbolism in Jane Eyre from a Feminist point of view.  Exa.docxAnalyze symbolism in Jane Eyre from a Feminist point of view.  Exa.docx
Analyze symbolism in Jane Eyre from a Feminist point of view.  Exa.docxikirkton
 
An important part of research is finding sources that can be trusted.docx
An important part of research is finding sources that can be trusted.docxAn important part of research is finding sources that can be trusted.docx
An important part of research is finding sources that can be trusted.docxikirkton
 
An investment has an installed cost of $673,658. The cash flows ov.docx
An investment has an installed cost of $673,658. The cash flows ov.docxAn investment has an installed cost of $673,658. The cash flows ov.docx
An investment has an installed cost of $673,658. The cash flows ov.docxikirkton
 
An incomplete Punnett square There are three possible phenotypes fo.docx
An incomplete Punnett square There are three possible phenotypes fo.docxAn incomplete Punnett square There are three possible phenotypes fo.docx
An incomplete Punnett square There are three possible phenotypes fo.docxikirkton
 
An expanded version of the accounting equation could be A + .docx
An expanded version of the accounting equation could be  A + .docxAn expanded version of the accounting equation could be  A + .docx
An expanded version of the accounting equation could be A + .docxikirkton
 
An Evolving IndustryHow are the Internet and other technologies cu.docx
An Evolving IndustryHow are the Internet and other technologies cu.docxAn Evolving IndustryHow are the Internet and other technologies cu.docx
An Evolving IndustryHow are the Internet and other technologies cu.docxikirkton
 
An essay addressing the definition or resemblance concerning categor.docx
An essay addressing the definition or resemblance concerning categor.docxAn essay addressing the definition or resemblance concerning categor.docx
An essay addressing the definition or resemblance concerning categor.docxikirkton
 

Plus de ikirkton (20)

Analyze MVPIThe motives, values, and preferences inventory (MV.docx
Analyze MVPIThe motives, values, and preferences inventory (MV.docxAnalyze MVPIThe motives, values, and preferences inventory (MV.docx
Analyze MVPIThe motives, values, and preferences inventory (MV.docx
 
Analyze and interpret the following quotation The confrontation of.docx
Analyze and interpret the following quotation The confrontation of.docxAnalyze and interpret the following quotation The confrontation of.docx
Analyze and interpret the following quotation The confrontation of.docx
 
Analyze and prepare a critique of the following situationMary h.docx
Analyze and prepare a critique of the following situationMary h.docxAnalyze and prepare a critique of the following situationMary h.docx
Analyze and prepare a critique of the following situationMary h.docx
 
Analyze the anthropological film Jero A Balinese Trance Seance made.docx
Analyze the anthropological film Jero A Balinese Trance Seance made.docxAnalyze the anthropological film Jero A Balinese Trance Seance made.docx
Analyze the anthropological film Jero A Balinese Trance Seance made.docx
 
analyze and synthesize the financial reports of an organization of t.docx
analyze and synthesize the financial reports of an organization of t.docxanalyze and synthesize the financial reports of an organization of t.docx
analyze and synthesize the financial reports of an organization of t.docx
 
Analyze financial statements using financial ratios.• .docx
Analyze financial statements using financial ratios.• .docxAnalyze financial statements using financial ratios.• .docx
Analyze financial statements using financial ratios.• .docx
 
Analyze and prepare a critique of the following situationMary has.docx
Analyze and prepare a critique of the following situationMary has.docxAnalyze and prepare a critique of the following situationMary has.docx
Analyze and prepare a critique of the following situationMary has.docx
 
Analyze Alternative Exchange Rate RegimesThere are several argum.docx
Analyze Alternative Exchange Rate RegimesThere are several argum.docxAnalyze Alternative Exchange Rate RegimesThere are several argum.docx
Analyze Alternative Exchange Rate RegimesThere are several argum.docx
 
Analyze and evaluate the different leadership theories and behavior .docx
Analyze and evaluate the different leadership theories and behavior .docxAnalyze and evaluate the different leadership theories and behavior .docx
Analyze and evaluate the different leadership theories and behavior .docx
 
Analytical essay report about polio 1ِ- An introductory paragraph .docx
Analytical essay report about polio 1ِ- An introductory paragraph .docxAnalytical essay report about polio 1ِ- An introductory paragraph .docx
Analytical essay report about polio 1ِ- An introductory paragraph .docx
 
Analysis Essay 1DUE Feb 23, 2014 1155 PMGrade DetailsGrade.docx
Analysis Essay 1DUE Feb 23, 2014 1155 PMGrade DetailsGrade.docxAnalysis Essay 1DUE Feb 23, 2014 1155 PMGrade DetailsGrade.docx
Analysis Essay 1DUE Feb 23, 2014 1155 PMGrade DetailsGrade.docx
 
AnalogíasComplete the analogies. Follow the model.Modelomuer.docx
AnalogíasComplete the analogies. Follow the model.Modelomuer.docxAnalogíasComplete the analogies. Follow the model.Modelomuer.docx
AnalogíasComplete the analogies. Follow the model.Modelomuer.docx
 
ANA Buenos días, señor González. ¿Cómo (1) (2) SR. GONZÁLEZ .docx
ANA Buenos días, señor González. ¿Cómo (1)  (2) SR. GONZÁLEZ .docxANA Buenos días, señor González. ¿Cómo (1)  (2) SR. GONZÁLEZ .docx
ANA Buenos días, señor González. ¿Cómo (1) (2) SR. GONZÁLEZ .docx
 
Analyze symbolism in Jane Eyre from a Feminist point of view.  Exa.docx
Analyze symbolism in Jane Eyre from a Feminist point of view.  Exa.docxAnalyze symbolism in Jane Eyre from a Feminist point of view.  Exa.docx
Analyze symbolism in Jane Eyre from a Feminist point of view.  Exa.docx
 
An important part of research is finding sources that can be trusted.docx
An important part of research is finding sources that can be trusted.docxAn important part of research is finding sources that can be trusted.docx
An important part of research is finding sources that can be trusted.docx
 
An investment has an installed cost of $673,658. The cash flows ov.docx
An investment has an installed cost of $673,658. The cash flows ov.docxAn investment has an installed cost of $673,658. The cash flows ov.docx
An investment has an installed cost of $673,658. The cash flows ov.docx
 
An incomplete Punnett square There are three possible phenotypes fo.docx
An incomplete Punnett square There are three possible phenotypes fo.docxAn incomplete Punnett square There are three possible phenotypes fo.docx
An incomplete Punnett square There are three possible phenotypes fo.docx
 
An expanded version of the accounting equation could be A + .docx
An expanded version of the accounting equation could be  A + .docxAn expanded version of the accounting equation could be  A + .docx
An expanded version of the accounting equation could be A + .docx
 
An Evolving IndustryHow are the Internet and other technologies cu.docx
An Evolving IndustryHow are the Internet and other technologies cu.docxAn Evolving IndustryHow are the Internet and other technologies cu.docx
An Evolving IndustryHow are the Internet and other technologies cu.docx
 
An essay addressing the definition or resemblance concerning categor.docx
An essay addressing the definition or resemblance concerning categor.docxAn essay addressing the definition or resemblance concerning categor.docx
An essay addressing the definition or resemblance concerning categor.docx
 

Dernier

ICT role in 21st century education and it's challenges.
ICT role in 21st century education and it's challenges.ICT role in 21st century education and it's challenges.
ICT role in 21st century education and it's challenges.MaryamAhmad92
 
1029 - Danh muc Sach Giao Khoa 10 . pdf
1029 -  Danh muc Sach Giao Khoa 10 . pdf1029 -  Danh muc Sach Giao Khoa 10 . pdf
1029 - Danh muc Sach Giao Khoa 10 . pdfQucHHunhnh
 
Dyslexia AI Workshop for Slideshare.pptx
Dyslexia AI Workshop for Slideshare.pptxDyslexia AI Workshop for Slideshare.pptx
Dyslexia AI Workshop for Slideshare.pptxcallscotland1987
 
Sociology 101 Demonstration of Learning Exhibit
Sociology 101 Demonstration of Learning ExhibitSociology 101 Demonstration of Learning Exhibit
Sociology 101 Demonstration of Learning Exhibitjbellavia9
 
Magic bus Group work1and 2 (Team 3).pptx
Magic bus Group work1and 2 (Team 3).pptxMagic bus Group work1and 2 (Team 3).pptx
Magic bus Group work1and 2 (Team 3).pptxdhanalakshmis0310
 
Unit-IV- Pharma. Marketing Channels.pptx
Unit-IV- Pharma. Marketing Channels.pptxUnit-IV- Pharma. Marketing Channels.pptx
Unit-IV- Pharma. Marketing Channels.pptxVishalSingh1417
 
SKILL OF INTRODUCING THE LESSON MICRO SKILLS.pptx
SKILL OF INTRODUCING THE LESSON MICRO SKILLS.pptxSKILL OF INTRODUCING THE LESSON MICRO SKILLS.pptx
SKILL OF INTRODUCING THE LESSON MICRO SKILLS.pptxAmanpreet Kaur
 
The basics of sentences session 3pptx.pptx
The basics of sentences session 3pptx.pptxThe basics of sentences session 3pptx.pptx
The basics of sentences session 3pptx.pptxheathfieldcps1
 
Making communications land - Are they received and understood as intended? we...
Making communications land - Are they received and understood as intended? we...Making communications land - Are they received and understood as intended? we...
Making communications land - Are they received and understood as intended? we...Association for Project Management
 
Application orientated numerical on hev.ppt
Application orientated numerical on hev.pptApplication orientated numerical on hev.ppt
Application orientated numerical on hev.pptRamjanShidvankar
 
UGC NET Paper 1 Mathematical Reasoning & Aptitude.pdf
UGC NET Paper 1 Mathematical Reasoning & Aptitude.pdfUGC NET Paper 1 Mathematical Reasoning & Aptitude.pdf
UGC NET Paper 1 Mathematical Reasoning & Aptitude.pdfNirmal Dwivedi
 
How to Manage Global Discount in Odoo 17 POS
How to Manage Global Discount in Odoo 17 POSHow to Manage Global Discount in Odoo 17 POS
How to Manage Global Discount in Odoo 17 POSCeline George
 
Unit-V; Pricing (Pharma Marketing Management).pptx
Unit-V; Pricing (Pharma Marketing Management).pptxUnit-V; Pricing (Pharma Marketing Management).pptx
Unit-V; Pricing (Pharma Marketing Management).pptxVishalSingh1417
 
Python Notes for mca i year students osmania university.docx
Python Notes for mca i year students osmania university.docxPython Notes for mca i year students osmania university.docx
Python Notes for mca i year students osmania university.docxRamakrishna Reddy Bijjam
 
Spellings Wk 3 English CAPS CARES Please Practise
Spellings Wk 3 English CAPS CARES Please PractiseSpellings Wk 3 English CAPS CARES Please Practise
Spellings Wk 3 English CAPS CARES Please PractiseAnaAcapella
 
Unit-IV; Professional Sales Representative (PSR).pptx
Unit-IV; Professional Sales Representative (PSR).pptxUnit-IV; Professional Sales Representative (PSR).pptx
Unit-IV; Professional Sales Representative (PSR).pptxVishalSingh1417
 
PROCESS RECORDING FORMAT.docx
PROCESS      RECORDING        FORMAT.docxPROCESS      RECORDING        FORMAT.docx
PROCESS RECORDING FORMAT.docxPoojaSen20
 
Food safety_Challenges food safety laboratories_.pdf
Food safety_Challenges food safety laboratories_.pdfFood safety_Challenges food safety laboratories_.pdf
Food safety_Challenges food safety laboratories_.pdfSherif Taha
 

Dernier (20)

ICT role in 21st century education and it's challenges.
ICT role in 21st century education and it's challenges.ICT role in 21st century education and it's challenges.
ICT role in 21st century education and it's challenges.
 
1029 - Danh muc Sach Giao Khoa 10 . pdf
1029 -  Danh muc Sach Giao Khoa 10 . pdf1029 -  Danh muc Sach Giao Khoa 10 . pdf
1029 - Danh muc Sach Giao Khoa 10 . pdf
 
Dyslexia AI Workshop for Slideshare.pptx
Dyslexia AI Workshop for Slideshare.pptxDyslexia AI Workshop for Slideshare.pptx
Dyslexia AI Workshop for Slideshare.pptx
 
Sociology 101 Demonstration of Learning Exhibit
Sociology 101 Demonstration of Learning ExhibitSociology 101 Demonstration of Learning Exhibit
Sociology 101 Demonstration of Learning Exhibit
 
Magic bus Group work1and 2 (Team 3).pptx
Magic bus Group work1and 2 (Team 3).pptxMagic bus Group work1and 2 (Team 3).pptx
Magic bus Group work1and 2 (Team 3).pptx
 
Unit-IV- Pharma. Marketing Channels.pptx
Unit-IV- Pharma. Marketing Channels.pptxUnit-IV- Pharma. Marketing Channels.pptx
Unit-IV- Pharma. Marketing Channels.pptx
 
Spatium Project Simulation student brief
Spatium Project Simulation student briefSpatium Project Simulation student brief
Spatium Project Simulation student brief
 
SKILL OF INTRODUCING THE LESSON MICRO SKILLS.pptx
SKILL OF INTRODUCING THE LESSON MICRO SKILLS.pptxSKILL OF INTRODUCING THE LESSON MICRO SKILLS.pptx
SKILL OF INTRODUCING THE LESSON MICRO SKILLS.pptx
 
Asian American Pacific Islander Month DDSD 2024.pptx
Asian American Pacific Islander Month DDSD 2024.pptxAsian American Pacific Islander Month DDSD 2024.pptx
Asian American Pacific Islander Month DDSD 2024.pptx
 
The basics of sentences session 3pptx.pptx
The basics of sentences session 3pptx.pptxThe basics of sentences session 3pptx.pptx
The basics of sentences session 3pptx.pptx
 
Making communications land - Are they received and understood as intended? we...
Making communications land - Are they received and understood as intended? we...Making communications land - Are they received and understood as intended? we...
Making communications land - Are they received and understood as intended? we...
 
Application orientated numerical on hev.ppt
Application orientated numerical on hev.pptApplication orientated numerical on hev.ppt
Application orientated numerical on hev.ppt
 
UGC NET Paper 1 Mathematical Reasoning & Aptitude.pdf
UGC NET Paper 1 Mathematical Reasoning & Aptitude.pdfUGC NET Paper 1 Mathematical Reasoning & Aptitude.pdf
UGC NET Paper 1 Mathematical Reasoning & Aptitude.pdf
 
How to Manage Global Discount in Odoo 17 POS
How to Manage Global Discount in Odoo 17 POSHow to Manage Global Discount in Odoo 17 POS
How to Manage Global Discount in Odoo 17 POS
 
Unit-V; Pricing (Pharma Marketing Management).pptx
Unit-V; Pricing (Pharma Marketing Management).pptxUnit-V; Pricing (Pharma Marketing Management).pptx
Unit-V; Pricing (Pharma Marketing Management).pptx
 
Python Notes for mca i year students osmania university.docx
Python Notes for mca i year students osmania university.docxPython Notes for mca i year students osmania university.docx
Python Notes for mca i year students osmania university.docx
 
Spellings Wk 3 English CAPS CARES Please Practise
Spellings Wk 3 English CAPS CARES Please PractiseSpellings Wk 3 English CAPS CARES Please Practise
Spellings Wk 3 English CAPS CARES Please Practise
 
Unit-IV; Professional Sales Representative (PSR).pptx
Unit-IV; Professional Sales Representative (PSR).pptxUnit-IV; Professional Sales Representative (PSR).pptx
Unit-IV; Professional Sales Representative (PSR).pptx
 
PROCESS RECORDING FORMAT.docx
PROCESS      RECORDING        FORMAT.docxPROCESS      RECORDING        FORMAT.docx
PROCESS RECORDING FORMAT.docx
 
Food safety_Challenges food safety laboratories_.pdf
Food safety_Challenges food safety laboratories_.pdfFood safety_Challenges food safety laboratories_.pdf
Food safety_Challenges food safety laboratories_.pdf
 

BA 490 Senior Seminar in BusinessDr. Lori D. Paris.docx

  • 1. BA 490: Senior Seminar in Business Dr. Lori D. Paris March 11, 2012 Table of Contents Basic Company Information/History3 Industry Dominant Economic Features5 Five Forces Analysis of the PC industry 14 Strategic implications of Five Forces17 Driving Forces in the Industry 18 Industry Key Success Factors 20 Identify Industry Competitors 21 Strategic Maps 24 Summary of the industry and the overall attractiveness 27 Defining Strategy 28 SWOT analysis 30 Key Resources & Competencies 36 Competitive Strength Assessment 37 Apple’s Leadership and Corporate Culture 37
  • 2. Financial Analysis 38 Recommendations 42 Appendix A: Financial Ratios 45 References 53 History In 2011, Diane Hamilton described Apple Inc.’s mission statement as; “Apple is committed to bringing the best personal computing experience to students, educators, creative professionals and consumers around the world through its innovative hardware, software and internet offerings” (para.3). Apple’s vision statement is “Man is the creator of change in this world. As such he should be above systems and structures, and not subordinate to them" (Huzefa et al, 2009, p.15). With a common objective to create a low-cost and easy to use computer, the consummate salesperson Steve Jobs and the technical genius Steve “Woz” Wozniak got together in 1976 and founded Apple. In that same year, their first system, the Apple I, was launched and sold for $666.66 per unit (Powell, para 1). In 1977, Apple II was released and sold for $1,298.00, and sales spiked significantly (Huzefa et al., 2009, p.15). By 1980, Apple became a publicly traded company, and the Apple III was released. A number of business and technical issues, such as overpricing of the product, resulted in a profitable fiasco. The poor revenue and technical failure resulted in the firing of 40 employees by the CEO at the time, Michael Scott. The 40 employees accounted for nearly half the original Apple II team. The first commercially successful personal computer was Apple’s Macintosh (Mac). Released in 1984 under the guidance of chairman Steve Jobs, it was the first computer that included a mouse and a graphic. The Mac sold for $2,495.00. “By the time the Apple II and the Mac rolled around, Jobs and Woz had popularized the personal computing revolution, and the rest, as they say, is history” (Powell, para. 1).
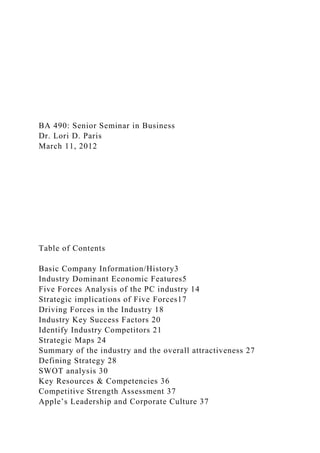
  • 3. During the years between 1985 and 1993, Apple grew from $600 million in annual sales to $8 billion by 1993. Business issues for Apple in the following years included the release of Microsoft’s Windows 95 operating system and cheap PC clones able to run the Macintosh operating system, resulting in significant quarterly losses in 1996 (Huzefa et al, 2009, p. 11- 12). In 1985, Steve had been fired from Apple by the board of directors after ongoing internal conflict within the company. He began a competing company, NeXT, which designed high-end computer systems and a refined operating system. Much of NeXT’s mission was to personally compete with Apple due to a longstanding grudge Steve carried against the board. 1997 saw the triumphant return of Steve Jobs to Apple. The great icon and visionary of the Macintosh, returned to the company when Steve negotiated the buyout of NeXT by Apple. Steve Jobs’s return to Apple “steered the company away from the clones and reversed direction with a back-to-basics approach” (Powell, para. 15). He officially became the CEO in January 2000. Steve reinvented Apple’s product line by introducing stylish hardware and a revamped operating system. His first success back with the company was the release of the iMac. The computer’s stylish colors and simple design quickly became a cultural icon and brought Apple out of near bankruptcy. In October 2001, Apple and the entire music industry were revolutionized, by the released of the iPod. Jobs’s ability to innovate new products and ideas, as well as implementing several key structural changes, helped turn the company’s previous poor performance in the right direction (Thompson et al, Case 7, p. 148). Between 2001 and 2010, Apple has seen the international opening of a total of 324 stores (approximately 72% are in the U.S), and sales that have been steadily increasing year after year (Fig. 1) (Jade, 2011, para. 5). As of January 2012, Apple had 60,000 full time employees.
  • 4. FIGURE 1. Sales for Apple retail stores between 2001-2010 Note: Store total for fiscal year Industry Dominant Economic Features Apple operates in the personal computer (PC) industry. They have experienced incredible growth in the last decade, somewhat due to the overall year-after-year growth in the PC industry, as well as their innovative approaches to shaping the future of the industry. The analysis of the dominant economic features in the PC industry will focus on the global market rather than just the U.S. alone, because PC manufacturers sell there products world-wide. Before analysis of the industry can be performed, it is crucial to decide whether to include tablets as part of the PC industry. Tablet computers, such as the iPad and various competing products, can arguably be considered personal computing devices, or alternatively, a separate niche product of an emerging industry. This potential ambiguity is an important consideration because the growth of tablet devices could be a potential “industry-changer” resulting in the future success of companies such as Apple. For this analysis, tablet devices will be included in the broader PC industry, and not as a separate niche industry. Tablet devices contain all the major internal components of traditional laptop computers, and current operating systems allow them to nearly replace traditional computers in some applications. Market size and growth rate PC sales have grown exponentially since the beginning of the century, but have plateaued in recent years. A sharp upswing in growth rate is apparent after the introduction of tablets. Figure
  • 5. 2 is telling of the industry’s position and product life cycle as growth generally has been slow for traditional PCs, but with the advent of tablet computers, has sharply risen. Before the introduction of the tablet, computer sales consisted of laptops and desktop PCs. It is difficult to say if in recent years the stagnation in sales of standard PCs is the result of consumers finding their needs met by tablets, whereas in the past they would have purchased a standard PC. In any case, the global success of Apple’s iPad is a clear indication of the shift of sales from standard PCs towards tablets accounting for present growth in the industry. FIGURE 2 Worldwide PC Unit Shipments, 2000-2015 Note: Source IC Insights. From Electronics.ca Research Network (2012). As evidenced in Figure 2 (“Impressive Growth Continues,” 2012) the industry life cycle excluding tablets, is clearly at the maturity stage. Sales of standard PCs have slowed from their previous growth years. When including tablets, a different trend can be observed. There is clearly an exponential growth in sales for the PC industry, indicating that they are yet again in a growth stage of their life cycle. The PC industry has gone from growth stages to maturity in sales of standard PCs, but the innovation of the release of the tablet has resulted in a renewed growth stage. Number of rivals Five corporations have approximately 70% of the PC market. These are Acer, Apple, Dell, HP, and Lenovo. Although there are a number of companies that are competing in the PC industry, there are only five that can be considered very large players dominating the industry (Fig. 3) (Elmer-DeWitt, J. 2012). There exist a number of small companies that put together standard PCs for niche markets, such as gaming and certain high-end graphic design machines. While small
  • 6. companies cater to niche markets, the five largest compete for market share amongst your average computer customers. FIGURE 3 Global computing share including and excluding iPads Scope of competitive rivalry As shown in Figure 4 (Arthur, 2011), the majority of the PC makers sell their goods in global markets. Consolidations have also led many companies to become global through the acquisition of international operating units. Overall, between 2006-2009, profit margins for the companies in the PC industry increased significantly, mainly due to consolidations in the industry (“Market Environment.” 2011 para. 2). Therefore, the significance for PC manufacturers to have a presence in the foreign market is obvious in order to survive in a competitive market. FIGURE 4 Millions of PC sales by region, 2009 Q1-2001Q3 Degree of product differentiation The importance of contrasting products and services among rivals in the PC industry is an absolute necessity for all players trying to improve their market share in a far from perfect competitive environment. However, the number one reason for the high price competition in the PC industry is due to the similarity among marketed products due to mimicking. Copying other companies’ product releases is as common as the PC itself. HP’s European personal systems group head, Eric Cador, announced HP’s response to the successful iPad and claimed that: “In the tablet world, we’re going to become better than number one. We call it number one plus” (Tung, 2011 para. 2). Along with mimicking other company products, the five main players in the PC industry are constantly trying to win customer
  • 7. base through product differentiation. · Acer are striving to distinguish its products by focusing on value-added benefits, and strive to become the very first super brand ultra extreme notebook (Ren, 2012 para. 1), as well as designing environmentally friendly products (Tarsus, para. 2) · Apple’s have clearly succeeded to differentiate their products form others, with its regular innovative approach in improving the features (i.e. style and ease of use) and groundbreaking technology of its products (Welker, para. 2-3). Apple also boasts incredible customer support. · Dell differentiated its products with a strategy on delivering solutions. “To deliver solutions those are highly capable, affordable and flexible to meet the needs of large enterprises, public institutions, small and mid-size businesses” (Dell, para. 2). They have focused on enterprise users, providing scalable products for different business needs. · HP has a genuine commitment to sustainability, as well as striving to provide superior customer service (HP. 2010 para. 2). · Lenovo differentiates itself by its in-house manufacturing expertise as well as its corporate target audience, rather than the individual market (Garg, 2011 p. 32). Product innovation Perhaps the most vital part of a company’s economic feature is the product innovation aspect. The PC has undergone considerable rapid innovation and change since its introduction, and the steady price decline in recent years, mainly credited to globalization of cheaper production, has further stimulated the urge for innovation (Dedrick, et al, 2006 p. 4). An effect caused by the rapid innovation is the shortening of product lifecycles, which is the time between a products release day until the day it is withdrawn from the market. There is an inverse relationship between shortening product lifecycles and PC makers spending in research and development (R&D) (Bayus, 1998, para. 1). The importance of R&D rests in its ability to satisfy customers needs for innovative PC products
  • 8. that fit different lifestyles, ultimately resulting in increased market share for the successful company. Supply and Bargaining Power There are mainly two segments in the PC industry supply-chain, peripheral components providers and operating systems providers. There are manufacturers that supply the PC makers with components such as memory chips, keyboards, and monitors. The majorities of these components are homogeneous and are available from a large number of suppliers. The other component of the PC suppliers is the manufactures that supply PC makers with key components products, such as microprocessors and operating systems (OS). FIGURE 5 Market Share of PC Suppliers Hardware components are becoming increasingly commoditized, which limit the bargaining power of suppliers. Therefore, the PC maker is not limited to a single supplier, but instead chooses among the best suitable alternative. The latter part of the supply-chain has considerably more bargaining power. Microsoft and Intel are good examples of suppliers in the PC industry that have established a dominant strategic position in the industry and have significant bargaining power (Simister, 2011 para. 3). This is due to their considerable dominant market shares. Figure 5 shows that multinational semiconductor chip maker, Intel, possessed a 60.7% market share in the graphics processor industry, and their share is forecasted to grow through the future (GfxS Staff, 2011). Microsoft also has significant bargaining power due to their 80% market share in operating systems and is therefore the single major supplier of that component (Keaton, 2011) (Fig, 6) FIGURE 6
  • 9. Total Market Share of the Larges Operating System Makers Demand and Bargaining Power As shown in Figure 7, PC buyers are divided into three categories: business, home, and education. Not only does this show a 27.7% increase in Apple’s total growth of shipments versus a decline of 1.2% in the rest of the market, but it also illustrates a generalized picture of the PC markets overall segmentation sizes of its buyers. The PC market is dominated by large-scale buyers, such as business and educational institutions, that in turn have significant more influence in price setting. FIGURE 7 Mac Growth vs. the PC Market Pace of technological change The exponential increase of technological change in the past is not by any means expected to change. Bill Gates, Microsoft Chairman, predicted in 2008 that technological spikes in the next 10 years would be even larger that what we have seen in the past decade (Barakat, 2008 para 1). Hence, it is clear that big players in the PC industry need to be at the forefront of any technology advancement in order to stay in business, since technology is the core factor behind all computers. Prevalence of background/forward integration Even though vertical integration can be a complex and costly strategy to implement successfully, it can be beneficial for a company in many ways. There are benefits such as increased control over the value chain, improved cost control through the distribution process, and increase competitive advantage while blocking competitors access to valuable resources. Apple is one of the most vertically integrated companies in the world. In
  • 10. addition to operating their own retail chains, they design the hardware and software in-house, and run their own digital content store, iTunes (Chen, 2011). In 2008, they acquired the microprocessor design house, Palo Alto Semiconductor (Fish, 2011). A decade ago, Dell was one of the world’s most integrated companies in the world, after acquiring Compaq and Electronic Data Systems (EDS). As of 2011, HP switched approach and are now at its shedding stage becoming less vertically integrated in an effort to trim operating expenses (Takahashi, 2011). A vertical integration strategy has both pros and cons, but it is necessary to understand that “for each big company, the calculation is always different” (Takahashi, 2011, para. 5). Economies of scale/experience curve effect Two commonly known concepts: economies of scale and experience curve effect, which can be used by players in the computer industry in order to decrease unit costs as volume rises. Hence, it widens a business’s chances to win market share over rivals, which in turn is a decisive factor, especially in the PC industry. When the PC producers double their production volume, the unit cost is approximately 50% (Bailom et al. 2007 p. 48). Consequently, it would be almost prohibitively competitive for any small firm to enter the PC industry, while in absence of these competitive advantages: economies of scale and experience curve effect. Entry/exit barriers The economics of scale as well as the experience curve effect advantages possessed by the dominant players in the PC industry works as a barrier for new competitors to enter the industry. Even though it is relatively cheap to enter the PC industry due to cheap raw material of building PCs, the capital requirement that would be required to compete with the established industry giants is prohibitively large. Taking into account that Apple spent an estimated $109 billion in research and development (R&D) last year alone makes a person likely to think twice about entering the industry (Dignan, 2011). Finally,
  • 11. well-known brand names established by the big players like Apple and Dell, have certain intrinsic value that is associated with their products. Not only is the brand name a great determinant of the company’s market position, but also works as a barrier to enter the extremely competitive industry. Conclusively, the barriers to entry the PC industry are a challenge. They reduce the rate of entry of new firms, thus maintaining the level of profits for those already in the industry. However, with technological savvy, the opportunity to develop an innovative product that can be marketed to the large companies exists. The most probable situation for creating profit with the PC business would be to sell a technology to currently established companies. Five Forces Analysis of the PC industry Threat of new Entrants (WEAK) · The presence of dominant players with established brands deters the entry of new players into the market. Strong brand preferences and customer loyalty works as a high barrier to entry. · Because the five leading companies in the PC industry can take advantage of economies of scale associated with large- scale operations, the threat of new entries is lowered. · There is a tremendous disadvantage for new entrants due to the resource disadvantage associated with the possession of proprietary technology by large players. · The presence of copyrights on software etc. works as an absolute cost advantage for the firms possessing the rights, therefore working as a barrier to entry. · The ease in making computers and the low capital requirement lowers the entry barrier. The threat of new entrants in the PC industry is very weak, due to the evidence provided above. The possibility of newcomers entering the industry and succeeding is therefore extremely slim. The Threat of Substitute Products and Services (LOW)
  • 12. · The price of substitutes, such as netbooks and handheld mobile devices, with a lower price tag, increases the threat of substitutes in the PC market. · The performance characteristic of substitute products does not reach the standards of PCs capabilities. This lowers the threat of substitute products. · The switching cost to substitutes is low, another factor that increases the treat of alternative products. The relative price/performance relationship of substitutes in the PC industry implies that the PCs still are way beyond any such substitute device due to its wide variety of functions. Even though smartphones can be considered a threat, the PC has itself come to work as a substitute to many products in the market such as TV, CD-player, photo album, book etc. Conclusively, the threat for substitute products is low. However, it is worth mentioning that if we were excluding iPads as a category of PCs, the treat of substitutes would be significantly stronger, because iPads are clearly cannibalizing the traditional PC sales. Bargaining Power of Suppliers (Moderate/High) · Suppliers of highly standardized/commodities components such as memory chips, keyboards, monitors etc., have low bargaining power due to the availability and the low switching cost of these products from a large number of suppliers. · Suppliers such as Intel and Microsoft dominate the industry in their field. They supply the PC makers with differentiated components and therefore have large bargaining power. · Intel and Microsoft also have a significant impact on many large PC makers value chain. This further increases their barging power. Consequently, since there are mainly two segments in the PC industry supply-chain, it is fairly straightforward to determine the bargaining power of those suppliers. The large bargaining power possessed by Intel and Microsoft due to their differentiated products as well as their importance in the value chain of PC makers, weights more than the lack of bargaining power owned by the commodity suppliers. Therefore, supplier
  • 13. bargaining power in the PC industry is moderate to high, making the industry unattractive. Bargaining Power of Buyers (Moderate) · Bargaining power of large quantity buyers is large, such as government and large corporation/businesses, while individual buyers do not have much barging power. · Because switching costs are low, buyers have the ability to switch when quality, service or price offered elsewhere is more competitive. The overall bargaining power of buyers is moderate, making the industry unattractive from a profit making standpoint. Industry Rivalry (Strong) · Five large players dominate approximately 70% of the entire PC industry, which increases rivalry between the firms. · HP and Apple, are the two largest players in the PC industry. Their market shares are within approximately 10% of each other. All the other players have market shares within 5% of each other. This balanced segmentation of market shares between players, increases the rivalry and makes the industry less attractive. · The relative low strategic difference among large PC players in the industry also increases the rivalry between players, because they are, to an extent, fighting for the same market. · The PC industry growth rate for standard PCs is maturing, which increases rivalry. On the other hand, the growth rate for tablet PCs has realized rapid growth since its birthdate. So while there is less rivalry in the market for tablet PCs, it is fierce rivalry between standard PC makers. · All players in the PC industry realize revenue from other industries, but the majority of the revenue is from PC sales. This increases the rivalry among firms. · The cost for buyers to switch between the industries giants is minimal, therefore stronger rivalry in the industry. · Because the market share of the tablets are mainly in Apple, companies make aggressive moves to improve their market prospects, rivalry increases.
  • 14. Clearly, the PC industry rivalry is very strong and unattractive from an earnings standpoint. Strategic implications of Five Forces By evaluating Porter’s Five Forces the PC industry’s potential profit and attractiveness can be examined through an assessment of its competitive environment. Strong rivalry among the players in the PC industry, the moderate bargaining power of customers, and the moderate/high bargaining power of suppliers makes the competitive environment unattractive from an earning standpoint. On the other hand, the competitive environment is ideal from a profit-making standpoint because entry barriers are high, and good substitutes do not exists. While it would be relatively unwise for newcomers to enter the PC industry, the industry itself has moderate opportunities for profit making. Driving Forces in the Industry Product Innovation Gartner, the world’s leading technology research company, recognized netbooks as the one force driving the PC industry in 2009 (Hruska, 2008, para. 1). Today, the innovative introduction of tablets appears to be a driving force that will cause the PC industry environment to change. A potential effect of product innovation could be a wider customer base, renewed industry growth, and broadening the degree of product differentiation. Rivals that successfully incorporate product innovation can see a strengthening market share, to the expense of less successful competitors (Chaneta, p. 41). Technological Improvement Ultimately, product innovation in the PC industry is based upon technological improvement. Technological improvements generally are focused on building smaller and more energy efficient components. Most computer components depend on the size of semiconductor materials to create the various microchips and circuitry. Moore’s Law describes that roughly every two years the number of transistors that can be placed on an integrated circuit doubles. The decrease in size and cost of
  • 15. building components from cheaper and small semiconductors allows smaller products to be developed. These developments result in cheaper devices and smaller products (Kanter, 2011 para. 1-3). The past is evidential enough to conclude that technological improvement can alter the industry landscape significantly. Not only does it allow for the development of advanced product lines, but it can also present an opportunity to minimize unit cost, which in itself can result in lower price to customers. This can positively affect large players in the industry that can take advantage of economies of scale and experience curve effect to increase profit margin. Changes in Customer Expectations & Demographics Industry conditions will change along with the realized consumers expectation philosophy of: “access everything, everywhere”. Prices of computers have decreased throughout the PC industry’s existence to a price affordable to most households. Also, “we use them for everything from storing home movies, music and photos, through to planning trips and holidays, socializing, online shopping, gaming, finding a cure for cancer and searching for extraterrestrial life” (Dexter, 2011 para. 5). Leslie Fiering, research vice president at Gartner, strongly believes that kids, under the age of 15, will account for 50% of touchscreens users as of 2015. Garner also expects a significant increase in touchscreen devices for educational purposes (Schroeder, 2010 para. 2-5). According to J. Thomas, “Apple totally flipped the demographics of the tablet market almost overnight” (para, 11). As of 2010, males made up approximately 66% of the tablet market, and 62% were younger than 34, while no more than 10% were over 65. As of 2011, 49% of all users are women and 30% of users were 55 and older (Thomas, 2010). The availability of information at our fingertips will have a profound effect on the PC industry and force adjustments to adapt to market demand. The result will force an extension in PC maker’s product line and the potential for increased profits
  • 16. is large. An expansion in target markets to women, as well as younger and older generations will arguably increase profits as well. Impact of Driving Forces PC makers that are able to successfully incorporate innovation will most likely be able to win market share and realize positive returns. Less successful players will loose market share, but an overall renewal of growth and profitability in the PC industry will most likely be the effect of product innovation. The technological driving force will undoubtedly present an opportunity for an increased profitability among large players in the PC industry, which can take advantage of economies of scale lower cost and increase unit shipments. Geographic shifts, such as changes in those who buy the products and how the products are used, will most likely expand the PC makers’ product lines and target market. This can have a profound effect on competitor’s income statements. Industry Key Success Factors There are particular competitive factors that are important to all players within the PC industry. These are termed “key success factors” (KSF). All of these are core elements that determine the future competitive success of the players in the PC industry. Technology-related KSFs Technological advancement is the core factor in the PC industry. According to Moore’s law, the number of transistors on a microchip will double about every two years. This law lays the foundation for the survival of any player in the PC industry. Without the ability to adopt new technological capabilities at the same time as improving energy efficiency, there is no chance of survival in this highly competitive industry. Skills-related KSFs There are two main reasons why Apple manufactured the iPhone
  • 17. in China rather than in the U.S. The principal and most obvious reason is the utilization of the cheap workforce in China. The second reason is the lack of qualified engineers in the U.S. Approximately 8,700 industrial engineers were required to oversee the assembly-line production, and Apple analyst’s forecasted that it would take as much as nine months to acquire the needed workforce. On the other hand, it would take 15 days in China (Chan, 2012 para. 3). Effective cost control KSFs The constant lowering of prices of PCs are predicted to continue. Because of this reason, PC manufactures need to establish an efficient cost control system, in order to make profit and to keep or improve market share. Innovation KSFs Figure 8 illustrates the significance of innovation in the fierce competitive PC industry. The shift away from traditional PCs to tablets and smartphones highlights the innovative approach that PC manufacturers need to focus on in order to maintain market share (Kingsley. H, 2012 para.1). Figure 8 Units Shipped Per Year (Log Scale) Marketing-related KSFs During FY2010, Apple spent approximately $691 million on advertising. This was an increase of $190 million from 2009. Apple saw a tremendous increase in revenue due to efficient advertising strategies (Dilger, 2010 para 1). PC makers need to use efficient marketing related strategies such as advertising is clearly essential for the survival of the companies. Identify Industry Competitors There are primarily five competitors in the PC industry: Apple, Dell, HP, Lenovo, and Acer. A brief introduction of each
  • 18. corporation follows herein. Apple Inc. Apple Inc. and its wholly owned subsidiaries, collectively called “Apple,” are designing and manufacturing a wide range of technological product/services such as digital music players, software, personal computers, and mobile communication devices. The company was founded in 1977 in California. Apple is a global vendor who sells its products through its retail stores, online stores, direct sales force, and retailers. Apple’s customers are consumer, businesses, educational institutions, enterprises, as well as government and creative markets (Apple Inc., 10-K, 2010 p. 1). As of 2011, Apple has approximately 22% of the computer market share (see Fig. 6) and a net income of $14,013 million in 2010 (Apple Inc., 10-K, 2010 p. 47). Hewlett-Packard (HP) HP was founded in 1939 and was incorporated from California to Delaware 1947. HP is a global, leading provider of software and technologies to businesses, government, enterprises, and educational institutions (HP, 10-K, 2010 p. 3). In 2011, HP retained approximately 15% computing market share in the PC industry (see Fig. 6) and a net income of $8,761 million as of 2010 (HP, 10-K, 2010 p. 73). Lenovo 1984 is the year when Legend Holdings was formed in China. They were incorporated in Hong Kong in 1988. Legend Holding changed its name to Lenovo as of 2004. Lenovo is a global corporation with employees in 60 countries, but serves customer in more than 160 countries. Lenovo supply customers (businesses, educational institutions, government) with technology products and services such PCs, servers, mobile devices, and workstations (About Lenovo, 2012 para. 1-5). Lenovo had, as of 2011, approximately 12% computing market share in the PC industry (see Fig. 6), with a net income of $76 million in 2010 (Lenovo, 10-K, 2010 p. 71). Acer Inc.
  • 19. Acer, the now globally operating corporation was founded in 1976. Acer supply customers (consumers, businesses, and educational institutions) with services and products such as PCs, netbooks, tablets, and projectors. (About Acer, 2012 para. 1). Acer maintained approximately 11% computing market share in the PC industry in 2011 (see Fig. 6), and realized $519 million as of 2010 (Acer Inc., 10-K, 2010 p. 75). Dell Inc. Dell is a global corporation and was founded in 1984. They offer a broad range of products (mobile products, desktop PCs, software, and servers) to a broad customer based including businesses, educational institutions, and consumers (Dell Inc., 10-K, 2010 p.1). As of 2011, Dell had accumulated approximately 7% global computing market share in the PC industry (see Fig. 6), and realized $1,433 million in net income as of 2010 (Dell Inc., 10-K, 2010 p.51). Strategic Mapping In order to analyze current market position of the five main rivals in the PC industry, strategic group mappings are presented in Figures 9, 10, and 11. The figures represent the competitive characteristics that separate the major rivals in the industry such as price, quality, support, inventory levels, and product-line breadth. According to Fig. 9, the PC rivals product line breadth has an inverse relationship with the product price, quality, and support. While Apple has a narrow product line relative to rivals, this is not necessarily “the best place to be” for all companies. Apple has adopted a narrow product-line. Their position on the strategic map is clearly favorable for them, because their narrow product-line along with high quality products and excellent customer support, allows them to charge premium prices for niche products. Fig. 10 reveals the inverse relationship between PC makers inventory turnover ratio and the product price, quality, and support. Apple’s high inventory turnover along with its high
  • 20. profit margin reveals two competitive advantages that Apple can use to win market share over rivals. Lastly, Fig. 11 shows the inverse relationship between the PC maker’s profit margin ratio and the total asset turnover ratio (TATO). Analysis demonstrates that there is not “best place to be” on the strategic map. It depends on the specific company strategy. Nonetheless, a company that has a high PM along with a low TATO, ultimately have a so called “consumer advantage”. For Apple, this comes from their strong brand name as well as their ability to take advantage of economies of scale (Meier, 2010). FIGURE 9 FIGURE 10 FIGURE 11 Summary of the industry and the overall attractiveness The current state of the competitive environment in the PC industry was assessed with Porter’s five forces. Conclusively, there is an opportunity to make profit in the PC industry, mainly because entry barriers are relatively high and the lack of any real threatening substitute products. A cause of concern is the strong rivalry, moderate bargaining power of customers, and the moderate/high bargaining power of suppliers working as barriers for industry members to make profit. Product innovation, technological change, and changes in who buys the products and who use it, are all driving forces that can alter the industry landscape in the near future. Players in the industry that successfully incorporate product innovation
  • 21. strategies have the opportunity to realize large profits and gain market share. Technology development in the PC industry will benefit large players that have the capabilities to take advantage of economies of scale and experience curve effect. Changes in buyers demographics puts a tremendous pressure on PC makers to adapt to market demand, but success in doing so will most likely result in large profits. Overall, successful adaption to future changes in the PC industry will positively favor the industry profitability. The PC industry clearly has tremendous growth potential, mainly because our whole lives is dependent on technology and computers. Past evidence shows that worldwide PC unit shipments have growing steadily from FY2000 and is expected to grow even more up until FY2015 (Fig. 4). Mounting competition between large players in the industry will inevitably squeeze industry profitability. Even though there is a relatively balanced segmentation of market positions and rivalries, Apple and HP currently have the largest market shares. This competitive position among rivals in the industry may inevitably result in plenty of opportunity for profitability for the top rivals, while the smaller rivals having to fight an intense battle with stronger rivals, and this will inevitably hurt their success. Defining Strategy Arenas Apple offers a wide range of products such as Macintosh desktops and laptops, software, iPod, iPhone, iPad, iTunes, Apple TV, and iCloud (K10 p. 3). Apple’s main customers are in the consumer, small to medium businesses, education, enterprise and government market (10k p. 6). Apple has business operations in the U.S., Asia, and Europe. As of July 2011, the company had 357 retail stores in ten countries. However, Apple’s largest geographic market is the U.S., which accounted for approximately 39% of sales, as of 2011. (10k p. 8)
  • 22. Apple’s operating system, Mac OS X, contains highly sophisticated core technologies such as Grand Central Dispatch, OpenCL, and 64-Bit throughput. These are developed so that the users can increase the speed and responsiveness while using applications (Core Technologies, 2012). Differentiators Apple’s logo, the symbol of lust and knowledge, is one of the most recognized brand symbols in the world. Apple’s unmatchable aesthetics as well as premium quality and reliability, allow them to charge premium prices due to the quality of the products. According to PC World’s “Reliability and Service Survey,” Apple “smoked” its competitors when it came to quality and reliability (Mick, 2010 para. 1-3). Vehicle On top of Apple’s internal development team that strives to create value for the customer, they have established many acquisitions in eight countries, as well multiple licensing agreements to many entities worldwide. Staging Apple opened their first retail outlet in 2001, located in Virginia. While pundits projected failure of Apple’s retail expansion, the company had 10 years of aggressive expansion, opening location after location. In the end of March 2011, Apple had openef 323 retail stores around the world, and they planned to open another 40 stores by the end of September (Zibreg, 2011 para. 1-2). Economic logic Due to Apple’s extraordinary innovative approach to aesthetics, they have the advantage to charge customer premium prices due to unmatchable services and proprietary product features. Apple’s Strategy With an aggressive approach of retail expansion, as well as its own internal development team, acquisitions, and licensing agreements worldwide, Apple strives to add value to its customer’s throughout the globe. The company’s unmatchable
  • 23. aesthetics, premium quality and reliability, superior ease-of-use, and seamless integration, allow them to charge premium prices for high quality, differentiated products. Apple’s successful innovative approach, as well as its operating system, hardware, and software, has established one of the most recognized brand symbols in the world. SWOT analysis Strengths 1. Brand Recognition & Customer Loyalty According to Brand Finance, a consulting company that value brands names of large corporations, Apple’s logo rated second in the world, after Google. Apple’s logo was valued in 2011, to $39.3 billion. This was a 33% increase from the previous year, as well as the first year they beat corporate giants such as Microsoft, IBM, Wal-Mart, and General Electric (Elmer- DeWitt, 2011). Apple’s brand loyalty among users is extraordinary. When Apple has any issues with its products, users are very patient and forgiving, and keep buying their products. 2. Design and Innovation Apple’s aesthetic product design, ease of use, and reliability has allowed them to maintain tremendous customer loyalty all over the globe. Even though Apple’s product design is consistent, their portfolio is not. Innovation has allowed Apple to offer customers a variety of ways to utilize their products, such as the iPad, iPod, and MacBook Air. 3. Marketing Apple and advertising go hand in hand. Their first significant ad campaign was the “1984” Super Bowl commercial, marking the beginning of two decades of an extremely successful marketing career. The very successful “Think Different” ad campaign that was debuted in 1997 came to be remarkably popular (Hormby, 2009 para. 28). Ultimately, Apple’s success in marketing their products has been a major reason for their successful earnings history.
  • 24. 4. Research and Development (R&D) As illustrated by Figure 11, Apple’s R&D budget is significantly more effective than its rivals, with less than 10% of net income devoted to R&D. Hence, Apple have not spared expenses on its R&D (see Figure 12). The following thesis is still valid: “Apple develops market-dominating products on a bargain-basement R&D budget” (Apple’s Research and Development Advantage, 2011 para. 2). FIGURE 11. R&D as a Percentage of Net Income FIGURE 12. Research & Development Dollars 5. Retail Location Between 2009 and 2010, Apple’s retail sales increased by $3.1 billion or 47%, and $4.3 billion or 44% the following year. In the end of 2009, 2010, and 2011, Apple owned 273, 317, and 357 retail stores, respectively. The vast majority of stores are in the U.S. (Apple Inc., Form 10-K, 2011 p.34). This illustrates Apple’s magical retail store success and according to RetailSales, Apple ranked number one in sales per square feet as it generates, annually, more than $5,626 per square foot (Reisinger, 2011) Weaknesses 1. Ultimate Control Apple is in complete control over operations, supply chain and manufacturing activities. It can be argued that this is the secret behind their overall success. On the other hand, the fact they only offer their own OS on their own devices, can be seen as a significant weakness, particularly in the mobile phone market. The Android OS works on many various devices, and this is the main reason why Android are ahead of the iPhone, as far as sales goes. 2. Yearly Upgrades Apple recently announced that they are moving OS X to a
  • 25. yearly release cycle. Some might argue that this is on of Apple’s strengths, because it poses a great opportunity to introduce new features for consumers. However, it is more than likely to create problems and dissatisfaction among consumers, especially large-scale buyers such as businesses and schools (Faas, 2012). When a relatively expensive product becomes obsolete after only 12 months, many consumers become unsatisfied, and one can only speculate on whether consumers will be loyal enough to pay for pricy Mac system upgrades. Albeit, to date Apple has done an excellent job of pricing OS upgrades. 3. Higher Prices & Less Market Share than Rivals Apple is known for charging premium prices for niche product designs. This could be seen as a weakness due to the limited market segmentation that they can target. Also, as illustrated in Fig 6, Apple has a larger market share than its four largest rivals, when including the iPad as a PC. However, when we take away the iPad out of the calculation, Apple’s PC market share is far below all four rivals. This phenomenon tells us that Apple’s PC sales are significantly dependable upon one product, the iPad. Hence, it can be seen as an internal weakness. 4. Little Sales to Businesses According to IDC, Mac sales in the last quarter of 2010 were seven times as much as the overall PC market. This is also the 19th quarter that Mac has surpassed the whole market. Hence, their biggest increase came from business and government sales. For the last quarter in 2010, business sales grew 65.4% and government sales grew 549.5%. Even though this arguably is a very large number, compared to the overall market, there is a drawback that is easily overlooked. Government sales are still only 1% of the overall total sales of the Mac, while business accounts for as little as 3% (Foresman, 2010 para. 1-2). This small-scale sale to business and government can be seen as an internal weakness of Apple’s ability to efficiently sell their product to vital enterprises. Opportunities
  • 26. 1. International Sales and Growth rate of PC industry As of FY2011, 35% of Apple’s net sales were domestic. However, the fastest growing market was Asia-Pacific, with a growth rate of 174% from the previous year (Apple Inc., Form 10-K, 2011 p.30). This clearly indicates that Apple have the opportunity to grow in other market segments worldwide. 2. Innovative Products It is no question that Apple iPad is the driving force behind tablet computers. As illustrated in Fig. 4, tablet computers are projected to grow at double-digit growth rate at least until 2015. This demonstrates the opportunities that lie behind an innovative product strategy. 3. Increase Market Share With a large enough scope of market share, a company has monopoly power. Approximately 90% of all PC users worldwide run Windows. Microsoft’s dominance in the software market have allowed them to earn generous profits, primarily because they have been able to hold about 90% of the market. As of 2011, Windows market share dropped below 90%, due to other operating systems such as Apple’s OS X (Brodkin, 2011 para. 1). Clearly, there is an opportunity for successful companies to win market share from rivals and realize larger returns. 4. Changing Demographics In 2010, when the original iPad was released, things changed. It suddenly became “cool” to use an iPad. According to J. Thomas, “Apple totally flipped the demographics of the tablet market almost overnight” (para, 11). Apple also made it extremely easy to use the iPad, which in turn changes their target market to an even younger generation. As of 2010, males made up approximately 66% of the tablet market, and 62% were younger than 34, while no more than 10% were over 65. As of 2011, 49% of all users are women and 30% of users were 55 and older (Thomas, 2010). Threats 1. EHS Liabilities
  • 27. Foxconn has one of the most sophisticated manufacturing system on earth, which has allowed Apple and many other companies to increase the speed of manufacturing to a level that could only be dreamed of. There has been some serious safety problem and issues associated with this multi-billion dollar corporation such as excessive overtime, underage workers, improperly disposal of hazardous waste, serious work injuries, and suicides among workers. These hazards also included the well-known explosions that occurred at the Chengdu plant in 2011. According to the Chinese group that publishes the warning for hazardous conditions inside the plant, Apple was well aware of the situation but did not do anything to prevent it from happening (Duhigg, 2012 para. 5-8). This could potentially harm Apple’s reputation tremendously, and that can ultimately have a negative effect on the company’s profit. 2. Competition in Technology The fierce global competition over technology between the main players in the PC industry can be seen as a threat for all players. Even though there are not more suppliers than buyers, the existing suppliers are enormous in size. They all have sizeable resources to employ threatening competitive moves than can come to affect other companies’ profitability negatively. Hence, competition can be a threat for Apple. 3. Steve Jobs Death The death of Apple’s founder Steve Jobs will possibly have a negative effect on the company’s future. Steve Jobs reinvented Apple and brought it back from the brink of insolvency in 1997. He has been an integral part of the design of all the Apple products over the last decade. Analysts speculate on the effect this could have on rivals, and weather this will work as an opportunity for competitors to catch up with Apple’s technological superiority (Kim, M. et al, 2011 para. 1). Key Resources & Competencies. Apple’s resources, both tangible and intangible, have allowed them to gain a competitive advantage in multiple areas.
  • 28. · As of December 2011, Apple reported $138,681 million in total assets and $25,922 in net income. · Apple undeniable influence in the technological world has changes how people see technology, and the list of technological advancement is endless. Some examples are Mac OS X, the iPad, iPhone, and iTunes. · Apple’s human resources (HR) team, with its diverse employee base, has added enormous value to the company throughout its history. Steve Jobs exceptional business approach was evidently one of the most important, if not the most important, resource they ever had. · Apple’s retail locations, which are rare in the PC industry, have added tremendous value to the company’s success. Even though speculators were extremely pessimistic when the first store opened, Apple has shown otherwise. Apple makes approximately $5,626 per square foot of floor space in stores annually, making them by far the most profitable retailer in the U.S. Second to Apple was Tiffany & Co, with sales of $2,974 per square foot (Reisinger, 2011 para. 2-3). · Innovative design and technology is definitely their most significant core competence, and the reason why they are realizing enormous returns, year after year. The “Think Differently” advertising campaign illustrates this core competence. · Apple’s well-known reputation and brand loyalty is a key resource that takes years to build up. This is evident when their logo was valued, in 2011, to $39.3 billion. Competitive Strength Assessment Table 1 demonstrates a weighted competitive strength assessment of Apple’s two closest rivals, Dell and HP. TABLE 1. Leadership and Corporate Culture Apple’s solid corporate result driven culture and leadership
  • 29. have clearly promoted successful strategy implementation and execution. Many would agree that the legend, Steve Jobs, is the primary reason for the Apple’s success. According to Denny Strigl, Steve Jobs “created, lived and drove Apple’s culture” (para.2). All managers of Apple clearly want to improve their customer’s existence, and they also “live” the company’s culture (Strigl, 2011). Steve Jobs’ description of Apple’s corporate culture was “that of a startup” (Merchant, 2010, para.1). It is mimicking the entrepreneurship and innovation characteristics of any new business, as well as the superior products, velocity, and growth. What Jobs did to Apple right before its potential collapse in the end the 1990’s, was something historical. He gave all focus on establishing a high- performance culture. This was done in three ways. First, Jobs changed Apple’s strategy to a “one-thing” strategy, which meant that he got rid of certain business segments, even profit generating ones. Jobs also encouraged more debates when developing new ideas, at the same time as eliminating any earlier passive-aggressiveness. Finally, he imposed cohesion in all operational stages throughout the company, from concept to product to sales (Golson, 2011). Financial Analysis One of the most accurate tools to evaluate how well a company’s strategy is working, is by analyzing the company’s financial statements and comparing the numbers with benchmarks. This does not only allow us to see if the company has achieved strategic success, but it let us see whether the company has successfully accomplished the corporations primary goal to maximize shareholders wealth. A detailed ratio analysis will be presented, containing Apple’s finances between FY2008-FY2010. Three benchmarks, Dell, HP, and Lenovo, will be used to evaluate whether Apple is above or below close rivals in the PC industry. All graphs related to the financial analysis are in Appendix A. Profitability & Leverage Ratios
  • 30. In order to see how Apple is performing in terms of its ability to generate profit, a number of profitability ratios are assessed and evaluated. As shown in Figure 13, Apple had a gross profit margin of 39%, 40%, and 35% for 2008, 2009, and 2010, respectively. This figure was almost double its closest rival, HP, for all three years. Figure 14 reveals Apple’s operating profit margin, and it is significantly higher than its rivals, with a positive trend line from 2008 to 2010. This indicated that Apple has a favorable position when it comes to paying off their fixed costs. The company’s profit margin (PM) (Figure 15) from 2008-2010 is also significantly higher than all of the benchmarks. It is worth mentioning here that one reason for Apple’s high profit margin is because they have no long-term debt, and therefore no interest expense. The profitability of the entire enterprise, measured by the PM also shows a positive trend line from 2008-2010. This indicated that Apple’s overall operations are efficient relative to the benchmarks. Return on Asset (ROA) (Fig 16), shows how efficient management is at using its assets to generate earnings. Apple’s ROA is also here showing a positive trend from 2008-2010, and relative to its rivals, Apple’s management team have efficiently succeeded to allocate its resources. Apple’s return on equity (ROE) (Fig 17), which indicates the company’s return on the owners’ investment, was 42%, 26%, and 29% in 2008, 2009, and 2010, respectively. Relative to its rivals, Apple is outperforming all of them in 2010, but comes only at second place, after Dell, in 2008 and 2009. Also, there is no specific trend that can be seen over the three years. A more extensive analysis needs to be made in order to see why Apple is showing this relative inefficiency and inconsistency in its ROE. In order to do so, a so-called DuPont analysis is executed. It is an expression that breaks down ROE into three components, PM, total asset turnover (TATO), and equity multiplier (EM). As already established, Apple’s PM is well above its benchmarks, and this indicates the company’s efficiency in
  • 31. generating profits, therefore it is not the cause to the firm’s low ROE. As illustrated by Figure 18, Apple’s TATO is below all of its benchmark companies. This ratio demonstrates how many times the profit margin is earned each year, and Apple’s relatively low TATO indicates that the firm may have an asset management problem and are not utilizing its assets as efficiently as its benchmarks. Finally, Apples EM (Fig 19) is also lower than its benchmarks for all three years, and there is no clear trend line going in any one direction. This relatively low EM indicates lower financial leverage, and this once again has to do with Apple’s lack of interest expense. Other financial ratios that further prove Apple’s unleveraged approach are their debt-to-equity ratio (Fig.20) as well as their debt-to-asset ratio (Fig.21). This approach eliminates the firm’s risk of going bankrupt. Conclusively, there are mainly two reasons why Apple has a lower ROE in comparison to Dell: a low TATO ratio as well as a low EM. Hence, this does not necessarily need to be seen as a negative thing, because of primarily two reasons. First, a company that has a high PM along with a low TATO, ultimately have a so called “consumer advantage”. For Apple, this consumer advantage can come from a number of different sources. One is their strong brand name, which in turn allows them to charge premium prices for niche products. This consumer advantage also comes from the company’s ability to take advantage of economies of scale (Meier, 2010). The second reason to why Apple’s ROE is low, but not necessarily bad, is because their low EM will inevitably push down their ROE. Hence, a low EM simply means that the company does not use much debt to finance its operations, which in turn means that the company is operating with less risk of going into default. Liquidity Ratios In order to appraise Apple’s ability to pay off short-term debt obligations, three liquidity ratios will be evaluated: current ratio (Fig. 22), quick ratio (Fig. 23), as well as its working
  • 32. capital (Fig. 24). Apple’s current and quick ratios are well above its benchmarks, in all three years. As for both ratios, the values went up slightly from 2008-2009, but fell 0.7x the following year. Hence, even with this latter decrease, Apple’s ability to meet creditor’s demands is still significantly larger than the benchmarks. As shown by Figure 24, Apple’s working capital has been stable between 2008-2010, and drastically higher than its benchmark companies. This further supports proof that Apple clearly has the ability to pay off short-term creditors. Overall, Apple does not seem to have any problem when it comes to their ability in paying off short-term obligations. Activity Ratios The final class of financial metrics that will be analyzed is activity ratios, which illustrates a company’s ability to convert its balance sheets accounts into sales. Days of inventory (Fig. 25), inventory turnover ratio (Fig. 26), and average collection period (Fig. 27) are some of those ratios. Days of inventory ratio estimates how long it takes for the firm to turn its inventory into cash. Apple and Dell have significantly lower measures than HP and Lenovo. Hence, Apple lacks a preferably negative trend between 2008-2010. The second metric, inventory turnover ratio, shows how many times the company’s inventory is sold and replaced over the year. Apple’s relatively high inventory turnover in comparison to its benchmarks implies strong sales and healthy inventory levels. Hence, even though there was a dip of approximately 32% from 2009-2010, it does not imply ineffective buying because the benchmarks ratios overall trend was the same as Apple’s. The average collection period ratio shows whether the company is effective in collecting payments from customers, in terms of account receivables. As illustrated in Figure 28, Apple’s average collection period was the same in 2008 and 2009, but increased by 0.03x the following year. Hence, in 2010, Apple had the largest collection period in comparison to its rivals. This implies that Apple may take too long to turn its receivables
  • 33. into cash. Overall, Apple’s ability to convert its balance sheets accounts into sales are relatively weak in comparison to its benchmarks, due to their days of inventory negative trend between 2008- 2010 as well as their relatively high average collection period. Recommendations Even though Apple are financially preforming above average in the PC industry, proven by the financial analysis, it does not mean there is no room for improvements. Ultimately, there is no need for radical changes in the company’s strategic approach, but a number of recommendations will be given in regards to their operations in order for them to further keep improving and prospering as one of the most successful companies in the world and for to secure their strategic success. Aggressive Expansion Outside the U.S. Between 2010 and 2011, Apple’s sales in Europe, Japan, and Asia-Pacific grew 49%, 37%, and 175%, respectively. Retail net sales grew 44% (Apple Inc., Form 10-K, 2011 p.30). According to these historical sales figures, Apple could earn large revenues by expanding their already established retail segment and operations outside the U.S. As of 2010, approximately only 28% of Apple’s retail stores are located outside the U.S. Apple would be able to earn even more revenue if they aggressively expanded their already established retail base in emerging markets such as China and India. Elimination of Product Bottlenecks One of Apple’s weaknesses is the fact that they have actually less market share than rivals, if the iPad were taken out of the equation. This could be improved by taking advantage of opportunities in the external environment. The opportunity being the changing customer expectations philosophy of “access everything, everywhere”. Recognizing and removing current bottlenecks throughout the product line could achieve this (Figure 28). One example of a product that seems to negatively affect Apple’s sales is the iPod. The iPods net sale decreased by
  • 34. 12% between 2008-2009 and increased only 2% the following year (Apple 10-k, 2010). Hence, redirecting resources, such as R&D, from the bottlenecks to more efficiently revenue generating innovations, such as the iPad, could potentially result in larger overall profits and therefore increase the company’s market share. FIGURE 28 Apple’s Revenue Mix Source: Apple Business Model Is Iconic And Sustainable. (2011) Seeking Alpha Decrease Marketing Spending Apple has and always will be subject to external competitive threats. The company’s ability to remain successful is heavily depended on their ability in continuing to innovate new technologies and products. In order to do so, Apple needs to take advantage of its already established internal strengths, more specifically their core competence in innovation as well as their well established brand recognition and well known marketing capabilities. The company did spend $486, $501, and $691 million on advertising alone in 2008, 2009, and 2010, respectively. R&D for the same years was, $1,333, $1,782, and $2,429, respectively. Hence, efficiency could be improved by cutting costs in advertising at the same time as further increase spending in R&D, in an attempt to further secure their innovative competence. Apple’s brand name is already so incredibly strong that a cut in spending on that front would not hurt the company’s revenue by any significant amount. Aggressive sales to business segment Apple could take advantage of the opportunity of growth rate in the PC industry, to improve their relatively low sales figures to enterprises such as businesses and government. As of the last quarter in 2010, Apple’s Mac sales to businesses was only 3% (a 64.5% increase from the previous quarter) of their net sales,
  • 35. and as little as 1% (549.5% increase from the previous quarter) to government. Also, this was the 19th quarter that Mac sales have outgrown the overall market. Clearly, there is a potential for Mac sales increase, nonetheless to business and government, but the current percentages of sales to these entities are very small. Conclusively, if Apple were to aggressively promote their product to the business segment and the government, they could increase revenue significantly. This was a 66% increase from the previous year, as well as the highest figure since 1997 (Evans, 2011 para. 2). Appendix A: Financial Ratios Profitability Ratios FIGURE 13 FIGURE 14 FIGURE 15 FIGURE 16
  • 37. FIGURE 21 FIGURE 22 FIGURE 23 FIGURE 24 FIGURE 25
  • 38. FIGURE 26 FIGURE 27 References Hamilton, D. (2011, January 13). Top 10 company mission statements in 2012. Retrieved from
  • 39. http://drdianehamilton.wordpress.com/2011/01/13/top-10- company-mission-statements-in-2011/ Huzefa., Deepti, A.N., Gaurav, D., Vinay., &Singh, H. (2009). A strategic analysis of Apple Corporation.Retrieved from http://www.scribd.com/doc/11983566/A-Strategic-Analysis-of- Apple-Corporation Powell, K. Tech Tip 90 - An insanely great thirty years of innovation: A brief history of Apple Computers. Retrieved form http://www.geeks.com/techtips/2006/techtips-10aug06.htm Thompson Jr, A. A., Strickland III, A. J., Gamble, J.E., 2010, Crafting and executing strategy, New York, NY, McGraw-Hill Irvin. Jade, C. (2011, May). The Apple store at 10: Past, present, and future. Retrieved from http://gigaom.com/apple/the-apple- store-at-10-past-present-and-future/ Worldwide PC market (2010). eTForecasts. Retrieved from http://www.etforecasts.com/products/ES_pcww1203.htm Nusca, A. (Dec. 2008). Lenovo: PC industry consolidation coming, acquisitions possible. Zdnet. Retrieved from http://www.zdnet.com/blog/gadgetreviews/lenovo-pc-industry- consolidation-coming-acquisitions-possible/615 Vance, A. (July 2009). Acer’s chief urges more consolidation of the PC industry. The New York Times. Retrieved from http://bits.blogs.nytimes.com/2009/07/07/acers-ceo-urges-more- consolidation-of-the-pc-industry/ (October 2011). Consumer PC market weak, vendor consolidation underway. TechJournal. Retrieved from http://www.techjournalsouth.com/2011/10/consumer-pc-market- weak-vendor-consolidation-underway/ (2011). PC unit market share in U.S., Q2 201, Gartner: Apple Now 3rd Largest PC Vendor in the U.S. Gartner. Retrieved from http://news.softpedia.com/newsImage/Gartner-Apple-Now-3rd- Largest-PC-Vendor-in-the-U-S-2.png/ Elmer-DeWitt, P. (Jan. 2012). Snapshot of the computer market, with and without iPad. CNNMoney. Retrieved from http://tech.fortune.cnn.com/2012/01/13/snapshot-of-computer-
  • 40. market-with-and-without-the-ipad/ (2011). Market Environment of HP Company , Dell Inc., IBM Corporation, Apple Inc., Oracle Corp. Retrieved from http://dineshperspective.blogspot.com/2011/06/v- behaviorurldefaultvmlo.html Welker, J. (Jan. 2009). Product differentiation in imperfectly competitive markets – the MacBook Wheel. Retrieved from http://welkerswikinomics.com/blog/2009/01/28/product- differentiation-in-imperfectly-competitive-markets-the- macbook-wheel/ The Economist. The dream of the personal computer: The PC’s 25th birthday. 380(8488) July 29-August 4, 2006:17. Tung, L. (May, 2011). Tablet product differentiation easier than PCs. CRN. Retrieved from http://www.crn.com.au/News/258386,hp-exec-bets-touchpad- will-topple-ipad.aspxRen, Wengjian. (Jan. 2012). Wengjian Ren: Acer strive to become the first brand of ultra-extreme. Aicuxiao.org. Retrieved from http://www.aicuxiao.org/wengjian-ren-acer-strive-to-become- the-first-brand-of-ultra-extreme/ Dell. (July, 2011). Dell Efficient IT Solution s Growth Strategy Driving Its Stronger Financial Performance. Dell. Retrieved from http://content.dell.com/us/en/corp/d/secure/2011-0715- annualmtg-release HP enterprise services. (Jan. 2010). The New Edge: Differentiation Through Superior Customer Service. HP Inc. Retrieved from http://h10134.www1.hp.com/news/features/the-
  • 41. new-edge/ Simister, Paul. (Oct. 2011). Bargaining Power Of Suppliers : Uses & Abuses. Differentiate your business. Retrieved from http://www.differentiateyourbusiness.co.uk/bargaining-power- of-suppliers-uses-abuses GfxS, Staff. (Aug. 2011). JPR: Graphics shipments up 6.3% in second quarter; Intel increases market share. Graphic Speak. Retrieved from http://gfxspeak.com/2011/08/05/jpr-graphics- shipments-up-6-3-in-second-quarter-intel-increases-market- share/ Keaton, Kit. (May, 2011). Apple Takes A Bite Out Of Microsoft's PC Market Share, Browser Use. Fast Company. Retrieved from http://www.fastcompany.com/1751059/microsoft-slipping-pc- market-share-browser-use-being-munched-by-apple Arthur, Charles. (Oct. 2011) HP, Lenovo and Apple benefit as PC sales inch ahead in third quarter. The Guardian. Retrieved from http://www.guardian.co.uk/technology/2011/oct/15/hp- lenovo-apple-pc-sales-quarterly Garg, S. (2011). Feasibility of notebooks against desktops. Retrieved from http://www.scribd.com/doc/66696979/40/Product- Differentiation-Wider-Quality-Spectrum Dedrick, J., Kraemer, K. L. (May 2008). Globalization of Innovation: The Personal Computing Industry. Retrieved from
  • 42. web.mit.edu/is08/pdf/Globalization%20of%20Innovation%20PC .PDF Bayus, B. L., (1998). An analysis of product lifetimes: a technologically dynamic industry. Retrieved from http://www.jstor.org/pss/2634645 Hughes, N. (May 2011). Apple makes huge inroads in enterprise as corporate Mac sales surge 66%. Apple Insider. Retrieved from http://www.appleinsider.com/articles/11/05/20/apple_makes_hu ge_inroads_in_enterprise_as_corporate_mac_sales_surge_66.ht ml Barakat, M. (March 2008). Bill Gates: Expect 'rapid advance' in technology. USA TODAY. Retrieved from http://www.usatoday.com/tech/news/techinnovations/2008-03- 13-gates-tech-advances_N.htm Bailom, F., Matzler, K., Tschemernjak. D. (Nov 2007). Enduring Success: What Top Companies Do Differently. Google Books. Retrieved form http://books.google.com/books?id=Mns04Ys5YwgC&pg=PA48 &lpg=PA48&dq=experience+curve+effects+in+PC&source=bl& ots=xjj00C_k2I&sig=Lgom4WTujg1NnT3Njn7HO2gYWVw&hl =en&sa=X&ei=reEpT5O5EaqZiALX5p3TCg&ved=0CEsQ6AEw Bg#v=onepage&q=experience%20curve%20effects%20in%20PC &f=false Dignan, L. (Oct. 2011). Apple's R&D spending hits bottom as
  • 43. percentage of revenue. ZD Net. Retrieved from http://www.zdnet.com/blog/btl/apples-r-d-spending-hits-bottom- as-percentage-of-revenue/60872 Bauys, L. (Jun. 1998). An analysis of product lifetimes in a technologically dynamic industry. JSTOR. Retrieved from http://www.jstor.org/pss/2634645 29 Hruska, Joeal. (2008). 2009 to be a nightmare for PC industry, says analyst. Ars Technica. Retrieved from http://arstechnica.com/business/news/2009/03/2009-to-be-a- nightmare-for-pc-industry-says-analyst.arsChaneta, I. Role of situation analysis in strategy-making. Journal of Comprehensive Research, Volume 6, Page 39. Retrieved from jupapadoc.startlogic.com/compresearch/papers/JCR08- 5.pdfKanter, D. (2011). State of the PC 2011: an Technology Change Our Life Quarterly Report. Tech Life. Retrieved from http://www.917wy.com/business/news/2011/03/state-of-the-pc- 2011-an-ars-technica-quarterly-report.arsThompson, A. A., Strickland III, A. J., Gamble, J. E. (2010). Crafting and executing strategy: The quest for competitive advantage. New York, NY: McGraw-Hill/Irwin. Dexter, A. (Noc. 2011). 10 ways PCs will change over the next 25 years. Techradar. Retrieved from
  • 44. http://www.techradar.com/news/computing/10-ways-pcs-will- change-over-the-next-25-years-1040168Schroeder, Stan. (April 2010). Gartner: Most Kids Will Use PCs With Touchscreens by 2015. Mashable Tech. Retrieved from http://mashable.com/2010/04/07/50-percent-pcs-touchscreens/ Chan, C. (Jan. 2012). Why Apple Doesn’t Make the iPhone in America. Gizmodo. Retrieved from http://gizmodo.com/5878209/why-apple-doesnt-make-the- iphone-in-america Kingsley, H. A. (Jan. 2012). The PC industry is heading for collapse. ZD Net. Retrieved from http://www.zdnet.com/blog/hardware/the-pc-industry-is- heading-for-collapse/17828 Dilger, E. D. (Oct. 2010). Apple's 2010 ad budget increases by $190 million, but still outpaced by new sales growth. Apple Insider. Retrieved form http://www.appleinsider.com/articles/10/10/27/apples_2010_ad_ budget_increases_by_190_million_but_still_outpaced_by_new_ sales_growth.html Mick, J. (Nov. 2010). Survey: Apple "Smokes the Competition" in Quality, Reliability. Daily Tech. Retrieved form http://www.dailytech.com/Survey+Apple+Smokes+the+Competi tion+in+Quality+Reliability/article20280.htm Zibreg, C. (May. 2011). Feature: Retail stores, Apple's risky
  • 45. gamble that paid off big time. 9TO5Mac: Apple Intelligence. Retrieved form http://9to5mac.com/2011/05/19/feature-retail- stores-apples-big-gamble-that-paid-off-big-time/ Figure 4. Impressive Growth Continues for Tablet Computers: Average Annual Growth of 81% Forecast From 2010 Through 2015. (2012, January 13). Electronics.ca Publications. Retrieved form http://www.electronics.ca/presscenter/articles/1650/1/Impressiv e-Growth-Continues-for-Tablet-Computers-Average-Annual- Growth-of-81-Forecast-From-2010-Through-2015/Page1.html Fish, Russell. (2011, January 7). World Domination Through Vertical Integration. Venray Technology Ltd. Retrieved form https://www.venraytechnology.com/PaperWorld_Domination_V ertical_Integration.htm Chen, B. X. (2011, February 18). Why Nobody Can Match the iPad’s Price. Gadget Lab. Retrieved form http://www.wired.com/gadgetlab/2011/02/ipad-price/ Takahashi, Dean. (2011, August 18). With HP’s PC spinoff, vertical integration falls out of favor. Spotfire. Retrieved from http://venturebeat.com/2011/08/18/with-hps-pc-spinoff-vertical- integration-falls-out-of-favor/ Apple Inc, Form 10-K. (2010). Retrieved from http://sec.gov/Archives/edgar/data/320193/00011931251023804 4/d10k.htm Dell, Form 10-K. (2010). Retrieved
  • 46. fromhttp://content.dell.com/us/en/corp/d/corporate~financials~e n/Documents~fy10-year-in- review~FY10_Form10K_Final.pdf.aspx HP, Form 10-K. (2010). Retrieved from http://h30261.www3.hp.com/phoenix.zhtml?c=71087&p=irol- reportsAnnual Lenovo Inc, Form 10-K. (2010). Retrieved from http://www.lenovo.com/ww/lenovo/annual_interim_report.html Acer, Form 10-K. (2010). Retrieved from http://quicktake.morningstar.com/stocknet/secdocuments.aspx?s ymbol=acid&country=gbr About Lenovo. (2012). Retrieved from http://www.lenovo.com/lenovo/us/en/our_company.html About Acer. (2012). Acer Inc. Retrieved from http://us.acer.com/ac/en/US/content/company Core Technologies. (2012). Apple. Retrieved from https://developer.apple.com/technologies/mac/core.html Apple Inc, Form 10-K. (2011). Retrieved form http://investor.apple.com/secfiling.cfm?filingID=1193125-11- 282113&CIK=320193 Elmer-DeWitt, Philip. (2011, September 15). Apple's brand value rises to No. 2 in the world, after Google. CNN Money. Retrieved from http://tech.fortune.cnn.com/2011/09/15/apples- brand-value-rises-to-no-2-in-the-world-after-google/ Duhigg, C., Barboza, D. (2012, January 25). In China, Human
  • 47. Costs Are Built Into an iPad. The New York Times. Retrieved from http://www.nytimes.com/2012/01/26/business/ieconomy- apples-ipad-and-the-human-costs-for-workers-in- china.html?pagewanted=all Faas, Ryan. (2012, February 17). Apple’s New Annual Upgrade Cycle May Wreak Havoc On Schools. Cult of Mac. Retrieved from http://www.cultofmac.com/147273/apples-new-annual- upgrade-cycle-may-wreak-havoc-on-schools/ Brodkin, Jon. (2011, Februaty 2). Windows drops below 90% market share. NETWORKWORLD. Retrieved from http://www.networkworld.com/community/blog/windows-drops- below-90-market-share Reisinger, Don. (2011, August 24). Another Apple win: Retail sales per square foot. CNet News. Retrieved from http://news.cnet.com/8301-13506_3-20096519-17/another- apple-win-retail-sales-per-square-foot/Read more: http://news.cnet.com/8301-13506_3-20096519-17/another- apple-win-retail-sales-per-square-foot/#ixzz1ml0oIWWf Apple's Research And Development Advantage. (2011, November 21). Seeking Alpha. Retrieved from http://seekingalpha.com/article/309448-apple-s-research-and- development-advantage Kim, M., Jin. H. (2011, October 6). Without Jobs, Apple’s gap with rivals could narrow. Al Arabiya News. Retrieved from http://www.alarabiya.net/articles/2011/10/06/170466.html
  • 48. Berndt, T. J. (2002). Friendship quality and social development. Current Directions in Psychological Science, 11, 7-10. Strigl, D. (2011, October 12). The Apple Way: The Legacy of Steve Jobs’ Culture-Driven Organization. Managers, can you hear me now? Retrieved from http://managerscanyouhearmenow.wordpress.com/2011/10/12/th e-apple-way-the-legacy-of-steve-jobs%E2%80%99-culture- driven-organization/ Golson, J. (2011, September 11). Steve Jobs: Apple Almost Went Bankrupt Because It Failed to Innovate. MacRumors. Retrieved from http://www.macrumors.com/2011/09/19/steve- jobs-apple-almost-went-bankrupt-because-it-failed-to-innovate/ Meier, D. (2010, August 18). Here’s How Apple Creates Its Advantage. The Motley Fool. Retrieved form http://www.fool.com/investing/general/2010/08/18/heres-how- apple-creates-its-advantage.aspx Thomas, J. (2011, December 17). How Apple Reinvented the Tablet and the Changing Demographic of the iPad. Nexttag News. Retrieved from http://nextagnews.nextag.com/2011/12/17/how-apple- reinvented-the-tablet-and-the-changing-demographic-of-the- ipad/ Thormby, T. (2007, September 4). 'Think Different': The Ad Campaign that Restored Apple's Reputation. Low End Mac. Retrieved from http://lowendmac.com/orchard/07/apple-think-
  • 49. different.html Apple Business Model Is Iconic And Sustainable. (2011). Seeking Alpha. Retrieved from http://seekingalpha.com/article/298572-apple-business-model- is-iconic-and-sustainable Evans, J. (2011, May 23). Apple's Mac steals Windows enterprise sales. Computerworld. Retrieved from http://blogs.computerworld.com/18330/apples_mac_steals_wind ows_enterprise_sales Foresman, C. (2010). IDC: Big business giving Apple major sales boost. Ars Technica. Retrieved from http://arstechnica.com/apple/news/2011/02/apple-outgrows-pc- market-for-nearly-five-years-aided-by-enterprise.ars Gross Profit Margin Apple2010.02009.02008.00.3937753928708320.4013984384104 420.352004481075459Dell2010.02009.02008.00.175059544062 6060.1793260339437980.19091161892922HP2010.02009.02008 .00.2375885680734410.2359452475731550.244246561454496L enovo2010.02009.02008.00.1077988557663350.1206040268456 380.14983793040181 Operating Profit Margin Apple2010.02009.02008.00.2818704484476810.2736277823097 540.222106638926676Dell2010.02009.02008.00.041057048882 840.0522086381564950.056270753929956HP2010.02009.02008 .00.09107932049542580.08848383266987920.08848129498834
  • 50. 1Lenovo2010.02009.02008.00.0131887985546522- 0.01288590604026850.0305180111308177 Profit Margin Apple2010.02009.02008.00.2148409352242240.1919356718331 20.163212504334374Dell2010.02009.02008.00.0270878227666 2510.04055580105071930.0482063697184826HP2010.02009.02 008.00.06951354010457580.06686919477617150.07036767936 19682Lenovo2010.02009.02008.00.00776874435411021- 0.01516778523489930.0296617943856645 ROA Apple2010.02009.02008.00.1863852200630460.1733647712679 730.154629536035581Dell2010.02009.02008.00.042582907405 20630.09350943396226420.106930333817126HP2010.02009.02 008.00.07279342666441780.06956506589778650.07639569049 95104Lenovo2010.02009.02008.00.0214381420276909- 0.02567200241618850.0634700315457414 ROE Apple2010.02009.02008.00.2932142035111210.2602718078381 790.421070740434902Dell2010.02009.02008.00.254032972877 1490.5801919925076090.769451697127937HP2010.02009.0200 8.00.2148304357421350.1879109017760770.213882183760464 Lenovo2010.02009.02008.00.0803237858032378- 0.1725190839694660.221851145038168 TATO Apple2010.02009.02008.00.8675498450447570.9032441422285
  • 51. 860.94741231173557Dell2010.02009.02008.01.5720313800071 312.3056981132075422.218178519593614HP2010.02009.02008 .01.0122888605093860.9978484133137061.044409737847544L enovo2010.02009.02008.01.8540643144260832.2500755058894 62.063217665615144 Equity Multiplier 2010.02009.02008.01.5731623108953571.501295828065741.88 16928197812662010.02009.02008.05.965608934586076.204635 9166471457.195822454308094HP2010.02009.02008.03.078024 1785952682.8333539008317482.910251142725078Lenovo2010. 02009.02008.01.9346201743462042.3351145038167944.673899 566026027 Debt-to-Equity-Ratio Apple2010.02009.02008.00.5731623108953560.5012958280657 40.881692819781265Dell2010.02009.02008.04.9656089345860 75.2046359166471456.195822454308094HP2010.02009.02008. 02.0780241785952681.8333539008317521.910251142725078Le novo2010.02009.02008.04.5765877957658824.05110602593440 13.67389956602604 Debt-to-Asset-Ratio Apple2010.02009.02008.00.3643376827208280.3339087598155 830.468563630850096Dell2010.02009.02008.00.832372518721 0270.8388301886792450.861030478955007HP2010.02009.0200 8.00.6751162622587410.6470613855521390.656387043262655 Lenovo2010.02009.02008.00.3459929192146780.404380516508
  • 52. 6630.786045894680993 Current Ratio Apple2010.02009.02008.02.0112923462986192.7424821832087 522.461680386034628Dell2010.02009.02008.01.278744725738 3971.3561477892186561.072854830005397HP2010.02009.0200 8.01.0967754994635961.2217519707927350.977124615123067 Lenovo2010.02009.02008.01.5153846153846131.504469987228 6081.044739022369511 Quick Ratio Apple2010.02009.02008.01.9605733037351612.7029375977750 762.425560601759864Dell2010.02009.02008.01.223312236286 921.2977993135473431.009174311926605HP2010.02009.02008 .00.9658927595490161.0792502848638480.828292940932015L enovo2010.02009.02008.00.3884615384615380.9297573435504 470.947183098591549 Working Capital Apple2010.02009.02008.020956.020049.020598.0Dell2010.020 09.02008.05285.05292.01350.0HP2010.02009.02008.04781.095 36.0-1211.0Lenovo2010.02009.02008.0402.0395.0216.0 Days of Inventory Apple2010.02009.02008.09.701702030803476.46633960207141 7.646102559881465Dell2010.02009.02008.08.79024312000180 26.3109245373324638.707694796005014HP2010.02009.02008. 024.5615002757858825.5555047758329232.14875802088226Le novo2010.02009.02008.021.6314546068174412.5352972601694
  • 53. 310.86802927075448 Inventory Turnover Ratio Apple2010.02009.02008.037.6222645099904456.446153846153 9147.73673870333993Dell2010.02009.02008.041.52331113225 50557.8362168396770541.91694915254222HP2010.02009.0200 8.014.8606557377049314.2826370757180311.35347125269705 Lenovo2010.02009.02008.016.8735763097949929.11777777777 77933.58474576271185 Average Collection Period Apple2010.02009.02008.00.1513035523707880.1168708111855 790.124260355029586Dell2010.02009.02008.00.109580040174 9680.07696938144665340.125050817139605HP2010.02009.020 08.00.1462127565309580.1439038610475390.14257679252752 1Lenovo2010.02009.02008.00.08297483646649770.0461155508 9741910.0676597272074659 KSF/Strength Measure Importance Weight Strength Rating Score Strength Rating Score Strength Rating Score Technology
  • 54. 0.25 8 2.00 8 2.00 8 2.00 Skills 0.15 9 1.35 7 1.05 7 1.05 Effective cost control 0.25 10 2.50 2 0.50 5 1.25 Innovation 0.25 10 2.50 5 1.25 5 1.25 Marketing 0.10 10 1.00 6 0.60 6 0.60 Sum of importance Weight 1.00 Weighted overall strength rating 47 9.35 28 5.40 31 6.15 Dell HPApple Inc. Weighted Competetive Strength Assessment
  • 55. KSF/StrengthMeasureImportanceWeightStrengthRatingScoreStr engthRatingScoreStrengthRatingScore Technology 0.25 82.00 82.00 82.00 Skills 0.15 91.35 71.05 71.05 Effectivecostcontrol 0.25 102.50 20.50 51.25 Innovation 0.25 102.50 51.25 51.25 Marketing 0.10 101.00 60.60 60.60 SumofimportanceWeight 1.00 Weightedoverallstrengthrating 479.35 285.40 316.15 Dell HPAppleInc. WeightedCompetetiveStrengthAssessment ATT00001 ATT00002 Presentation Rubrics instructions .docx Presentation Rubrics Topic Comments Score Basic Company Information · Brief company history and information
  • 56. · Hambrick Model · Vision and mission Please follow the same order when you do the power points Vision is not found in power points (20) Industry and Competitive Analysis · Industry Characteristics · Porter’s 5 Forces · Key Success Factors · Driving Forces · Identify Major Competitors (this should be on one of the slides and it has to be 3) · Strategic Map · Summary of Industry Prospects
  • 57. (45) Strategic Position · SWOT Analysis · Competitive Strength Assessment · Company Resources/Competencies · Leadership and Corporate Culture · Tie to Strategy Execution · Financial Performance · 3 Year Analysis · Created own charts/graphs/maps · Summary of Competitive Position
  • 58. (45) Group Recommendations · Conclusions · Recommendations · Rigorous Arguments · Stock Purchase (20) Please change the presentation rubrics.pdf