
Recommandé
Recommandé
Contenu connexe
Tendances
Tendances (19)
En vedette
En vedette (15)
Similaire à H0352046053
Similaire à H0352046053 (20)
Dernier
Dernier (20)
H0352046053
- 1. International Journal of Engineering Science Invention ISSN (Online): 2319 – 6734, ISSN (Print): 2319 – 6726 www.ijesi.org Volume 3 Issue 5ǁ May 2014 ǁ PP.46-53 www.ijesi.org 46 | Page Assessment of Biomass Carbon Stock in a Tectona Grandis Linn F. Plantation Ecosystem of Uttarakhand, India 1, Nishita Giri , 2, Laxmi Rawat , 3, Pramod Kumar 1,2,3 Forest Ecology and Environment division, FRI, Dehradun ABSTRACT : The article presents biomass carbon stock for a Tectona grandis plantation in Dehradun Forest Division, Uttarakhand, India. Destructive sampling was used to calculate the biomass of T. grandis and undergrowth vegetation (shrubs and herbs); volumetric equations were used for estimating the biomass of associated tree species. The total biomass of T. grandis was calculated as 147.50 t ha-1 with above ground biomass (AGB) 121.88 t ha-1 and below ground biomass (BGB) 25.62 t ha-1 . The total biomass of the five associated tree species was estimated as 65.62 t ha-1 (AGB 51.06 and BGB 14.56 t ha-1 ). The total biomass of shrub and herb species was calculated as 2.218 and 0.773 t ha-1 , respectively. Litter biomass was calculated as 2.104 t ha-1 . The estimated total biomass of the whole ecosystem (218.22 t ha-1 ) was obtained as the sum of these component biomass values. Carbon content of the main tree species, associated tree species, and understory vegetation (shrubs+herbs), was estimated in AGB pool (80.48 Mg ha-1 ) and BGB pool (18.75 Mg ha-1 ), and added to the litter carbon (0.86 Mg ha-1 ) and soil organic carbon (SOC) (41.12 Mg ha-1 ) to estimate the carbon stock in the whole ecosystem (141.21 Mg ha-1 ). The SOC to AGB ratio was 0.51. KEY WORDS: Biomass, carbon stock, litter, Tectona grandis Linn f. plantation ecosystem, above ground biomass and below ground biomass. I. INTRODUCTION Plantations or naturally regenerated trees can protect watersheds against droughts, flash floods or landslides thought to be more prevalent due to climate change. Sustainable forestry practices can increase the ability of forests to sequester atmospheric carbon, while simultaneously enhancing other ecosystem services, such as improved soil and water quality. Carbon sequestration is also a good indicator of the health and functioning of ecosystems. Forests may help local communities to cope with climate change in a numerous ways (Robledo and Forner, 2005). Forests play a major role in the global carbon budget because they dominate the dynamics of the terrestrial carbon cycle. Studies are currently afoot for assessing the use of forest biomass sinks to sequester carbon as part of a global mitigation effort (Sedjo and Toman, 2001). Globally, teak ranks third among the tropical hardwood species in plantation areas and constitutes about 8 per cent of the plantations (Pandey and Brown, 2000). Teak is also suitable for multiple end uses, including construction, furniture and cabinets, railway sleepers, decorative veneer, joinery, ship and vehicle body building, mining, reconstituted timber, etc. (Bhat, 2000). Today, teak ranks among the top five tropical hardwood species in terms of plantation area established worldwide (Krishnapillay, 2000).Above ground Biomass (AGB) has been given the highest importance in carbon inventories and in most mitigation projects and is the most important pool for afforestation and reforestation CDM projects under the Kyoto Protocol. However, below Ground Biomass (BGB) has been shown to be an important carbon pool for many vegetation types and land-use systems and accounts for about 20% (Santantonio et al., 1997) to 26% (Cairns et al., 1997) of the total biomass. BGB accumulation is linked to the dynamics of AGB. The greatest proportion of root biomass occurs in the top 30 cm of the soil surface (Bohm, 1979; Jackson et al., 1996). The carbon (C) sequestration potential of a forest ecosystem depends on initial soil organic carbon (SOC) content, stand growth rates, biological carrying capacity of the stand, stand age, and product utilization. In particular, C sequestration and storage may be increased significantly, if forests are harvested and trees are converted into wood products (Skog and Nicholson, 1998). Some researchers suggest that sequestration of C in tree biomass and litter is a delaying tactic that only buys time for finding more permanent solutions for C sequestration (IPCC, 2000). Making an effort to maximize the productivity of the restored forest is also worthwhile because forest C pools can vary five-fold within a local edaphic gradient as a function of site quality (Burger and Zipper, 2002). The article presents stand level or ecosystem level estimates of biomass by component. This is the first report of carbon stock / carbon pool estimation in AGB, BGB of all existing vegetation and litter, as well as soil organic carbon (SOC) at ecosystem level in India.
- 2. Assessment Of Biomass Carbon Stock In… www.ijesi.org 47 | Page II. MATERIAL AND METHODS Study area This study was conducted in a 28 year old T. grandis plantation in Jakhan block, Barkot Range of Dehradun Forest Division, Uttarakhand, India (Map 1), nearly 25 km east of Haridwar and 30 km South east side of Dehradun city. The area lies in the subtropical region at an altitude of 449 m msl with 3004’37.2’’N latitude and 7812’11.1’’E longitudes. It has a very gentle slope with a south aspect. The maximum, minimum and mean temperature of the area (1980-2010) were 28.11°C, 13.52°C and 20.32°C, respectively. The mean annual rainfall during this period was 1901.03 mm when averaging monthly and approximately 80% of the rainfall occurred during the South-west monsoon period (June to September) (Figure 1). Map 1. Study site SOIL ANALYSIS Texture It is the proportion of particle size distribution (soil texture) into classified grades expressed as percentage of sand, silt and clay. After air drying of samples, big stones were removed and the soil was passed through 2 mm sieve. Part of the soil samples having particle size less than 2 mm were subjected for texture analysis by Hydrometric method (Black, 1965) and percentage of different fractions namely: sand, silt and clay was estimated in each sample and textural class was determined using the Triangular diagram by U.S.D.A (Black, 1965). Soil moisture Soil moisture percentage (%) was measured by means of moisture meter Fig. 1 Ombrothermic graph of rainfall, mean, maximum and minimum temperature for 30 years (1980-2010) Soil bulk density
- 3. Assessment Of Biomass Carbon Stock In… www.ijesi.org 48 | Page A metal core cylinder (by core sampler) of known weight and volume was used to determine the soil bulk density (Wilde et al., 1985). Soil bulk density was determined by the following expression: Bulk density (g cm3 ) =W1-W2/V Where, W1= weight of cylinder + weight of soil, W2 = weight of empty cylinder, V= volume of cylinder Biomass estimation of T. grandis The stratified tree technique method of Art and Marks (1971) was used to harvest the sample trees. Temporary sample plots (30 m × 30 m) were laid out in the plantation and the diameter at breast height (DBH at 1.3 m) of all the standing trees were recorded within the sample plots. The DBH range was divided into four different diameter classes that is, 5 to 15 cm, 15 to 25 cm, 25 to 35 cm and 35 to 45 cm from which 2 trees were harvested from 5 to 15 cm diameter class, 2 trees from 15 to 25 cm, 3 trees from 25 to 35 cm and 2 from 35 to 45 cm and in this way 9 representative sample trees were selected for the study. The tree components (leaves, twigs, branches, bark, bole and roots) were separated immediately after felling and their fresh weights recorded. Samples of all tree components (100 g of each component) were selected for oven dry weight estimation and chemical analysis for C content. The bole of each sample trees was cut into 2 m long sections (billets) for convenience of weighing. Biomass estimation for the associated tree species Biomass of the associated tree species (Aegle marmelos, Mallotus phillippensis, Syzygium cumini, Terminalia bellerica and Eucalyptus hybrid) was estimated using the volumetric equations of the Forest Survey of India (FSI, 1996). Estimated volumes were multiplied by the density of the corresponding wood following the methods of Chaturvedi and Khanna (1982) to get the dry weight stem biomass. The biomass of branches and leaves were estimated using 45 and 11% of the stem biomass, respectively, as per Sharma (2003). BGB was estimated using the root-shoot ratios (R:S) of these species (FAO, 2000); (Table 1). Total biomass per tree was obtained by summing AGB and BGB for each sample tree and averaging over the sample. The total biomass per ha for each of these species was estimated by multiplying the average biomass per tree by the trees per ha for each of the species (10 tree ha-1 for Aegle marmelos, 10 tree ha-1 for Mallotus phillippensis, 30 tree ha-1 for Syzygium cumini, 10 tree ha-1 for Terminalia bellerica and 30 tree ha-1 for Eucalyptus hybrid). C was estimated as 43% of the total biomass (Negi et al., 2003). Table 1: Volumetric equations and root shoot ratio (R:S) used for estimation of biomass of associated tree species S. No. Tree species Volumetric equations* R : S** 1 Eucalyptus hybrid V= 0.02894-0.89284 D+8.72416 D2 0.30 2 Aegle marmelos V/D2=0.007602/D2-0.033037/D + 1.868567 + 4.483454D 0.27 3 Mallotus philippensis V= 0.14749-2.87503 D+19.61977 D2-19.11630 D3 0.30 4 Syzygium cumini √V= -0.05923+2.33654 D 0.27 5 Terminalia bellerica √V= - 0.14325+3.07937 D 0.27 V=volume, D= diameter Biomass estimation of understory vegetation Ten quadrats of 3 m×3 m and 1 m×1 m were laid out for shrubs and herbs, respectively. Complete harvesting of all shrub and herb species present in all quadrats was done; the plant materials were separated into above and below ground portions. Fresh and dry weights were measured for biomass and C was estimated according to the methodology given earlier. Biomass values were then multiplied by an expansion factor to scale them to a one hectare area. Estimation of litter biomass Litter biomass was estimated by laying out ten 5 m × 5 m sample plots in the plantation. Litter samples were collected on these sample plots and a fresh and an oven dry weight at 80°C (until a constant weight was achieved) were obtained. The litter was ground for chemical analysis to estimate C content.
- 4. Assessment Of Biomass Carbon Stock In… www.ijesi.org 49 | Page Estimation of carbon in T. grandis trees, shrubs, herbs, litter and soil organic carbon (SOC) Samples of all three parts of T. grandis trees, shrubs, herbs and litter soil were analyzed for C content using Wakley and Black's titration method (Jackson, 1967). For estimation of SOC, soil samples were taken from the surface to 90 cm depth (in three depth classes of 0 to 30 cm, 30 to 60 cm and 60 to 90 cm) from randomly selected points in the plantation area. Three replicates from each point were collected. III. RESULTS AND DISCUSSION Floristic struture In the plantation, T. grandis showed the maximum density (510 ha-1 ) followed by Syzygium cumini and Eucalyptus hybrid (30 ha-1 ) and Aegle marmelos, Mallotus philipensis and Terminalia bellerica (10 ha-1 ). Physical attributes of soil Soil texture was observed to be sandy loam in nature, soil moisture was higher (9.220%) in the deepest layer that is, 60 to 90 cm depth, lower (7.586%) in uppermost layer that is, 0 to 30 cm depth. The trend of bulk density in soil depths was in the order 60 to 90 cm > 30 to 60 cm > 0 to 30 cm (Table 2). Table 2: Moisture, Bulk density and Texture of soil at different depths under T. grandis plantation. Biomass of T. grandis species The DBH and heights of the nine sample trees varied from 9.2 cm to 38.2 cm and 11.75 m to 23.95 m, respectively. This variation in the total tree biomass which ranged from 26.34 to 739.37 kg tree-1 . The other tree components ranged from: bole, 12.36 to 466.09 kg; leaves, 1.12 to 24.53 kg; twigs, 1.22 to 18.70 kg; branches, 4.37 to 123.75 kg; bark, 4.20 to 21.28 kg; and roots 3.07 to 127.36 kg. The total biomass of T. grandis trees was estimated at 147.50 t ha-1 , of which the AGB comprised 121.88 t ha-1 and the BGB comprised 25.62 t ha-1 . The highest percentage of total biomass was found in boles (55.30%), followed by roots (17.37%), branches (17.14%), bark (3.99%), leaves (3.27%) and twigs (2.94%). The percentage contribution to the total biomass varied among dbh classes: 5 to 15 cm, 3.26%; 15 to 25 cm, 15.24 %; 25 to 35 cm, 43.59%; and 35 to 45 cm, 37.90%. Biomass of associate tree species The biomass values of Aegle marmelos, Mallotus phillippensis, Syzygium cumini, Terminalia bellerica and Eucalyptus hybrid were estimated as product of wood density (kg/m3 ) and volumes using volumetric of FSI (1996). The biomass estimated for the Aegle marmelos was 11.9 t ha-1 , for Mallotus phillippensis was 4.8 t ha-1 , for Syzygium cumini was 7.06 t ha-1 , for Terminalia bellerica was 14.66 t ha-1 and for Eucalyptus hybrid was 27.2 t ha-1 . Understory biomass The shrub species present in the plantation ecosystem were Adhatoda vasica, Lantana camara, Terminalia bellerica sapling , Murraya koenigii, T. grandis saplings, Syzigium cumini sapling, Limonia acidissim, Cudrania javanensis and Clerodendron serratum. Herb species were Ageratum conyzoides, Sida cuta, Oxalis corniculata, Rundia pectinata, Cyperus esculentus, Oplismenus compositus, Achyranthus aspera, Cynodon dactylon, Limonia acidissim seedling, Syzigium cumini seedling, Ichinocarpus frutescens, Murraya koenigii seedlings, Adiantum caudatum fern, Jusicia adhatoda seedling and Achyranthes aspera. The AGB of shrubs was 1.316 t ha-1 and the BGB was 0.902 t ha-1 . The total shrub biomass was 2.218 t ha-1 . The herb biomass was 0.773 t ha-1 (AGB 0.495 t ha-1 and BGB 0.278 t ha-1 ). The total understory biomass (shrub and herb) was estimated at 2.991 t ha-1 . Total litter biomass estimated as 2.104 t ha-1 . Total biomass estimation Total biomass of the whole ecosystem was estimated at 218.22 t ha-1 , which is the sum of the biomass of main tree species that is, T. grandis, the biomass of associated tree species, shrub, herb biomass and litter biomass (Table 3). S. No. Depths (cm) Moisture (%) BD (g cm-3 ) Texture (Sandy loam) Sand (%) Silt (%) Clay (%) 1 0-30 7.586 ± 0.080 1.184 ± 0 .003 50.57 ± 0.145 27.17 ± 0.433 22.27 ± 0.291 2 30-60 8.403 ± 0.126 1.213 ± 0.002 52.0 ± 0.400 26.13 ± 0.549 21.87 ± 0.914 3 60-90 9.220 ± 0.095 1.223 ± 0.002 52.47 ± 0.348 25.37 ± 1.538 22.17 ± 1.633
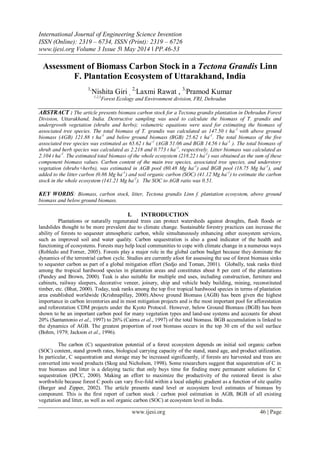
- 5. Assessment Of Biomass Carbon Stock In… www.ijesi.org 50 | Page Table 3: Total Biomass distribution (t ha-1 ) among different components of T. grandis plantation ecosystem S. No Components T. grandis Associated tree species Shrubs Herbs Litter Total 1 Above ground 121.88 51.06 1.316 0.495 2.104 176.86 2 Belowground 25.62 14.56 0.902 0.278 - 41.36 3 Total Biomass 147.50 65.62 2.218 0.773 2.104 218.22 The biomass contribution of the main tree species, associated tree species, shrubs and herbs to the total AGB and BGB was 67.59% for T. grandis trees, 30.07% for associated tree species, 1.02% for shrubs, and 0.35% for herbs. Figure 2. (a) and (b) depicts the AGB and BGB contribution (%) separately for these components. Litter contributed 1.2%. Fig. 2 (a): AGB (%) contribution of different components of the ecosystem (b): BGB (%) contribution of different components of the ecosystem Carbon content / carbon pool T. grandis tree species The total C content (t ha-1 ) in the different T. grandis tree components were: 39.22 (boles), 12.0 (roots), 11.95 (branches), 2.34 (bark), 2.19 (leaves), and 2.01 (twigs). The amount of C content contributed by T. grandis trees was 69.71 t ha-1 . Associated tree species Total C content in associated tree species was 28.23 t ha-1 , of which 21.96 t ha (77.79%) was contributed by AGB and 6.27 t ha-1 (22.21 %) by BGB.
- 6. Assessment Of Biomass Carbon Stock In… www.ijesi.org 51 | Page Understory vegetation Understory vegetation (shrubs+herbs) contributed 1.29 t ha-1 to the C pool. For shrubs 46.51% of the C was in the above ground material and 28.68% was in the below ground material. For the herb layer 16.28% of the C was in the above ground material and 8.53% in the below ground material. Litter contains 0.86 t ha-1 of total C content (Table 4). Soil Organic Carbon (SOC) Soil Organic Carbon was estimated as 41.12 t ha-1 . Total Carbon stock The total C stock calculated was 141.21 t ha-1 of which 49.37% was contributed by T. grandis trees, 19.99% by associated tree species, 0.69% by shrubs, 0.23% by herbs, 0.61% by litter and 29.12% contibuted by soil (Table 3). Table 4: Carbon stock (t ha-1 ) in different pools of T. grandis plantation ecosystem Carbon Pools Total C AGB C BGB C Litter C SOC Main tree species T. grandis 57.71 12.00 69.71 Associate species (1) Aegle marmelos 4.03 1.09 5.12 (2) Eucalyptus hybrid 8.99 2.71 11.70 (3) Mallotus philippensis 1.59 0.48 2.07 (4) Syzygium cumini 2.39 0.65 3.04 (5) Terminalia bellerica 4.96 1.34 6.30 28.23 Understory vegetation (1) Shrubs 0.60 0.37 0.97 ( 2) Herbs 0.21 0.11 0.32 1.29 0.86 0.86 41.12 41.12 Grand total 80.48 18.75 0.86 41.12 141.21 Contribution of roots to the total plant biomass ranged from 12% at 15 years of age (15 cm gbh) to 29.8% at 40 years of age. Crown dry weight found to be maximum (47-18%) between 20-40 years of age, almost similar findings were also observed in the present study, which showed 17.37% contribution by root. Singh and Misra (1978) also reported the root biomass (3287 kg ha-1 ) contributed 23% of the above ground and 19% of the total biomass of the stand. Prasad and Mishra (1984).Rana and Singh (1990) showed that the understory (shrubs+herbs) accounted for 1.5% of the total forests biomass (432.8 t ha-1 ) in a Pinus roxburghii plantation located in Kumaun Himalaya of Uttarakhand. Mac Lean and Wein (1977a) found that understory biomass in Pinus banksiana ranged from 1 to 6% of the ecosystem biomass in old stands. Per cent contribution of understory to the total biomass in this study was 1.37%. Negi (1984) reported 2.3 and 0.9% understory biomass contribution to the total stand tree biomass in Shorea robusta (sal) forest and Eucalyptus hybrid plantation ecosystems, respectively.The maximum concentration of C was estimated in the bole (55.30%) followed by other tree components and minimum concentration was in the twig (2.94%). Similar findings has been reported by Kraenzel et al. (2003) and Negi et al. (2003) in teak plantations of Panama and India, respectively.
- 7. Assessment Of Biomass Carbon Stock In… www.ijesi.org 52 | Page IV. CONCLUSION Long rotation forests have larger long term C storage in forest biomass and product pool. Biotic interferences and changes in land use cause significant exchanges of carbon between the land and the atmosphere. The phytomass carbon pool estimates are associated with significant uncertainties due to deficiency of data, volume biomass conversion approach and the extent of the human activity on ecosystem and environment, because many ecological processes depend on the carbon cycle.In the tropical forest the carbon in the soil is roughly equivalent to or less than the AGB due to degradation. Ramachandran et al. 2007. Ravindranath et al. (1997) reported that the ratio of SOC and biomass carbon was 1.25. Kaul (2010) has given the range of this ratio between 0.7 to 2. She indicates that in the plantations, the carbon content in the soil was double the biomass carbon but not 2.5 to 3 times the biomass carbon as recorded earlier. The fact she gives that the sequestered SOC came from the original vegetation in the past before exploitation. The SOC and AGB ratio of the present study comes to be 0.51.The calculated productivity of T. grandis is 5.27 t ha-1 yr-1 in the present study, which is higher than the results of the study conducted by Kaul (2010), who has reported productivity of 4 t ha-1 yr-1 in 30 year old teak forest in moist deciduous forests in Northern India (Haldwani), where biomass production was 104 t ha-1 , but this value low as compared to the study conducted by Pande (2005) in M.P. He has reported 6.33 t ha-1 yr-1 of productivity when biomass of the teak was 84.81 t ha-1 and 6.39 t ha-1 yr-1 at 96.34 t ha-1 of biomass in 16 year old plantation. Karmacharya and Singh (1992) have reported productivity of 12.33 t ha-1 yr-1 in dry tropical region (India) for the same species. Singh and Singh (1992) have reported productivity of 12.33 t ha-1 yr-1 in dry tropical region (India) for the same species. Productivity for the same species was also reported by Seth and Kaul (1978) in Dehradun division and it was 8.4 t h-1 yr-1 when the biomass of the plantation was 86.5 t ha-1 at the age of 33 years which was very high when compared to the present study. Low productivity of the present plantation may be because of the anthropogenic pressure by the nearby villagers of the Chiddarwala village, besides this the site is near the road side, hence biotic interferences can not be ruled out. Stand level estimates of biomass according to tree components are needed when biomass productivity and litter fall by biomass components of different quality are modeled and linked to soil as Liski et al. (2002) model describes the decomposition of dead organic matter also. For these purposes it is important to be able to observe the dynamics of C stock in different tree components, such as foliage, branches, bark, stem, stump and roots according to stand age (Lehtonen et al. 2004). V. ACKNOWLEDGEMENTS The authors are thankful to Forest Research Institute (FRI), Dehradun and Uttarakhand Forest Department for logistical and financial support for conducting the study. REFERENCES [1] C. Robledo , C. Forner , Adaptations of forest ecosystems and the forest sector to climate change. Forest and climate change working Paper, 2005: 2. [2] R.A. Sedjo, M.Toman, Can Carbon Sinks Be Operational? Resources for the Future (RFF) Workshop Proceedings, Street, NW, Washington, D.C., 1-5, 2001,1616. [3] D. Pandey, C. Brown, Teak : a global review. Unasylva, 2000, 51:3-13. [4] K.M. Bhat, Timber quality of teak from managed tropical plantations with special reference to Indian plantations. Bois et Foreˆts des Tropiques, 2000, 263(1),6-15. [5] B. Krishanillay, Silviculture and management of teak plantations. Unasylva, 2000, 201. [6] D. Santantonio, R.K. Hermann, W.S. Overton, Root biomass studies in forest ecosystems. Pedobiologia, 17: 1997, 1-31. [7] M.A. Cairns, S. Brown, E.H. Helmer, G.A. Baumgardner, Root biomass allocation in the world’s upland forests. Oecologia, 1997, 111:1-11. [8] W. Bohm, Methods of studying root systems. Ecological Studies, 1979,33. [9] R.B. Jackson, J.Canadell, J.R. Ehleringer, H.A. Mooney, O.E. Sala, E.D. Schulze, A global analysis of root distributions for terrestrial biomes, Oecologia, 1996,108:389-411. [10] K. Skog, G. Nicholson, Carbon cycling through wood products: the role of wood and paper products in carbon sequestration. Forest Products Journal. 48, 1998, 75-83. [11] IPCC (Intergovermental Panel on Climate Change), Land Use, Land-Use Change and Forestry. Cambridge: Cambridge Univ.Press (ISBN: 92-9169-114-3) 2000. [12] J. Burger, C. Zipper, How to restore forests on surface mined land. Virginia Cooperative Extension Publication 2002, 460-123. [13] C.A. Black, Methods of soil analysis. American Society of Agronomy, Inc. Publisher. Madison, Wisconsin. 1965. [14] H.W Art, P.L Marks, A summary table of biomass and net annual primary production in forest ecosystems of the world. In Forest biomass Studies, by Young HE. 16th IUFRO Congr. Univ. Maine Press, Orono 1971, 1-32. [15] FSI: Volume Equations for Forests of India, Nepal and Bhutan. Forest Survey of India, Ministry of Environment and Forests, Dehradun. 1996. [16] A.N. Chaturvedi, L.S. Khanna, Forest Mensuration. International Book Distributors, Dehra Dun, India. 1982, 408. [17] R.P. Sharma, Relationship between tree dimensions and biomass, sapwood area, leaf area and leaf area index in Alnus nepalensis D.Don in Nepal. Agricultural University of Norway (NLH), Aas. 2003. [18] FAO, Global Forest Resource Assessment FAO For., 2000, 40.
- 8. Assessment Of Biomass Carbon Stock In… www.ijesi.org 53 | Page [19] J.D.S. Negi, R.K. Manhas, P.S. Chauhan, Carbon allocation in different components of some tree species of India: A new approach for carbon estimation. Curr. Sci., 85(11), 2003, 1528-1531. [20] K.P. Singh, R. Misra, Structure and functioning of natural, modified and silvicultural ecosystem of eastern U.P. MAB report (1975-1976), BHU. 1978, 161. [21] R. Prasad, G.P. Mishra, Standing biomass of various plant parts in selected tree species of dry deciduous teak forest in M.P. Indian Forester, 110(8), 1984,765-782. [22] Rana, B.S. and Singh, R.P. (1990). Plant biomass and productivity estimates for central Himalayan mixed Banj oak (Quercus leucotrichophora A.camus)-chir pine (Pinus roxburghii). Ind. For., 116(3):220-226. [23] D.A. Mac Lean, R.W. Wein, Nutrient accumulation for post fire jack pine and hardwood succession patterns in New Brunswick. Can. J. For. Res., 7, 1977a, 562-578. [24] Negi, J.D.S. (1984). Biological productivity and cycling of nutrients in managed and man-made ecosystems. Ph. D Thesis, Garhwal University, Srinagar. pp.161. [25] M. Kraenzel, A. Castillo, T. Moore, C. Potvin, Carbon storage of harvest-age teak (Tectona grandis) plantations, Panama. For. Ecol. Mgmt., 173(1-3)2003, 213-225. [26] A.Ramachandran, S.Jayakumar, R.M.Haroon, A.Bhaskaran, D.I. Arockiasamy, Carbon sequestration:estimation of carbon stock in natural forests using geospatial technology in the Eastern ghats of Tamil Nadu, India. Current Science. 92(3), 2007, 323-331. [27] N.H. Ravindranath, B.S. Somshekhar, M. Gadgil, Carbon flows in Indian forest. Climate change. 35(3), 1997, 297-320. [28] M. Kaul, Carbon budget and carbon sequestration potential of Indian forests. Ph D Thesis. Wageningen Univ. Wagenongen, Nether Lands; 2010. [29] P.K. Pande, Biomass and productivity in some disturbed tropical dry deciduous teak forests of Satpura plateau, Madhya Pradesh. Tropical Ecology, 2005, 46(2):229-239. [30] M.L. Jackson, Soil chemical analysis. Prentice-Hall India, New Delhi. 1967. [31] Karmacharya, S.B. and Singh, K.P. (1992). Biomass and net production of teak plantations in a dry tropical region in India. For. Ecol. & Manage., 55:233-247. [32] J.S. Singh, S.P. Singh, (eds.) Forests of Himalayas: structure, functioning and impact of man. Gyanoodaya Prakashan, Nainital. 1992. [33] S.K. Seth, O.N. Kaul, Tropical forest ecosystems of India: the teak forests (as case Biomass and net production of teak in the dry tropics 247. study of silviculture and management). In: Tropical Forest Ecosystems. UNESCO, Paris, 1978, 628-640. [34] J. Liski, D. Peruuchoud, T. Karjalainen, Increasing carbon stocks in the forest soils of western Europe. For. Ecol. Mgmt., 169,2002, 168-179. [35] Lehtonen, R. Makipaa, J. Heikkinen, R. Sievanen, J. Liski, Biomass expansion factors (BEFs) for Scots pine, Norway spruce and birch according to stand age for boreal forests. For. Ecol. Mgmt., 188, 2004, 211-224.