1. City of Dania Beach
Fire-Rescue Department
“Advancing Service Through Caring “
To: J.R. Fernandez, Fire Chief
From: Michael Cassano, Deputy Fire Chief
Date: September 13, 2010
Re: Monthly Report – August 2010
Chief Fernandez, provided herein is the monthly report for August 2010. I have additionally provided within this report,
comparative August data over the previous several years. The report focuses on all aspects of; Emergency Operations,
Administration, and Customer Service. Information provided in this report was taken from various data elements that
are continually reviewed with respect to overall; productivity, timeliness, service delivery benchmarks, NFPA
recommendations, and Insurance Service Organization (ISO) standardization requirements.
PILLARS: OPERATIONAL IMPROVEMENT, CUSTOMER SERVICE, FISCAL RESPONSIBILITY
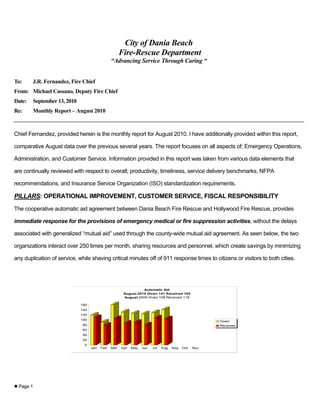
The cooperative automatic aid agreement between Dania Beach Fire Rescue and Hollywood Fire Rescue, provides
immediate response for the provisions of emergency medical or fire suppression activities, without the delays
associated with generalized “mutual aid” used through the county-wide mutual aid agreement. As seen below, the two
organizations interact over 250 times per month, sharing resources and personnel, which create savings by minimizing
any duplication of service, while shaving critical minutes off of 911 response times to citizens or visitors to both cities.
Automatic Aid
August 2010 Given 141 Received 104
August 2009 Given 108 Received 118
160
140
120
100
Given
80 Received
60
40
20
0
Jan Feb Mar Apr May Jun Jul Aug Sep Oct Nov
Page 1
2. Emergency Responses
Total Calls For Service August 2010 = 628
Total Calls For Service August 2009 =610
Emergency
Medical
75%
Fires and Service/Good
Hazards Fire Alarms Intent
3% 9% 13%
PILLAR: FISCAL RESPONSIBILITY, HEALTH WELLNESS, & SAFETY
FIRE PREVENTION & LIFE SAFETY DIVISION: Presented below are the Fire Prevention Division productivity figures
for August 2010, with previous year comparatives for trending assessment purposes. As you will see, we continue to
trend towards a long-standing goal of returning plans to a customer within a day of drop off. The report which tracks a
current “turn-around-time” for plan reviews, has reached a “customer friendly” processing rate of a plan review done in
just one day!
Inspected Properties:
2010: 267
2009: 320
2008: 218
2 Page
3. Square Footage Reviewed # Plans Time Spent Turn-around Time Back to Customer
2010: 352,000 43 36 hrs 1.1 Days
2009: 1,565,000 43 37 hrs 2.4 Days
2008: 452,000 35 59 hrs 5.8 Days
Fees:
Submitted August to Finance (without impact fees / matches H.T.E.):
2010: $23,180.00
2009: $25,355.00
2008: $17,670.00
GRANT AWARD STATUS:
SAFER GRANT: Personnel screenings, oral and written testing has all been completed for over 180 applicants.
Final selections in ranked order have been provided to the Human Resource Department for processing once
CBA is finalized.
MEDICAL CARTS: The manufacturing of both medical carts will be completed over the next two months.
Video Laryngoscopes: Received product / commencement of “Competency Based Training” (CBT) for all
paramedic personnel through the regional training representative, Ambu with an August completion date. The
equipment is designed to allow for full visualization of upper airway anatomic structures, thereby improving
overall success rates for oral intubation, which is the “Gold Standard” of care for the patient requiring advanced
airway management. All personnel as of this report have been certified as competent in it’s usage.
3 Page
4. PILLARS: OPERATIONAL IMPROVEMENT, PROFESSIONAL DEVELOPMENT
The captured training hours for departmental personnel is an item tracked for the past several years. Over those
years there has been a over-arching responsibility to enlarge; scope, quantity, and participation of all areas of
departmental training. The total training hours for personnel, continues to track at three to five times the
hours seen for the same number of personnel during calendar year 2005.
Additionally, Dania Beach Fire Rescue personnel trained 30 City of Dania Beach employees at CW Thomas
Park in CPR and the usage of an Automated Electronic Defibrillation machine (AED).
AUGUST TRAINING
Operational Improvement
Pillar: Professional Development
Customer Service / Community Outreach
2009: Total Hours: 1,072 2010: Total Hours: 1,365
Fire/ISO
Fire/ISO 80%
69%
EMS
Other Other EMS
14%
17% 11% 9%
Fire EMS Other
Fire EMS Other
Hurricane
Traumatic Officer Training Medic CEU
Officer Training Computer Procedures
Brain CEU
Premise Airway Special
Equipment Training PEPP Leadership Survey’s Training Operations
Radioactivity EZ IO Hybrid Car Video Driver Engineer
Fire Preplans
Training Training Training Laryngoscope Training
Fire Preplans Rules and
Regulations
LP Training Specialized
Hose Training
4 Page
5. PILLAR: FISCAL RESPONSIBILITY
Current fiscal responsibility challenges:
Ongoing Collective Bargaining Agreement discussions
Finalization of new hire recommendations submitted to HR for SAFER Grant compliance
Review of Transport Fees; local survey completed; resident policy, assessment of costs, charges, and payers
Review of Fire Prevention and Life Safety Division fees for service
EMERGENCY MEDICAL SERVICES TRANSPORT FIGURES REPORT
Transport Totals
4,000 3,462
3,283 3,377 3,316 3,286
2,772 2,800
3,000
2,000
1,000
-
FY 2005 FY 2006 FY 2007 FY 2008 FY 2009 FYTD FYTD
2009 2010
During fiscal year 2008, changes to Medicare transport signature requirements caused a delay of transport fee
payments that were received in actual fiscal year 2009. These payment receivables transported in 2008 and paid during
the FY 2009 year created a false actual which explains a higher FY2009 total, to that of date receivables in fiscal year
2010, see below.
Fiscal Year Comparison
$900,000
$800,000 $683,398
$700,000 $629,865
$600,000
$500,000
$400,000
$300,000
$200,000
$100,000
$-
FYTD 2010 FYTD 2009
5 Page
6. Collections/Deposits Analysis
$900,000 $808,781 $789,756 $798,741 $820,252
$800,000 $734,236
$700,000 $608,137 $629,865
$600,000
$500,000
$400,000
$300,000
$200,000
$100,000
$-
FY FY FY FY FY FY FYTD
2004 2005 2006 2007 2008 2009 2010
The Advanced Life Support(ALS) Vs. Basic Life Support(BLS) trend continues to show a necessitated increase in
overall level of care. The rate of utilization of advanced treatment modalities has increased to 77% of all transports. This
graphic indicates that Dania Beach paramedics are finding that patients are presenting with physical complaints that
require advanced therapies by standard of care protocols. These medical necessary patient care shifts require
additional on-scene time, a minimum of a three person crew, and oftentimes the response of the fire engine.
BLS & ALS Ratios
100%
73% 77%
80% 64% 66% 65% 66%
60%
35% 33% 34% 32%
40% 26%
21%
20%
1% 1% 1% 2% 1% 2%
0%
FY 2005 FY 2006 FY 2007 FY 2008 FY 2009 FY 2010
BLS ALS1 ALS2
The last two graphics provide financial data elements for August 2010, they are the “charge” and “payor” graphics.
These graphics provide data that has been a long-standing demographic reality for the Dania Beach patient transports
and represents an area for future transport fee rate adjustments. As noted below in the “charge” graphic, there is a
usual transport rate for patients without any form of insurance of between 30 – 35% monthly. The “payor” graphic
however recognizes that only 5% of the transport revenue is attributive to “self-payer’s.” Going forward, Dania Beach
Fire Administration, in association with the third party billing company, ADPI will suggest transport fee adjustments that
work to remedy those discrepancies through a change to transport fees accompanied with a “Resident Transport
Policy.”
6 Page
7. The “Charge” graphic is representative of the type insurance each of the transported patients have. As seen in the
graphic 32% of the August transports, were patients transported without an insurance program. Additionally, a telling
statistic for our demographic was an over 20% patient transport population with Medicaid coverage. That rate is 5-
8% higher than any other reporting statistics ADPI has from any other city in the Dade, Broward, or Palm Beach area.
Charge Mix
Medicare
Self Pay 26%
32%
Medicaid
Insurance 21%
21%
Payor Mix
Self Pay
6% Medicare
30%
Insurance
53% Medicaid
11%
The August 2010 Report is submitted herein for your review and comment.
Respectfully submitted,
Michael Cassano, Deputy Fire Chief
7 Page