
Recommandé
Contenu connexe
En vedette
En vedette (18)
Similaire à Lesson 6-1 Notes
Similaire à Lesson 6-1 Notes (13)
Dernier
Dernier (20)
Lesson 6-1 Notes
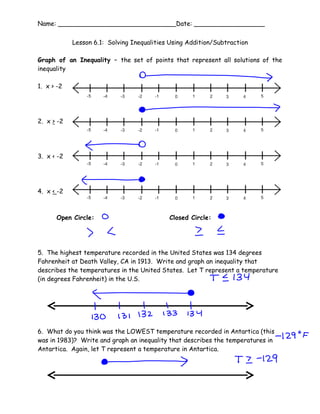
- 1. Name: ______________________________Date: __________________ Lesson 6.1: Solving Inequalities Using Addition/Subtraction Graph of an Inequality – the set of points that represent all solutions of the inequality 1. x > -2 2. x > -2 3. x < -2 4. x < -2 Open Circle: Closed Circle: 5. The highest temperature recorded in the United States was 134 degrees Fahrenheit at Death Valley, CA in 1913. Write and graph an inequality that describes the temperatures in the United States. Let T represent a temperature (in degrees Fahrenheit) in the U.S. 6. What do you think was the LOWEST temperature recorded in Antartica (this was in 1983)? Write and graph an inequality that describes the temperatures in Antartica. Again, let T represent a temperature in Antartica.
- 2. Name: ______________________________Date: __________________ 7. You can send no more than 500 text messages each month without incurring additional charges on your cell phone. Write and graph an inequality that describes the number of text messages you can send each month. Let M stand for the number of messages. 8. Write an inequality represented by each graph. a. b. 9. Solve each inequality and graph the solutions on the number line. a. m – 3.8 < -1 b. – 1 > m – ½ c. b + 7 > 3 d. 9 < x + 4.5 10. You are shopping for bicycles. The type you want costs at least $185. So far, you have saved $97. Find the possible amounts of money you need to save to buy the bicycle you want.
- 3. Name: ______________________________Date: __________________ 11. You are checking a bag at the airport. Bags can weigh no more than 50 pounds. Your bag weights 16.8 pounds. Find the possible weights w that you can add to your bag.