Macfadyen usc tlt keynote 2015.pptx

Slides from Keynote presentation at the University of Southern California's 2015 Teaching with Technology annual conference. "9:15 am – ANN Auditorium Key Note: What Do We Mean by Learning Analytics? Leah Macfadyen, Director for Evaluation and Learning Analytics, University of British Columbia Executive Board, SoLAR (Society for Learning Analytics Research) Leah Macfadyen will define and explore the emerging and interdisciplinary field of learning analytics in the context of quantified and personalized learning. Leah will use actual examples and case studies to illustrate the range of stakeholders learning analytics may serve, the diverse array of questions they may be used to address, and the potential impact of learning analytics in higher education."

Recommandé
Recommandé
Contenu connexe
Tendances
Tendances (20)
En vedette
En vedette (20)
Similaire à Macfadyen usc tlt keynote 2015.pptx
Similaire à Macfadyen usc tlt keynote 2015.pptx (20)
Dernier
Dernier (20)
Macfadyen usc tlt keynote 2015.pptx
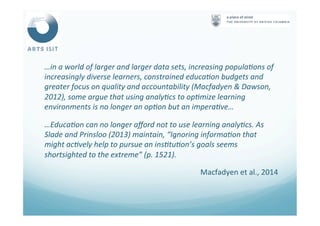
- 1. …in a world of larger and larger data sets, increasing popula4ons of increasingly diverse learners, constrained educa4on budgets and greater focus on quality and accountability (Macfadyen & Dawson, 2012), some argue that using analy4cs to op4mize learning environments is no longer an op4on but an impera4ve… …Educa4on can no longer afford not to use learning analy4cs. As Slade and Prinsloo (2013) maintain, “Ignoring informa4on that might ac4vely help to pursue an ins4tu4on’s goals seems shortsighted to the extreme” (p. 1521). Macfadyen et al., 2014
- 2. What do we mean by ‘learning analy<cs’? Leah P. Macfadyen, PhD Program Director, Evalua<on and Learning Analy<cs Faculty of Arts, The University of Bri<sh Columbia Vancouver, Canada leah.macfadyen@ubc.ca hNp://www.slideshare.net/leahmac1 hNp://isit.arts.ubc.ca/learning-‐analy<cs/
- 3. 1. Learning analy<cs...just another buzzword? 2. Origins and drivers 3. Current state of the field: Progress and challenges 4. Grassroots LA: Mee<ng local needs 5. ‘Big’ learning analy<cs: Ins<tu<onal implementa<ons 6. Why should you care?
- 4. Learning analy<cs has been defined as the process of developing ac#onable insights through problem defini4on and the applica4on of sta#s#cal models and analysis against exis4ng and/or simulated future data Cooper, 2012
- 5. The Society for Learning Analy<cs Research (SoLAR) defines the core ac<vi<es of learning analy<cs as the measurement, collec4on, analysis and repor4ng of data about learners and their contexts for purposes of understanding and op#mizing learning and the environments in which learning occurs. hNp://www.solaresearch.org
- 6. Where has LA come from? LA draws from, and is closely <ed to, a series of other fields of study including — Business intelligence — Web analy<cs — “Academic analy<cs” (2005 -‐ ) — Educa<onal data mining (EDM)(~2000 -‐) — “Ac<on analy<cs” (~2008 -‐ ) Elias, 2011
- 7. Drivers The underpinnings: — Socio-‐poli<cal/economic factors — Educa<onal factors — Technological factors Ferguson, 2012
- 8. New developments…. 1. Converging developments in data science — Even bigger “big data” — Increasing volumes of teaching-‐ and learning-‐related data — More, and more accessible, data — Parallel developments in educa<onal data science — Data mining algorithms and predic<ve modelling — Approaches to network analysis — Approaches to text mining and discourse analysis at scale — Increasingly user-‐friendly sofware
- 9. 2. Moving beyond number crunching — EDM laid groundwork of computa<on and modelling — RecogniFon that learning cannot simply be understood by algorithms, and that social and pedagogical theory, approaches and insights must also be brought to bear. — Technological, ideological, and methodological orienta<ons of the field of learning analy<cs differen<ate it from EDM “…technical, pedagogical, and social domains must be brought into dialogue with each other to ensure that interven4ons and organiza4onal systems serve the needs of all stakeholders.” Siemens & Baker, 2012
- 10. 3. Interdisciplinary collaboraFon Technical/AnalyFc Social Sciences/EducaFon • sta<s<cs • data visualiza<on and visual analy<cs • educa<onal data mining • computer science • machine learning • natural language processing • human-‐computer interac<on • and others…. • social sciences • educa<on • (educa<onal) psychology • psychometrics • educa<onal technology • art and design • and others…
- 11. t 2013 e processing r interaction ychology nology gher education as a system social pedagogical technical/analytic LA EDM Figure 1. The interdisciplinary scope of learning analytics
- 12. LA ImplementaFon: Current state of the field — Stage 1: Extrac<on and repor<ng of transac<on-‐level data — Stage 2: Analysis and monitoring of opera<onal performance — Stage 3: “What-‐if” decision support (such as scenario building) — Stage 4: Predic<ve modeling & simula<on — Stage 5: Automa<c triggers and alerts (interven<ons) Goldstein, P. & Katz, R. (2005)
- 13. AnalyFcs Panic? • For more on challenges of acting on educational research, see McIntosh, 1979 • For more on LA strategy and policy, see Ferguson et al., 2014; Macfadyen et al., 2014
- 14. Learning analyFcs goals — Learner awareness — Monitoring and tracking — Reflec<on and research — Evalua<on and planning — Repor<ng and communica<on adapted from Kay (2013)
- 15. Start where you are: Clarifying stakeholders, purposes and goals Discussion Paper, August 2013 Table 2. Purposes and stakeholders in university learning analytics (adapted from Kay (2013)) LA tools or insights can facilitate… Example stakeholders? Learner awareness of own learning strategies and performance to encourage self-regulated learning and support metacognition Learners Monitoring and tracking for immediate decisions • Identifying problems early enough to intervene • Distinguishing students who are loafing, gaming the system Individual educators Reflection and research for recognizing long term issues • Insights into learning processes and performance by many learners • Education research o Attrition factors o Insights into individual performance Individual educators Educational researchers Administrators Planning • course design/re-design
- 16. • Identifying problems early enough to intervene • Distinguishing students who are loafing, gaming the system Individual educators Reflection and research for recognizing long term issues • Insights into learning processes and performance by many learners • Education research o Attrition factors o Insights into individual performance Individual educators Educational researchers Administrators Planning • course design/re-design • curriculum and program planning • faculty-level planning with regards to course and program offerings • teaching assignments • decision-making with regards to management, staffing, etc. Individual educators Administrators Reporting and communication among and between stakeholder groups e.g.: • Educators to learners • Institution to parents • Institution to government • Peer to peer Learners Educators Administrators Government In sum, learning analytics as a field spans a wide range of stakeholders, ends and output types. It has at its core an exploratory and analytic approach to educational research that makes use of large sets of educational data, with the goal of uncovering new approaches to measuring or monitoring learning or teaching. Output may include tools, systems or reports for learners and/or educators on their activities within the teaching and learning system. It may also include automated or non-automated reporting and/or visualization tools for educators, administrators, governments and policy makers on individual, unit or institutional performance, with the goal of informing ongoing planning and educational
- 17. Big data in UBC Arts… — Student informa<on (demographics, origins, academic history…) — Enrollment informa<on (enrollments, withdrawals, grades, program specializa<ons) — Course evalua<ons (scores, comments) — LMS ac<vity data (‘clickstream’ data) — MOOC data — Ac<vity data from other technologies (lecture annota<on systems, blogs, wikis) — All kinds of student wri<ng (online, offline) — Open data (LinkedIn data, geographic data…)
- 18. LA quesFons in UBC Arts — Do students from different parts of the world show different ac<vity levels/paNerns in online courses? — Which students are more likely to complete course evalua<ons, and does it maNer? — Have average grades changes over <me, and how? — Which students are most at risk of failure? (How early can we iden<fy them and provide beNer support?) — Who are our students? Where do they come from and how has that changed over <me?
- 19. — What can clickstream data tell us about how students learn? — What does ‘learner engagement’ look like in a MOOC and how can we promote it? — What are the most common themes in student course evalua<on comments? — What are the most common enrollment choices our learners make to complete their degrees? Do ‘high achievers’ make different choices than ‘low achievers’? — Teaching and learning detec<ve stories of all kinds…..
- 20. Author's personal copy Mining LMS data to develop an ‘‘early warning system” for educators: A proof of concept Leah P. Macfadyen a,*, Shane Dawson b a Science Centre for Learning and Teaching, The University of British Columbia, 6221 University Boulevard, Vancouver, British Columbia, Canada V6T 1Z1 b Graduate School of Medicine, University of Wollongong, Wollongong, NSW 2522, Australia a r t i c l e i n f o Article history: Received 21 May 2009 Received in revised form 31 August 2009 Accepted 3 September 2009 Keywords: Collaborative learning Evaluation methodologies Learning communities Teaching/learning strategies Post-secondary education a b s t r a c t Earlier studies have suggested that higher education institutions could harness the predictive power of Learning Management System (LMS) data to develop reporting tools that identify at-risk students and allow for more timely pedagogical interventions. This paper confirms and extends this proposition by providing data from an international research project investigating which student online activities accu- rately predict academic achievement. Analysis of LMS tracking data from a Blackboard Vista-supported course identified 15 variables demonstrating a significant simple correlation with student final grade. Regression modelling generated a best-fit predictive model for this course which incorporates key vari- ables such as total number of discussion messages posted, total number of mail messages sent, and total num- ber of assessments completed and which explains more than 30% of the variation in student final grade. Logistic modelling demonstrated the predictive power of this model, which correctly identified 81% of students who achieved a failing grade. Moreover, network analysis of course discussion forums afforded insight into the development of the student learning community by identifying disconnected students, patterns of student-to-student communication, and instructor positioning within the network. This study affirms that pedagogically meaningful information can be extracted from LMS-generated student track- ing data, and discusses how these findings are informing the development of a customizable dashboard- like reporting tool for educators that will extract and visualize real-time data on student engagement and likelihood of success. Ó 2009 Elsevier Ltd. All rights reserved. 1. Introduction Higher education institutions (HEIs) around the world are undergoing rapid changes as they adapt to the new realities of the knowledge society. While the development, maintenance and dissemination of knowledge have long been the primary goals of higher education insti- tutions (Bloland, 1995), recent social and economic changes are forcing universities to adopt new approaches in the way these goals are achieved. Educators are being asked to demonstrate quality teaching practices with decreasing fiscal and human resources, whilst catering to the learning needs of a burgeoning student population that is increasingly diverse in many dimensions (Twigg, 1994, 1994a, 1994b). Student demographics have radically shifted, and student enrollment numbers have dramatically increased (Patrick & Gaële, 2007). The traditional and idealized experience of higher education as ‘‘academically oriented living and learning communities” where ‘‘full-time stu- dents receive a good deal of faculty contact and many academic support services in the residential setting” (Volkwein, 1999, p. 14) relies upon intensive fiscal and labour resources. Unfortunately, the reality is that federal, state and provincial government funding commitments for higher education have failed to match the escalating sector resourcing requirements (Bates, 2000; Rossner & Stockley, 1997). To sup- Computers & Education 54 (2010) 588–599 Contents lists available at ScienceDirect Computers & Education journal homepage: www.elsevier.com/locate/compedu Author's personal copy 3.3. Logistic regression A binary logistic regression analysis was conducted to test the reliability of the model in predicting whether or not an individual student is considered ‘at risk of failure’. Individual students with course final grade <60% were coded as ‘at risk’ (0), while students with final grade P60% were coded as ‘performing adequately or better’ (1). In the UBC grading scheme, <60% represents a grade of C- or poorer; <50% is considered a failing grade (University of British Columbia, 2009). We selected this division point to include students whose final grade indi- cates that they barely passed the course and may have benefitted from earlier support and intervention. Details of the regression model are shown in Table 5. For the purposes of this study, the ‘hit rate’ or predictive power of the model is of greatest significance. Overall, the logistic regression model accurately placed individual students in either the ‘at risk’ or ‘performing ade- quately’ category 73.7% of the time (Table 6). The model resulted in ‘Type II’ errors (classifying an ‘at risk’ student as ‘performing ade- quately’) at a rate of only 12.7%: 15 students out of 118 were predicted to be performing adequately, while their final course grade placed them in the ‘at risk’ category. However, of these 15 students, only four actually failed the course (achieving a final grade of <50%), representing a ‘predictive failure’ rate of only 3.4% (four students out of 118). The logistic model also resulted in Type I errors 13.6% of the time by placing 16 students in the ‘at risk’ category even though these students eventually passed the course (achieving grades of >60%). However, given the importance of identifying students at risk of failure early in their course progression, the occurrence of Type I errors is of less concern. More simply put, it is better to mistakenly identify a student as at risk of failure then to neglect a student requiring additional learning support. In sum, logistic modelling effectively identified the majority of the students who failed or almost failed this course and who would have been considered ‘at risk of failure’ by instructors if this data had been accessible earlier in the term. Table 5 Logistic regression analysis summary for course LMS tracking variables (Nstudents = 118). Included 95% CI for Exp b b (SE) Lower Exp b Upper Constant .46 (.24) 1.58 # Mail messages sent .74* (.35) 1.05 2.10 4.19 Total # discussion messages posted 1.02* (.39) 1.30 2.78 5.98 # Assessments finished .66* (.26) 1.16 1.93 3.22 Note: r2 = .31 (Cox & Snell, 1989), .32 (Nagelkerke, 1991). Model v2 = 9.59. * p < .05. Table 6 ‘Risk of failure’ classification results for students in course (Nstudents = 118). Observed Predicted At risk Not at risk Percentage correct At risk 38 15 71.7 Not at risk 16 49 75.4 Overall percentage 73.7 ‘At risk’ = final grade <60%; ‘Not at risk’ = final grade >60%. L.P. Macfadyen, S. Dawson / Computers & Education 54 (2010) 588–599 595
- 23. A ‘Top 10%’ student’s ego network”
- 24. A ‘Bottom 10%’ student’s ego network”
- 25. Can network analysis help us understand learner behaviour and persistence in MOOCs?
- 26. Change in the student body over time?
- 27. Who is dropping out?
- 30. Temporal analysis of enrollment patterns
- 32. The Purdue Signals Project hNp://www.itap.purdue.edu/studio//signals/ “The premise behind CS is fairly simple: utilize the wealth of data found at an educational institution, including the data collected by instructional tools, to determine in real time which students might be at risk, partially indicated by their effort within a course.” Arnold & Pistilli, 2012
- 34. UMBC’s ‘Check My AcFvity’ tool hNp://www.educause.edu/ero/ar<cle/video-‐demo-‐umbcs-‐check-‐my-‐ac<vity-‐tool-‐students
- 35. UMBC Course AcFvity by Final Grade Credit: John Fritz, UMBC
- 36. CMA Use by Final Grade Credit: John Fritz, UMBC
- 37. PercentGrade UBC data on ‘self-‐monitoring’ and performance
- 38. Student ApFtude Data (SATs, current GPA, etc.) Student Demographic Data (Age, gender, etc.) Sakai Event Log Data Sakai Gradebook Data PredicFve Model Scoring Iden<fies students “at risk” to not complete course SIS Data LMS Data IntervenFon Deployed “Awareness” or Online Academic Support Environment (OASE) Model Developed Using Historical Data Step #1: Developed model using historical data Academic Alert Report (AAR) CreaFng an Open Academic Early Alert System hbps://confluence.sakaiproject.org/display/LAI/Learning+AnalyFcs+IniFaFve
- 39. Research Findings: Final Course Grades — Analysis showed a staFsFcally significant posi<ve impact on final course grades — No difference between treatment groups — Similar trend among low income students 50 60 70 80 90 100 Awareness OASE Control Final Grade (%) Mean Final Grade for "at Risk" Students Jayaprakash et al., 2014
- 40. Why should you care? — Driving and evalua<ng innova<on — Support for self-‐directed learning — Provision of informed and targeNed advice and support at all stages of the learning journey: recruitment, academic advising and recommending, facilita<on, reten<on — Con<nuous assessment of quality of learning materials — Development of new (beNer?) educa<onal performance indicators and modes of assessment — Real-‐<me academic performance monitoring and management for learners and educators — Maintenance of comprehensive student records — Effec<ve repor<ng at mul<ple levels
- 41. Learning analy4cs (LA) offers the capacity to inves4gate the rising 4de of learner data with the goal of understanding the ac4vi4es and behaviors associated with effec4ve learning, and to leverage this knowledge in op4mizing our educa4onal systems (Bienkowski, Feng, & Means, 2012; Campbell, DeBlois, & Oblinger, 2007). Macfadyen et al., 2014 leah.macfadyen@ubc.ca http://www.slideshare.net/leahmac1
- 42. Arnold, K. E. & Pis<lli, M. (2012). Course Signals at Purdue: Using Learning Analy<cs To Increase Student Success. Course Signals at Purdue: Using learning analy<cs to increase student success. Proceedings of the 2nd Interna<onal Conference on Learning Analy<cs & Knowledge. New York: ACM. hNps://www.itap.purdue.edu/learning/docs/research/Arnold_Pis<lli-‐ Purdue_University_Course_Signals-‐2012.pdf Bichsel, J. (2012). 2012 ECAR study of analy4cs in higher educa4on. Retrieved from hNp://www.educause.edu/library/resources/2012-‐ecar-‐study-‐analy<cs-‐higher-‐educa<on Cooper, (2012). What is Analy<cs? Defini<on and Essen<al Characteris<cs. CETIS Analy4cs Series, 1 (5). hNp://publica<ons.ce<s.ac.uk/2012/521 Elias, T. (2011). Learning Analy4cs: Defini4ons, Processes and Poten4al. hNp://learninganaly<cs.net/LearningAnaly<csDefini<onsProcessesPoten<al.pdf Ferguson, R. (2012). Learning analy<cs: drivers, developments and challenges. Interna4onal Journal of Technology Enhanced Learning, 4(5/6) pp. 304–317. Forrester, J. W. (1961). Industrial dynamics. Cambridge, MA: MIT Press. References
- 43. Ferguson, R., Macfadyen, L. P., Clow, D., Tynan, B., Alexander, S., & Dawson, S. (2014). Sewng learning analy<cs in context: Overcoming the barriers to large-‐scale adop<on. Journal of Learning Analy4cs, 1(3), 120-‐144. Retrieved from hNp://epress.lib.uts.edu.au/journals/index.php/JLA/ar<cle/view/4077/442 Goldstein, P. & Katz, R. (2005). Academic analy4cs: The uses of management informa4on and technology in higher educa4on -‐ key findings. ECAR, hNp://www.educause.edu/ECAR/AcademicAnaly<csTheUsesofMana/156526 Ison, R. (2008) Systems thinking and prac<ce in ac<on research. In P. Reason and H. Bradbury. The handbook of ac4on research: par4cipa4ve inquiry and prac4ce. Sage: London. Jayaprakash, S. M., Moody, E. W., Lauría, E. J., Regan, J. R., & Baron, J. D. (2014). Early Alert of Academically At-‐Risk Students: An Open Source Analy<cs Ini<a<ve. Journal of Learning Analy4cs, 1(1), 6-‐47. hNp://epress.lib.uts.edu.au/journals/index.php/JLA/ar<cle/view/3249 Kay, J. (2013). Visualiza4on and Data Presenta4on aka Open Learner Modelling (OLM). Presenta<on at the 2013 Learning Analy<cs Summer Ins<tute, Stanford, California. Slides available at: hNp://sydney.edu.au/engineering/it/~judy/Homec/bio.html
- 44. Macfadyen, L. P., Dawson, S. Pardo, A., & Gašević, D. (2014). Embracing Big Data in Complex Educa<onal Systems: The Learning Analy<cs Impera<ve and the Policy Challenge. Research & Prac<ce in Assessment, 9, 17-‐28. hNp://www.rpajournal.com/dev/wp-‐content/uploads/2014/10/A2.pdf Macfadyen, L. P., & Dawson, S. (2010). Mining LMS data to develop an ‘‘early warning system” for educators: A proof of concept. Computers & Educa4on, 54,588-‐599. doi: 10.1016/j.compedu.2009.09.008 Macfadyen, L. P., & Dawson, S. (2012). Numbers Are Not Enough. Why e-‐Learning Analy<cs Failed to Inform an Ins<tu<onal Strategic Plan. Educa4onal Technology & Society, 15 (3), 149– 163. McIntosh, N. E.,. (1979). Barriers to implemen<ng research in Higher Educa<on. Studies in Higher Educa4on, 4(1), 77-‐ 86. Méndez, G., Ochoa, X., Chiluiza, K. & de Wever, B. (2014) Curricular Design Analysis: A Data-‐ Driven Perspec<ve. Journal of Learning Analy4cs, 1(3), 84–119.
- 45. Norris, D., Baer, L., Leonard, J., Pugliese, L. and Lefrere, P. (2008). Framing Ac<on Analy<cs and Puwng Them to Work, EDUCAUSE Review 43(1). Retrieved October 1, 2010 from hNp://www.educause.edu/EDUCAUSE+Review/EDUCAUSEReviewMagazineVolu me43/ FramingAc<onAnaly<csandPuw/162423 Siemens, G., & Baker, R. S. J. d (2012). Learning Analy4cs and Educa4onal Data Mining: Towards Communica4on and Collabora4on. Paper presented at the Learning Analy<cs and Knowledge, Banff, AB, Canada. Slade, S. & Prinsloo, P. (2013). Learning Analy<cs: Ethical Issues and Dilemmas. American Behavioral Scien4st, 57(10), 1510–1529. Yanosky, R. (2009). Ins4tu4onal data management in higher educa4on. Boulder, CO: Educause Center for Applied Research. Retrieved from hNp://www.educause.edu/library/ECM0908