SlideShare une entreprise Scribd logo
1  sur  4
Télécharger pour lire hors ligne
The Start
Current History
Cognizant Rotates to DigitalCognizant GrowthV. S&P
Professor Scott Galloway talks about the winners and losers in the digital economy
using the USAToday (bottom left) analysis of the 13 fastest growth companies
(revenue) against the S&P500 average. Most of these companies can be classified
as algorithmic - where algorithms drive value.A few of the 13 provide the
underlying algorithmic platforms & solutions which are in great demand as
everyone tries to inject algorithms into their value chain. Cognizant stand out as
the only consulting company in this group. Interestingly they are late to the digital
marketing bandwagon but their ability to provide low priced outsourced services
to this sector is fueling over 9% annual growth (15% 5 year); the question becomes
can they maintain this pace through the next decade.
In 2017, Cognizant began a realignment of the business by executing on strategies
too improve the overall efficiency of operations, with the goal of achieving 22%
(non-GAAP) operating margin in 2019 while continuing to drive revenue growth.
The stated approach is to align digital services into three digital practice areas -
Digital Business, Digital Operations and Digital Systems andTechnology - which
they believe will address the needs of customers as they transform their business
and technology models.As Cognizant rotate to digital in order to maintain growth
and improve margins - it’s worth understanding the characteristics of the pure
digital companies; some of which Cognizant will take on in various forms.The table
below summarizes key characteristics of pure digital players;
IT Solutions Sector Pure Digital Play
COMPETITORS
In 2003, Kumar Mahadeva resigned as
CEO, and was replaced by Lakshmi
Narayanan. Under his leadership, the
company expanded its offerings in the
IT arena to become a leader in business
process outsourcing (BPO). Francisco
D'Souza succeeded Narayanan as CEO
in 2006, and remains the CEO today. 
Cognizant enjoyed rapid growth, and for
9 years straight made the Fortune
magazines "100 Fastest-Growing
Companies". Can this growth be
sustained?
CognizantTechnology Solutions
Corporation is aTeaneck, New Jersey-
based company that employs an
onsite/offshore development model to
provide application maintenance
services and enterprise consulting
solutions to major corporations,
primarily in the United States.
Cognizant is one of the few companies
that has found a way to take advantage
of the large pool of English-speaking IT
professionals resident in India.
Just 13 companies in the current Standard & Poor's 500, including social media giant Facebook (FB), apparel maker Under Armour
(UA) and drugmaker Alexion Pharmaceuticals (ALZN), have consistently and definitively posted faster revenue growth than the
average company and are expected to do it again this year, according to a USA TODAY analysis of data from S&P Global Market Intelligence
(based on 2015 results).
Company Name 5Y Growth
(revenues)
2 Year
Beta
EBIT
Margin
Return on
Equity
Return on
Capital
EV/
Revenues
International Business
Machines Corporation
(NYSE:IBM)
(5.63) 1.01 27.0 61.3 12.3 2.25
Accenture plc
(NYSE:ACN) 5.07 1.02 14.1 42.0 36.8 2.55
Tata Consultancy Services
Limited (NSEI:TCS) 16.0 0.592 26.1 34.0 24.6 4.05
Cognizant Technology
Solutions Corporation
(NasdaqGS:CTSH)
15.4 0.943 16.2 18.2 13.3 2.63
Infosys Limited
(NSEI:INFY) 8.06 0.333 26.7 21.2 15.4 2.78
DXC Technology Company
(NYSE:DXC) 1.59 - - 4.54 5.36 2.1
Wipro Limited (BSE:
507685) 10.9 0.504 17.4 16.5 8.51 2.34
HCL Technologies Limited
(NSEI:HCLTECH) - 0.515 20.7 27.9 18.9 2.44
Capgemini SE
(ENXTPA:CAP) 4.71 1.1 11.2 13.9 7.96 1.44
NTT Data Corporation
(TSE:9613) 8.98 0.694 7.8 7.74 6.03 1.16
Company Name 5Y Growth
(revenues)
2 Year
Beta
EBIT
Margin
Return on
Equity
Return on
Capital
EV/
Revenues
WPP plc (LSE:WPP) 8.22 0.556 19.7 19.7 8.73 1.45
Omnicom Group Inc.
(NYSE:OMC) 1.66 0.824 14.2 40.9 15.7 1.35
Publicis Groupe S.A.
(ENXTPA:PUB) 9.64 0.773 17.5 (8.47) 10.0 1.52
Dentsu Inc. (TSE:4324) - 1.21 18.1 - - 1.88
JCDecaux SA
(ENXTPA:DEC) 3.45 1.08 11.4 10.9 4.08 2.57
The Interpublic Group of
Companies, Inc.
(NYSE:IPG)
2.3 0.79 21.4 26.6 14.1 1.22
CyberAgent, Inc. (TSE:
4751) - 1.11 4.93 12.9 19.8 1.38
Hakuhodo DY Holdings Inc
(TSE:2433) 4.42 0.986 - 9.31 9.37 0.345
Compagnie du Cambodge
(ENXTPA:CBDG) 114.3 0.191 12.6 4.11 3.71 2.2
Ströer SE & Co. KGaA
(DB:SAX) 17.8 0.65 13.7 13.8 5.74 3.2
CUSTOMERSVALUE CHAIN*
The below diagram shows how different
offerings attract different margins and risk
profiles. It is useful to bear in mind as
Cognizant becomes ‘more digital’. Genesis
technology which is initially highly visible
attract the highest margins as the best and
brightest master the solution space.
Cognizant’s traditional
competitors are shown on the
left; the table on the right
shows contrasting digital
competitors which is where
Cognizant intends to rotate,
albeit partially.
ValueChain
Evolution
BlockChain
Machine
Learning
BPO
Application
Services
Digital
Platforms
Digital
Operations
Digital
Media
Systems
Integration
Genesis Custom Product Commodity
VisibleInvisible
IT Consulting Median Aggregate Ave
Levered Beta 0.73 0.76 0.76
Gross D/E ratio 7.25% 16.45% 15.56%
Marginal tax rate 26.00% 26.00% 28.55%
Unlevered Beta 0.69 0.67 0.68
Cash/Firm Value 6.41% 8.01% 8.63%
Unlevered Beta* 0.74 0.73 0.75
EV/Sales 2.03 1.93 3.90
Sales to capital 1.81 1.90 2.65
EBIT margin 8.13% 11.48% 10.85%
Infra-

Structure
Digital Agencies Median Aggregate Ave
Levered Beta 0.56 0.74 0.74
Gross D/E ratio 11.05% 40.66% 50.53%
Marginal tax rate 26.00% 26.00% 28.48%
Unlevered Beta 0.52 0.57 0.54
Cash/Firm Value 7.96% 8.52% 13.62%
Unlevered Beta* 0.56 0.62 0.63
EV/Sales 2.14 1.59 4.80
Sales to capital 1.27 1.32 11.06
EBIT margin 9.36% 10.84% 12.94%
Blue items used in calculations
* Unlevered Beta corrected for cash
Lower MarginHigher Margin
Digital
Traditional
The IT Solutions sector is probably the best sector to
evaluate Cognizant in its present form.The Sales to Capital is
very close to Cognizant’s current 1.99 and confirms 2.0 as a
sensible assumption in the intrinsic valuation that follows.The
sector unlevered Beta is slightly lower then used (0.74 v.
0.86). Cognizant has low debt exposure with D/E of 3.6%
versus sector median of 7.5%.
Following the logic that Cognizant is moving towards more
digital value offerings, the below table offers some
perspective of how the company may be impacted. Of note
is a lower unlevered Beta (0.56) and lower Sales to Capital
of 1.32 which implies higher re-investment rates. EV/Sales is
also lower and well below the Cognizant’s current 2.63.
Interesting these agencies have much higher D/E ratios.
*For more on Strategy
Mapping see Simon Wardley
at http://blog.gardeviance.org
TABLE OF CONTENT Page
Competitors and Value Offering 1
Intrinsic Valuation & Sensitivity 2
Pricing Analysis & Regression 3
Conclusions and Recommendations 4
Value/Share
Revenue Growth
7% 8% 9% 10% 11%
15% 63 66 69 72 75
16% 67 70 73 76 79
17% 70 73 77 80 84
18% 74 77 80 84 88
19% 77 80 84 88 92
20% 80 84 88 92 97
21% 84 88 92 96 101
Operating
Margin
The FutureAn intrinsic model has been built based
on current revenues and growth of 9%.
The operating margins begin at 17% but
various scenarios are tested on the
bottom right of this page.The table
below summarizes the valuation based
on the tables and comments on this
page;
INTRINSICVALUE
SCENARIOSWACC
This model shows
different share values
over Operating Margin
and Revenue growth.
The yellow is current
model.
Financial Services Med Agg Ave
Levered Beta 1.12 1.10 1.10
Unlevered Beta* 0.90 1.80 1.00
EV/Sales 3.52 2.40 17.66
Segments
Healthcare Med Agg Ave
Levered Beta 0.82 0.87 0.87
Unlevered Beta* 0.77 0.83 0.83
EV/Sales 4.46 2.40 6.34
Products, Resource Med Agg Ave
Levered Beta 0.94 0.95 0.95
Unlevered Beta* 0.79 0.78 0.76
EV/Sales 2.24 1.69 2.90
Comms, Media,Tech Med Agg Ave
Levered Beta 1.00 1.00 1.00
Unlevered Beta* 0.99 0.98 0.94
EV/Sales 3.66 3.29 5.13
*Unlevered Beta corrected for cash
Blue items used in calculations
Business Revenue EV/Sales Value UL
Financial $5,511.00 2.40 $13,226.40 0.90
Healthcare $4,051.00 2.40 $9,722.40 0.77
Products $2,851.00 1.69 $4,818.19 0.79
CMT $1,718.00 3.29 $5,652.22 0.99
Company $14,131 $33,419.21 0.8615
Beta

Using customer
segments as a
surrogate for the risk
generates a unlevered
Beta os 0.86.This
translates to a levered
Beta of 0.88.
Interestingly this is very
close to the sector
Beta for Computer
Services (0.89).
Another perspective is
from the direct
competitors who have
a bottom up unlevered
Beta of 0.74.As
Cognizant implements
its ‘digital’ strategy the
Beta should decrease
moving somewhat
towards towards 0.56
- the bottom up Beta
for Digital Agencies.
See Scenarios (right)
for implications of
lowering Beta.
Region* Revenues ERP Weight ERP-Weighted
Europe 1,082 6.23% 7.66% 0.4769%
North America 11,037 4.86% 78.10% 3.7959%
Rest of World 884 6.73% 6.26% 0.4212%
United Kingdom 1,128 5.34% 7.98% 0.4262%
Total 14,131 100.00% 5.1203%
Cost of Capital is composed of Cost of Equity plus Cost of
Debt.The Cost of Equity is calculated on a risk free rate of
2.28% plus the levered beta x the weighted ERP (shown above
based on the weighted revenue generated at the regions).The
levered beta is calculated using a Debt/Equity of 3.64% and tax
at the margin of 26%.This provides a cost of equity of 6.81%
The Cost of Debt is based on a 0.6% spread based on a
synthetic rating (Aaa/AAA) on Cognizant’s Interest coverage
ratio; yielding a pre-tax cost of debt of 2.88%
The overall Weighted Average Cost of Capital (WACC) is
6.64% (taking the operating leases into account).
Terminal cash flow 2,365.51$
Terminal cost of capital 6.78%
Terminal value 52,566.87$
PV(Terminal value) 27,531.96$
PV (CF over next 10 years) 14,226.06$
Sum of PV 41,758.02$
Probability of failure = 0.00%
Proceeds if firm fails = $20,879.01
Value of operating assets = 41,758.02$
- Debt 1,526.54$
- Minority interests -$
+ Cash 4,713.00$
+ Non-operating assets 304.61$
Value of equity 45,249.09$
- Value of options $123.44
Value of equity in common stock 45,125.65$
Number of shares 589.65
Estimated value /share 76.53$
Price 72.00$
Price as % of value 94.08%
Base year 1 2 3 4 5 6 7 8 9 10 Terminal year
Revenue growth rate 9.00% 9.00% 9.00% 9.00% 9.00% 7.66% 6.31% 4.97% 3.62% 2.28% 2.28%
Revenues 14,131.00$ 15,402.79$ 16,789.04$ 18,300.05$ 19,947.06$ 21,742.30$ 23,406.67$ 24,883.63$ 26,119.10$ 27,064.61$ 27,680.33$ 28,310.06$
EBIT (Operating) margin 16.59% 16.63% 16.67% 16.72% 16.76% 16.80% 16.84% 16.88% 16.92% 16.96% 17.00% 17.00%
EBIT (Operating income) 2,344.76$ 2,562.05$ 2,799.47$ 3,058.87$ 3,342.29$ 3,651.94$ 3,941.03$ 4,199.83$ 4,418.99$ 4,589.97$ 4,705.66$ 4,812.71$
Tax rate 24.90% 24.90% 24.90% 24.90% 24.90% 24.90% 25.12% 25.34% 25.56% 25.78% 26.00% 26.00%
EBIT(1-t) 1,760.91$ 1,924.10$ 2,102.40$ 2,297.21$ 2,510.06$ 2,742.61$ 2,951.04$ 3,135.60$ 3,289.49$ 3,406.67$ 3,482.19$ 3,561.41$
- Reinvestment 635.90$ 693.13$ 755.51$ 823.50$ 897.62$ 832.19$ 738.48$ 617.74$ 472.76$ 307.86$ 1,195.90$
FCFF 1,288.21$ 1,409.28$ 1,541.71$ 1,686.56$ 1,844.99$ 2,118.85$ 2,397.12$ 2,671.76$ 2,933.92$ 3,174.33$ 2,365.51$
NOL -$ -$ -$ -$ -$ -$ -$ -$ -$ -$ -$ -$
Cost of capital 6.64% 6.64% 6.64% 6.64% 6.64% 6.67% 6.69% 6.72% 6.75% 6.78% 6.78%
Cumulated discount factor 0.9377 0.8793 0.8246 0.7732 0.7251 0.6797 0.6371 0.5970 0.5592 0.5238
PV(FCFF) 1,207.99$ 1,239.22$ 1,271.25$ 1,304.09$ 1,337.75$ 1,440.29$ 1,527.20$ 1,594.97$ 1,640.75$ 1,662.56$
Implied variables Base year 1 2 3 4 5 6 7 8 9 10 After year 10
Sales to capital ratio 2.00 2.00 2.00 2.00 2.00 2.00 2.00 2.00 2.00 2.00
Invested capital 7,793$ 8,428$ 9,122$ 9,877$ 10,701$ 11,598$ 12,430$ 13,169$ 13,787$ 14,259$ 14,567$
ROIC 22.60% 22.83% 23.05% 23.26% 23.46% 23.65% 23.74% 23.81% 23.86% 23.89% 23.90% 6.78%
Cognizant has been growing at 9%
which close too the sector median
Current Operating Margin growing to
17% - see Scenarios below for alternatives
Cost of Capital (see below) grows slightly
to typical mature company inYear 10 Current sales/capital ratio is 2 and the sector has an aggregate
of 1.9; it’s reasonable to assume this will remain at 2
Return on Capital grows to 24% from
22.6% - sector average 23%
Reinvestment Rate
=2.28/6.78=33.58%
New US MarginalTax Rate
26%
Value per share is $76.53 based on 9% per
year revenue growth and 17% margin. See
scenario tab for sensitivity as Cognizant
management desire a 20% margin target.
ROIC
Revenue Growth
7% 8% 9% 10% 11%
15% 20.9% 21.0% 21.1% 21.2% 21.2%
16% 22.3% 22.4% 22.5% 22.6% 22.6%
17% 23.7% 23.8% 23.9% 24.0% 24.0%
18% 25.1% 25.2% 25.3% 25.4% 25.5%
19% 26.5% 26.6% 26.7% 26.8% 26.9%
20% 27.9% 28.0% 28.1% 28.2% 28.3%
21% 29.3% 29.4% 29.5% 29.6% 29.7%
Operating
Margin
Value/Share
Levered Beta
0.70 0.75 0.80 0.85 0.90
15% 72 71 70 70 69
16% 76 75 74 73 72
17% 80 79 78 77 76
18% 85 83 82 81 80
19% 89 87 86 85 84
20% 93 91 90 89 88
21% 97 95 94 93 91
Operating
Margin
This shows the impact
of different Revenue
growth and Operating
Margin changes on
Return on Invested
Capital. Green is
improvement over
current.
In this scenario we
examine the sensitivity
in Beta at various
Operating Margins.
0.05 points in Beta
moves the price by
approximately $1
Current Model
Currently Cognizant is
trading in a band of $70 to
$72; on release of Q3 it was
trading at $76
Glossary

PV - Present Value

FCFF - Free Cash Flows to Firm

NOL - Net Operating Loss

ERP - Equity Risk Premium

WACC - Weighted Average Cost of Capital

Med - Median;Age - Aggregate

Ave - Average

UL - Unlevered Beta
*Notes on Regions:

Unfortunately Cognizant does not provide useful details on its
regional business and prefers to consolidate into area’s like ‘Rest
of World’ and it’s definition of Europe is nebulous.This makes it
difficult to estimate an accurate Equity Risk Premium. Since NA
is a large percentage weight the impact is currently minimal.
PRICING
1Year EV/S
The Market
Grouping the Cognizant competitors
produces a global set of 85 companies
that compete with Cognizant within
the same industry sector with at least
$1B of market capitalization namely -
IT Consulting and Other Services.
Thirty of these are direct competitors
of similar scope as mentioned in
various industry reports.


Selecting multiples of enterprise value
is likely the best measure of firms
who’s primary asset are their
employees. Measures of Enterprise
Value to Invested Capital and
EnterpriseValue to Revenues are
examined as indicators of pricing
discrepancies and predictors.
0
5
10
15
20
25
30
1 3 5 7 9 11 13 15 17 19 21 23 25 27 29 31 33 35 37 39
Frequency	Distribution
EV/Sales EV/IC
The Frequency Distribution above
shows how both EV/Sales and EV/IC
are distributed around a skewed
distribution of multiple frequency.The
sector aggregate values of 3.67 (EV/IC)
and 1.93 (EV/S) are closely correlated
with the median. Cognizant is currently
trading at multiples of 5.46 (EV/IC) and
2.68 (EV/S). This would tend to
indicate that the market is overpricing
Cognizant.
ACN
TCS
IBM
INFY
CTSH
Growth ROIC DFR EV/IC
Forecast
EV/IC
Under/
Over %
IBM 5.63 16.92 26.75 3.38 3.97 -17.3%
Accenture 5.07 74.31 3.35 15.07 15.33 -1.7%
Tata 16 47.64 0.76 11.45 10.71 6.5%
Cognizant 15.4 25.62 3.50 5.46 6.52 -19.5%
Infosys 8.06 30.74 - 5.24 7.41 -41.3%
DXC 1.59 4.61 24.80 1.82 1.65 9.2%
Wipro 10.9 18.62 9.43 4.17 4.94 -18.3%
HCL 0 24.62 1.76 4.61 6.03 -30.8%
Capgemini 4.71 9.69 19.62 2.19 2.82 -28.6%
NTT 8.98 6.19 24.22 1.84 2.13 -16.0%
The above table shows a regression of expected
Revenue growth over the next 5 years, Return
on Invested Capital and Debt/Capital against
EnterpriseValue to Invested Capital.
The regression highlights Cognizant being
undervalued by nearly 20% and renders a
forecast EnterpriseValue of $46M.
The R-Squared is an excellent 72%, however
there should be caution over the standard error
of 1.73 which is high against the EV/IC median of
3.49.When taking the entire sector of 85
companies into the regression the R-Squared
drops to 21%
EV/IC
Regression	Statistics Coefficients t	Stat
Multiple	R 0.86914982 Intercept 1.50796902 1.50211105
R	Square 0.75542141 Growth 0.02338696 0.63188241
Adjusted	R	Square0.72720081 ROIC 0.18572347 7.03399052
Standard	Error1.73033293 DFR -0.030361 -0.9321913
Observations 30
6.18																	 0.43																	
Regression	Statistics Coefficients t	Stat
Multiple	R 0.79334665 Intercept -0.054601 -0.0488684
R	Square 0.62939891 OpMargin 0.20929319 6.14814665
Adjusted	R	Square0.57010273 DFR 0.03457438 1.35804816
Standard	Error1.43649958 Tax -0.0350549 -1.1814995
Observations 30 Growth 0.03076679 0.99358861
Operating
Margin
DFR
Tax
(eff)
Growth
EV/
Sales
Forecast
EV/Sales
Under/
Over %
IBM 15.72 26.75 5 5.63 2.33 4.16 -78.6%
Accenture 14.77 3.35 21 5.07 2.62 2.57 2.1%
Tata 25.06 0.76 24 16 4.07 4.88 -19.9%
Cognizant 16.99 3.50 23 15.4 2.68 3.30 -23.4%
Infosys 24.50 - 28 8.06 2.82 4.35 -54.3%
DXC 7.20 24.80 23 1.59 2.10 1.57 25.2%
Wipro 16.42 9.43 23 10.9 2.49 3.24 -30.5%
HCL 20.05 1.76 18 0 2.54 3.56 -40.3%
Capgemin
i
10.32 19.62 14 4.71 1.56 2.44 -56.9%
NTT 6.27 24.22 40 8.98 1.15 0.98 15.4%
EV/Sales
The above table shows a regression of expected
Operating Margin, Debt/Capital, EffectiveTax
Rate and Revenue growth over the next 5 years
against EnterpriseValue to Sales.
The regression highlights Cognizant being
undervalued by nearly 23% and renders a
forecast EnterpriseValue of $48M.
The R-Squared is an good 63%, however there
should be caution over the standard error of
1.44 which is high against the EV/S median of
2.03.When taking the entire sector of 85
companies into the regression the R-Squared
drops to 43%
Regression	Statistics Coefficients t	Stat
Multiple	R 0.5385302 Intercept 6.88480888 5.74804798
R	Square 0.29001478 Growth -0.0109217 -0.1736098
Adjusted	R	Square0.2080934 EBI/Employee-0.0034182 -0.0251126
Standard	Error 2.9481197 DFR -0.1498328 -3.164286
Observations 30
Consulting companies are intrinsically linked to
the quality and numbers of employees who are
generating revenues and providing leverage over
their costs. In the above regression we substitute
EBIT/Employee for ROIC and attempted
further regressions which drops the R-Squared
to 29% and yields a unacceptable standard error
of 3.
Regression	Statistics Coefficients t	Stat
Multiple	R 0.53232302 Intercept 3.21865624 2.48792605
R	Square 0.2833678 Revenue/Employee0.05432973 2.73430217
Adjusted	R	Square0.16870665 DFR -0.0397839 -1.2327999
Standard	Error1.99756223 Tax -0.0623765 -1.4831117
Observations 30 Growth 0.03130246 0.71843109
In this scenario we have taken Revenues/
Employee as a replacement for Operating
Margin. The attempted regressions drops R-
Squared to 28% and yields a standard error of 2.
$46,217
Regression
Enterprise
Value:
$47,720
Regression
Enterprise
Value:
The regression of the direct 30
competitors yields some contrasting
perspectives.The regressions is
forecasting that EV/IC can potentially
move up 20% and that EV/Sales has
23% capacity.The implications are
calculated EnterpriseValue which is
very similar for both regressions of
$46-47B; we will compare this shortly
with the intrinsic appraisal.
The below graph shows trading history of EV to Sales for the 4 major competitors.
Notice how around May 2017 the markets took a major re-valuation of the players,
notably pushing IBM lowest (high debt) and Accenture and Cognizant upwards.
EV/IC (forecast)= 

1.51+0.023xG+0.186xROIC-0.03xDFR
EV/S (forecast) =
-0.055+0.21xOM+0.035xDFR-0.035xT+0.031xG
IT Services Median Aggregate
EV/IC (85) 3.49 3.67
EV/IC (30) 3.55 3.35
IT Services Med Aggregate
EV/Sales (85) 2.03 1.93
EV/Sales (30) 2.07 2.26
Glossary

EV - Enterprise Value

EV/IC - Enterprise Value/Invested Capital

EV/S - Enterprise Value to Revenue

DFR - Debt to Capital

ROIC - Return on Capital
Share Price
CONCLUSIONS
BUY
Action
Presented by
Malcolm Silberman
January 3rd 2018
Cognizant share price has been on a
constant rise as it met and exceeded
its high growth targets. Lately the
market seems to be lowering its
estimates of growth targets.The
intrinsic valuation shows a slight
discount on the intrinsic value. Recently
as shown in the below pricing graph
the price has dropped slightly with the
release of third quarter results. 

Management has set a target of 20%
(for 2019) operating margin
improvement from the current 17%.
Currently the markets seem reluctant
to buy into the margin improvement
strategy and the stated movement into
digital offerings.This is understandable
as many consulting organizations have
struggled to embrace these digital
agency models. Interestingly digital
agencies are attempting to become
more consulting focused and are also
finding this path difficult. It is likely that
the market consensus is based on a
wait and see philosophy.
Tax Assumptions
PricingValuation
IT Services 85 30 Cognizant
EV/IC 3.67 3.35 5.46
EV/S 1.93 2.26 2.68
EV (regression) See pg. 3 $47B
Cognizant 30 Current Valuation
Revenue Growth 14.4% 8.95% 9%
Operating Margin 13.3% 17% 17%
EV $24B $39B $41,76B
Terminal cash flow 2,365.51$
Terminal cost of capital 6.78%
Terminal value 52,566.87$
PV(Terminal value) 27,531.96$
PV (CF over next 10 years) 14,226.06$
Sum of PV 41,758.02$
Probability of failure = 0.00%
Proceeds if firm fails = $20,879.01
Value of operating assets = 41,758.02$
- Debt 1,526.54$
- Minority interests -$
+ Cash 4,713.00$
+ Non-operating assets 304.61$
Value of equity 45,249.09$
- Value of options $123.44
Value of equity in common stock 45,125.65$
Number of shares 589.65
Estimated value /share 76.53$
Price 72.00$
Price as % of value 94.08%
The valuation is conservatively based on 9%
revenue growth and 17% operating margin.The
competitors set of 30 with market capitalization
> $4B reflects a higher revenue growth of 14%
and lower operating margins of 13%.
Managements stated intent is to grow operating
margin to 22% (non-GAAP) which we calculate
as 20% and have built that into our cashflow
forecast over 10 years. Clearly management
would like a more aggressive timetable. If they
meet this goal in 2019 as desired the projected
share price is $88 (see page 2 Scenarios).
The pricing indicators are a somewhat
contrarian to each other.The above table shows
IT services i.e. the Cognizant competitor set.The
85 represents the 85 competitors with market
capitalization > $1B and the 30 represents direct
competitors with a market capitalization > $4B.
In both cases of EV/IC and EV/S Cognizant is
trading overpriced. However the regression
analysis showed a forecast of $46-47B in
EnterpriseValue based on the market view of
the 30 competitor set. At $46B this would imply
a share price of approximately $83.
SUMMARY
The market seems a to be raising a concern about Cognizant maintaining its leadership as one of
the S&P500 top revenue growth companies.This probably explains the current dichotomy
between the current high multiples Cognizant attracts versus the regression opportunities.
However the fundamentals from the valuation models show that Cognizant has some intrinsic
value. Currently the model predicts it is priced at a slight discount of 94%.The market has not yet
factored in (or believed) the management objective of 20% operating margin while maintaining the
9% year on year revenue growth, also the Beta should drop by half to one unit as the company
evolves to a more digital orientated business model.This analysis (page 2) indicates that at 20%
Operating Margins and 0.5 drop in Beta the share price could reach $88-90.
Given the strong indicators from the regression models ($83) and the valuation fundamentals a
BUY is proposed on Cognizant.
BUSINESS MODEL
A short note to cover back on the evolution of Cognizant’s business model which
opened the story on page one. Managements stated objectives are moving towards
more digital offerings and increasing Operating Margins by at least 3 points - all the
while maintaining 9% plus revenue growth.
Fortunately the digital space has constantly evolving opportunities to add value. In
particular there is great demand for two newish technologies, namely Machine
Learning (AI) and Blockchain. Both of these are within the managements stated
strategy. Cognizant is well positioned to provide these services and certainly in the
early days will garner high margins which will mature like all other technologies as
they become more commoditized. However this constant cycling from genesis to
commodity bodes well for the company.As many customers aspire to become more
algorithmic these services will have a strong demand.
A note on the marginal tax
assumptions. Late in December 2017
the US Senate passed legislation
decreasing the US marginal tax rate
from 35% to 21%. Previous calculations
where based on a 40% marginal tax
rate (taking state taxes into account).
For this evaluation the new rate of
26% (including state taxes) was used
for both intrinsic and pricing
calculations.
Computer Services 929
EV/IC 4.00
EV/S 1.13
Sales to Capital 3.54
As an alternative the above table
reflects on the multiples from the
Computer Services sector.This is a
far broader segment consisting of
929 companies. Here you can see a
higher EV/IC against the IT services
sector of about 0.4.The EV/S is lower
in the Computer Services by
approximately 0.7.
Against this sector Cognizant is still
trading at higher multiples and still
looking expensive.
Glossary

30 - this is 30 direct competitors with market capitalization > $4B

85 - the is the 85 IT Services companies with market capitalization > $1B

929 - these are 929 companies in the Computer Services sector

Current - these are the latest financial numbers

Valuation - these are the financial numbers used in the intrinsic valuation on page 2

EV - Enterprise Value

EV/IC - Enterprise Value/Invested Capital

EV/S - Enterprise Value to Revenue
malcsilberman@gmail.com

Contenu connexe

Tendances

JBusch - Yield Leaders
JBusch - Yield LeadersJBusch - Yield Leaders
JBusch - Yield Leaders
Jim Busch
 
Scott Neuman: The Social Business Imperative
Scott Neuman: The Social Business ImperativeScott Neuman: The Social Business Imperative
Scott Neuman: The Social Business Imperative
United Partners
 
Evaluating_Financial_Health
Evaluating_Financial_HealthEvaluating_Financial_Health
Evaluating_Financial_Health
Kristy Martinez
 

Tendances (20)

Powerful Interaction Points: Saying goodbye to the channel
Powerful Interaction Points: Saying goodbye to the channelPowerful Interaction Points: Saying goodbye to the channel
Powerful Interaction Points: Saying goodbye to the channel
 
PwC Entertainment, media and communications deal insightsQ3 2015
PwC Entertainment, media and communications deal insightsQ3 2015PwC Entertainment, media and communications deal insightsQ3 2015
PwC Entertainment, media and communications deal insightsQ3 2015
 
JBusch - Yield Leaders
JBusch - Yield LeadersJBusch - Yield Leaders
JBusch - Yield Leaders
 
PwC's Global Technology IPO Review -- Q1 2015
PwC's Global Technology IPO Review -- Q1 2015PwC's Global Technology IPO Review -- Q1 2015
PwC's Global Technology IPO Review -- Q1 2015
 
Driving growth and differential performance among Class I railroads
Driving growth and differential performance among Class I railroadsDriving growth and differential performance among Class I railroads
Driving growth and differential performance among Class I railroads
 
Scott Neuman: The Social Business Imperative
Scott Neuman: The Social Business ImperativeScott Neuman: The Social Business Imperative
Scott Neuman: The Social Business Imperative
 
UK Business Payments Barometer
UK Business Payments BarometerUK Business Payments Barometer
UK Business Payments Barometer
 
Evaluating_Financial_Health
Evaluating_Financial_HealthEvaluating_Financial_Health
Evaluating_Financial_Health
 
7 FAQs about cloud by CFOs
7 FAQs about cloud by CFOs7 FAQs about cloud by CFOs
7 FAQs about cloud by CFOs
 
Persistent System ltd. Q3FY19
Persistent System ltd. Q3FY19Persistent System ltd. Q3FY19
Persistent System ltd. Q3FY19
 
2015 investor digital and social media survey
2015 investor digital and social media survey2015 investor digital and social media survey
2015 investor digital and social media survey
 
Evolving landscape of technology deals: Semiconductor Industry
Evolving landscape of technology deals: Semiconductor Industry Evolving landscape of technology deals: Semiconductor Industry
Evolving landscape of technology deals: Semiconductor Industry
 
Search Marketing in a B2B World - PPC and SEO
Search Marketing in a B2B World - PPC and SEOSearch Marketing in a B2B World - PPC and SEO
Search Marketing in a B2B World - PPC and SEO
 
World Insurance Report 2014 from Capgemini and Efma
World Insurance Report 2014 from Capgemini and EfmaWorld Insurance Report 2014 from Capgemini and Efma
World Insurance Report 2014 from Capgemini and Efma
 
Global flows in a digital age
Global flows in a digital ageGlobal flows in a digital age
Global flows in a digital age
 
Turning big data into big revenue
Turning big data into big revenueTurning big data into big revenue
Turning big data into big revenue
 
TMT Outlook 2017: A new wave of advances offer opportunities and challenges
TMT Outlook 2017:  A new wave of advances offer opportunities and challengesTMT Outlook 2017:  A new wave of advances offer opportunities and challenges
TMT Outlook 2017: A new wave of advances offer opportunities and challenges
 
Communications Review- Customer Experience
Communications Review- Customer ExperienceCommunications Review- Customer Experience
Communications Review- Customer Experience
 
Whitepaper: Rules Harvesting from Source Code - Happiest Minds
Whitepaper: Rules Harvesting from Source Code - Happiest MindsWhitepaper: Rules Harvesting from Source Code - Happiest Minds
Whitepaper: Rules Harvesting from Source Code - Happiest Minds
 
201505 IT Trends 2015
201505 IT Trends 2015 201505 IT Trends 2015
201505 IT Trends 2015
 

Similaire à Cognizant Valuation

Cro april10 - READIMINDS LAUNCHES TRANSACTION Security Solution
Cro april10 - READIMINDS LAUNCHES TRANSACTION Security SolutionCro april10 - READIMINDS LAUNCHES TRANSACTION Security Solution
Cro april10 - READIMINDS LAUNCHES TRANSACTION Security Solution
Nagesh KP
 
Harvard Business Review_The Ecosystem Equation - Collaboration in the Connect...
Harvard Business Review_The Ecosystem Equation - Collaboration in the Connect...Harvard Business Review_The Ecosystem Equation - Collaboration in the Connect...
Harvard Business Review_The Ecosystem Equation - Collaboration in the Connect...
Beth Taylor
 
Business Intelligence White Paper March11
Business Intelligence White Paper March11Business Intelligence White Paper March11
Business Intelligence White Paper March11
craig1201
 

Similaire à Cognizant Valuation (20)

Stepping Up the Pace
Stepping Up the PaceStepping Up the Pace
Stepping Up the Pace
 
Measure for measure - the difficult art of quantifying return on digital inve...
Measure for measure - the difficult art of quantifying return on digital inve...Measure for measure - the difficult art of quantifying return on digital inve...
Measure for measure - the difficult art of quantifying return on digital inve...
 
Competing to Win in the Media & Entertainment Industry
Competing to Win in the Media & Entertainment IndustryCompeting to Win in the Media & Entertainment Industry
Competing to Win in the Media & Entertainment Industry
 
The difficult art of quantifying return on digital investments
The difficult art of quantifying return on digital investmentsThe difficult art of quantifying return on digital investments
The difficult art of quantifying return on digital investments
 
View point q2 2012
View point q2 2012View point q2 2012
View point q2 2012
 
Global It Consulting Market
Global It Consulting MarketGlobal It Consulting Market
Global It Consulting Market
 
Những chìa khoá chính để thúc đẩy giá trị kỹ thuật số (Digital Value)
Những chìa khoá chính để thúc đẩy giá trị kỹ thuật số (Digital Value)Những chìa khoá chính để thúc đẩy giá trị kỹ thuật số (Digital Value)
Những chìa khoá chính để thúc đẩy giá trị kỹ thuật số (Digital Value)
 
IT Outsourcing in Covid Environment: Is It Really Relevant?
IT Outsourcing in Covid Environment: Is It Really Relevant?IT Outsourcing in Covid Environment: Is It Really Relevant?
IT Outsourcing in Covid Environment: Is It Really Relevant?
 
Cro april10 - READIMINDS LAUNCHES TRANSACTION Security Solution
Cro april10 - READIMINDS LAUNCHES TRANSACTION Security SolutionCro april10 - READIMINDS LAUNCHES TRANSACTION Security Solution
Cro april10 - READIMINDS LAUNCHES TRANSACTION Security Solution
 
Hexaware technologies ltd.
Hexaware technologies ltd.Hexaware technologies ltd.
Hexaware technologies ltd.
 
AI: From Data to ROI
AI: From Data to ROIAI: From Data to ROI
AI: From Data to ROI
 
Cherry Tree's IT Services Newsletter March 2016
Cherry Tree's IT Services Newsletter March 2016Cherry Tree's IT Services Newsletter March 2016
Cherry Tree's IT Services Newsletter March 2016
 
Battery Ventures State of the OpenCloud Report 2022
Battery Ventures State of the OpenCloud Report 2022Battery Ventures State of the OpenCloud Report 2022
Battery Ventures State of the OpenCloud Report 2022
 
The Face of the New Enterprise
The Face of the New EnterpriseThe Face of the New Enterprise
The Face of the New Enterprise
 
Close the AI Action Gap in Financial Services
Close the AI Action Gap in Financial ServicesClose the AI Action Gap in Financial Services
Close the AI Action Gap in Financial Services
 
Harvard Business Review_The Ecosystem Equation - Collaboration in the Connect...
Harvard Business Review_The Ecosystem Equation - Collaboration in the Connect...Harvard Business Review_The Ecosystem Equation - Collaboration in the Connect...
Harvard Business Review_The Ecosystem Equation - Collaboration in the Connect...
 
The ecosystem equation collaboration in the connected economy @harvard biz @i...
The ecosystem equation collaboration in the connected economy @harvard biz @i...The ecosystem equation collaboration in the connected economy @harvard biz @i...
The ecosystem equation collaboration in the connected economy @harvard biz @i...
 
Group4 macr project
Group4 macr projectGroup4 macr project
Group4 macr project
 
The Revenue Operations to Revenue Acceleration Framework Every Modern Busines...
The Revenue Operations to Revenue Acceleration Framework Every Modern Busines...The Revenue Operations to Revenue Acceleration Framework Every Modern Busines...
The Revenue Operations to Revenue Acceleration Framework Every Modern Busines...
 
Business Intelligence White Paper March11
Business Intelligence White Paper March11Business Intelligence White Paper March11
Business Intelligence White Paper March11
 

Dernier

VIP Call Girl in Mumbai Central 💧 9920725232 ( Call Me ) Get A New Crush Ever...
VIP Call Girl in Mumbai Central 💧 9920725232 ( Call Me ) Get A New Crush Ever...VIP Call Girl in Mumbai Central 💧 9920725232 ( Call Me ) Get A New Crush Ever...
VIP Call Girl in Mumbai Central 💧 9920725232 ( Call Me ) Get A New Crush Ever...
dipikadinghjn ( Why You Choose Us? ) Escorts
 
VIP Call Girl Service Andheri West ⚡ 9920725232 What It Takes To Be The Best ...
VIP Call Girl Service Andheri West ⚡ 9920725232 What It Takes To Be The Best ...VIP Call Girl Service Andheri West ⚡ 9920725232 What It Takes To Be The Best ...
VIP Call Girl Service Andheri West ⚡ 9920725232 What It Takes To Be The Best ...
dipikadinghjn ( Why You Choose Us? ) Escorts
 
VIP Independent Call Girls in Mumbai 🌹 9920725232 ( Call Me ) Mumbai Escorts ...
VIP Independent Call Girls in Mumbai 🌹 9920725232 ( Call Me ) Mumbai Escorts ...VIP Independent Call Girls in Mumbai 🌹 9920725232 ( Call Me ) Mumbai Escorts ...
VIP Independent Call Girls in Mumbai 🌹 9920725232 ( Call Me ) Mumbai Escorts ...
dipikadinghjn ( Why You Choose Us? ) Escorts
 
Best VIP Call Girls Morni Hills Just Click Me 6367492432
Best VIP Call Girls Morni Hills Just Click Me 6367492432Best VIP Call Girls Morni Hills Just Click Me 6367492432
Best VIP Call Girls Morni Hills Just Click Me 6367492432
motiram463
 
VIP Independent Call Girls in Mira Bhayandar 🌹 9920725232 ( Call Me ) Mumbai ...
VIP Independent Call Girls in Mira Bhayandar 🌹 9920725232 ( Call Me ) Mumbai ...VIP Independent Call Girls in Mira Bhayandar 🌹 9920725232 ( Call Me ) Mumbai ...
VIP Independent Call Girls in Mira Bhayandar 🌹 9920725232 ( Call Me ) Mumbai ...
dipikadinghjn ( Why You Choose Us? ) Escorts
 
VIP Call Girl in Mira Road 💧 9920725232 ( Call Me ) Get A New Crush Everyday ...
VIP Call Girl in Mira Road 💧 9920725232 ( Call Me ) Get A New Crush Everyday ...VIP Call Girl in Mira Road 💧 9920725232 ( Call Me ) Get A New Crush Everyday ...
VIP Call Girl in Mira Road 💧 9920725232 ( Call Me ) Get A New Crush Everyday ...
dipikadinghjn ( Why You Choose Us? ) Escorts
 
VIP Call Girl in Mumbai 💧 9920725232 ( Call Me ) Get A New Crush Everyday Wit...
VIP Call Girl in Mumbai 💧 9920725232 ( Call Me ) Get A New Crush Everyday Wit...VIP Call Girl in Mumbai 💧 9920725232 ( Call Me ) Get A New Crush Everyday Wit...
VIP Call Girl in Mumbai 💧 9920725232 ( Call Me ) Get A New Crush Everyday Wit...
dipikadinghjn ( Why You Choose Us? ) Escorts
 
Call Girls Banaswadi Just Call 👗 7737669865 👗 Top Class Call Girl Service Ban...
Call Girls Banaswadi Just Call 👗 7737669865 👗 Top Class Call Girl Service Ban...Call Girls Banaswadi Just Call 👗 7737669865 👗 Top Class Call Girl Service Ban...
Call Girls Banaswadi Just Call 👗 7737669865 👗 Top Class Call Girl Service Ban...
amitlee9823
 
VIP Independent Call Girls in Andheri 🌹 9920725232 ( Call Me ) Mumbai Escorts...
VIP Independent Call Girls in Andheri 🌹 9920725232 ( Call Me ) Mumbai Escorts...VIP Independent Call Girls in Andheri 🌹 9920725232 ( Call Me ) Mumbai Escorts...
VIP Independent Call Girls in Andheri 🌹 9920725232 ( Call Me ) Mumbai Escorts...
dipikadinghjn ( Why You Choose Us? ) Escorts
 
( Jasmin ) Top VIP Escorts Service Dindigul 💧 7737669865 💧 by Dindigul Call G...
( Jasmin ) Top VIP Escorts Service Dindigul 💧 7737669865 💧 by Dindigul Call G...( Jasmin ) Top VIP Escorts Service Dindigul 💧 7737669865 💧 by Dindigul Call G...
( Jasmin ) Top VIP Escorts Service Dindigul 💧 7737669865 💧 by Dindigul Call G...
dipikadinghjn ( Why You Choose Us? ) Escorts
 

Dernier (20)

Vasai-Virar High Profile Model Call Girls📞9833754194-Nalasopara Satisfy Call ...
Vasai-Virar High Profile Model Call Girls📞9833754194-Nalasopara Satisfy Call ...Vasai-Virar High Profile Model Call Girls📞9833754194-Nalasopara Satisfy Call ...
Vasai-Virar High Profile Model Call Girls📞9833754194-Nalasopara Satisfy Call ...
 
VIP Call Girl in Mumbai Central 💧 9920725232 ( Call Me ) Get A New Crush Ever...
VIP Call Girl in Mumbai Central 💧 9920725232 ( Call Me ) Get A New Crush Ever...VIP Call Girl in Mumbai Central 💧 9920725232 ( Call Me ) Get A New Crush Ever...
VIP Call Girl in Mumbai Central 💧 9920725232 ( Call Me ) Get A New Crush Ever...
 
Stock Market Brief Deck (Under Pressure).pdf
Stock Market Brief Deck (Under Pressure).pdfStock Market Brief Deck (Under Pressure).pdf
Stock Market Brief Deck (Under Pressure).pdf
 
VIP Call Girl Service Andheri West ⚡ 9920725232 What It Takes To Be The Best ...
VIP Call Girl Service Andheri West ⚡ 9920725232 What It Takes To Be The Best ...VIP Call Girl Service Andheri West ⚡ 9920725232 What It Takes To Be The Best ...
VIP Call Girl Service Andheri West ⚡ 9920725232 What It Takes To Be The Best ...
 
VIP Independent Call Girls in Mumbai 🌹 9920725232 ( Call Me ) Mumbai Escorts ...
VIP Independent Call Girls in Mumbai 🌹 9920725232 ( Call Me ) Mumbai Escorts ...VIP Independent Call Girls in Mumbai 🌹 9920725232 ( Call Me ) Mumbai Escorts ...
VIP Independent Call Girls in Mumbai 🌹 9920725232 ( Call Me ) Mumbai Escorts ...
 
Best VIP Call Girls Morni Hills Just Click Me 6367492432
Best VIP Call Girls Morni Hills Just Click Me 6367492432Best VIP Call Girls Morni Hills Just Click Me 6367492432
Best VIP Call Girls Morni Hills Just Click Me 6367492432
 
Call Girls Service Pune ₹7.5k Pick Up & Drop With Cash Payment 9352852248 Cal...
Call Girls Service Pune ₹7.5k Pick Up & Drop With Cash Payment 9352852248 Cal...Call Girls Service Pune ₹7.5k Pick Up & Drop With Cash Payment 9352852248 Cal...
Call Girls Service Pune ₹7.5k Pick Up & Drop With Cash Payment 9352852248 Cal...
 
(INDIRA) Call Girl Srinagar Call Now 8617697112 Srinagar Escorts 24x7
(INDIRA) Call Girl Srinagar Call Now 8617697112 Srinagar Escorts 24x7(INDIRA) Call Girl Srinagar Call Now 8617697112 Srinagar Escorts 24x7
(INDIRA) Call Girl Srinagar Call Now 8617697112 Srinagar Escorts 24x7
 
Top Rated Pune Call Girls Shikrapur ⟟ 6297143586 ⟟ Call Me For Genuine Sex S...
Top Rated  Pune Call Girls Shikrapur ⟟ 6297143586 ⟟ Call Me For Genuine Sex S...Top Rated  Pune Call Girls Shikrapur ⟟ 6297143586 ⟟ Call Me For Genuine Sex S...
Top Rated Pune Call Girls Shikrapur ⟟ 6297143586 ⟟ Call Me For Genuine Sex S...
 
7 tips trading Deriv Accumulator Options
7 tips trading Deriv Accumulator Options7 tips trading Deriv Accumulator Options
7 tips trading Deriv Accumulator Options
 
VIP Independent Call Girls in Mira Bhayandar 🌹 9920725232 ( Call Me ) Mumbai ...
VIP Independent Call Girls in Mira Bhayandar 🌹 9920725232 ( Call Me ) Mumbai ...VIP Independent Call Girls in Mira Bhayandar 🌹 9920725232 ( Call Me ) Mumbai ...
VIP Independent Call Girls in Mira Bhayandar 🌹 9920725232 ( Call Me ) Mumbai ...
 
(Vedika) Low Rate Call Girls in Pune Call Now 8250077686 Pune Escorts 24x7
(Vedika) Low Rate Call Girls in Pune Call Now 8250077686 Pune Escorts 24x7(Vedika) Low Rate Call Girls in Pune Call Now 8250077686 Pune Escorts 24x7
(Vedika) Low Rate Call Girls in Pune Call Now 8250077686 Pune Escorts 24x7
 
W.D. Gann Theory Complete Information.pdf
W.D. Gann Theory Complete Information.pdfW.D. Gann Theory Complete Information.pdf
W.D. Gann Theory Complete Information.pdf
 
(Sexy Sheela) Call Girl Mumbai Call Now 👉9920725232👈 Mumbai Escorts 24x7
(Sexy Sheela) Call Girl Mumbai Call Now 👉9920725232👈 Mumbai Escorts 24x7(Sexy Sheela) Call Girl Mumbai Call Now 👉9920725232👈 Mumbai Escorts 24x7
(Sexy Sheela) Call Girl Mumbai Call Now 👉9920725232👈 Mumbai Escorts 24x7
 
Booking open Available Pune Call Girls Talegaon Dabhade 6297143586 Call Hot ...
Booking open Available Pune Call Girls Talegaon Dabhade  6297143586 Call Hot ...Booking open Available Pune Call Girls Talegaon Dabhade  6297143586 Call Hot ...
Booking open Available Pune Call Girls Talegaon Dabhade 6297143586 Call Hot ...
 
VIP Call Girl in Mira Road 💧 9920725232 ( Call Me ) Get A New Crush Everyday ...
VIP Call Girl in Mira Road 💧 9920725232 ( Call Me ) Get A New Crush Everyday ...VIP Call Girl in Mira Road 💧 9920725232 ( Call Me ) Get A New Crush Everyday ...
VIP Call Girl in Mira Road 💧 9920725232 ( Call Me ) Get A New Crush Everyday ...
 
VIP Call Girl in Mumbai 💧 9920725232 ( Call Me ) Get A New Crush Everyday Wit...
VIP Call Girl in Mumbai 💧 9920725232 ( Call Me ) Get A New Crush Everyday Wit...VIP Call Girl in Mumbai 💧 9920725232 ( Call Me ) Get A New Crush Everyday Wit...
VIP Call Girl in Mumbai 💧 9920725232 ( Call Me ) Get A New Crush Everyday Wit...
 
Call Girls Banaswadi Just Call 👗 7737669865 👗 Top Class Call Girl Service Ban...
Call Girls Banaswadi Just Call 👗 7737669865 👗 Top Class Call Girl Service Ban...Call Girls Banaswadi Just Call 👗 7737669865 👗 Top Class Call Girl Service Ban...
Call Girls Banaswadi Just Call 👗 7737669865 👗 Top Class Call Girl Service Ban...
 
VIP Independent Call Girls in Andheri 🌹 9920725232 ( Call Me ) Mumbai Escorts...
VIP Independent Call Girls in Andheri 🌹 9920725232 ( Call Me ) Mumbai Escorts...VIP Independent Call Girls in Andheri 🌹 9920725232 ( Call Me ) Mumbai Escorts...
VIP Independent Call Girls in Andheri 🌹 9920725232 ( Call Me ) Mumbai Escorts...
 
( Jasmin ) Top VIP Escorts Service Dindigul 💧 7737669865 💧 by Dindigul Call G...
( Jasmin ) Top VIP Escorts Service Dindigul 💧 7737669865 💧 by Dindigul Call G...( Jasmin ) Top VIP Escorts Service Dindigul 💧 7737669865 💧 by Dindigul Call G...
( Jasmin ) Top VIP Escorts Service Dindigul 💧 7737669865 💧 by Dindigul Call G...
 

Cognizant Valuation

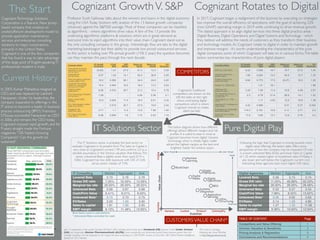
  • 1. The Start Current History Cognizant Rotates to DigitalCognizant GrowthV. S&P Professor Scott Galloway talks about the winners and losers in the digital economy using the USAToday (bottom left) analysis of the 13 fastest growth companies (revenue) against the S&P500 average. Most of these companies can be classified as algorithmic - where algorithms drive value.A few of the 13 provide the underlying algorithmic platforms & solutions which are in great demand as everyone tries to inject algorithms into their value chain. Cognizant stand out as the only consulting company in this group. Interestingly they are late to the digital marketing bandwagon but their ability to provide low priced outsourced services to this sector is fueling over 9% annual growth (15% 5 year); the question becomes can they maintain this pace through the next decade. In 2017, Cognizant began a realignment of the business by executing on strategies too improve the overall efficiency of operations, with the goal of achieving 22% (non-GAAP) operating margin in 2019 while continuing to drive revenue growth. The stated approach is to align digital services into three digital practice areas - Digital Business, Digital Operations and Digital Systems andTechnology - which they believe will address the needs of customers as they transform their business and technology models.As Cognizant rotate to digital in order to maintain growth and improve margins - it’s worth understanding the characteristics of the pure digital companies; some of which Cognizant will take on in various forms.The table below summarizes key characteristics of pure digital players; IT Solutions Sector Pure Digital Play COMPETITORS In 2003, Kumar Mahadeva resigned as CEO, and was replaced by Lakshmi Narayanan. Under his leadership, the company expanded its offerings in the IT arena to become a leader in business process outsourcing (BPO). Francisco D'Souza succeeded Narayanan as CEO in 2006, and remains the CEO today.  Cognizant enjoyed rapid growth, and for 9 years straight made the Fortune magazines "100 Fastest-Growing Companies". Can this growth be sustained? CognizantTechnology Solutions Corporation is aTeaneck, New Jersey- based company that employs an onsite/offshore development model to provide application maintenance services and enterprise consulting solutions to major corporations, primarily in the United States. Cognizant is one of the few companies that has found a way to take advantage of the large pool of English-speaking IT professionals resident in India. Just 13 companies in the current Standard & Poor's 500, including social media giant Facebook (FB), apparel maker Under Armour (UA) and drugmaker Alexion Pharmaceuticals (ALZN), have consistently and definitively posted faster revenue growth than the average company and are expected to do it again this year, according to a USA TODAY analysis of data from S&P Global Market Intelligence (based on 2015 results). Company Name 5Y Growth (revenues) 2 Year Beta EBIT Margin Return on Equity Return on Capital EV/ Revenues International Business Machines Corporation (NYSE:IBM) (5.63) 1.01 27.0 61.3 12.3 2.25 Accenture plc (NYSE:ACN) 5.07 1.02 14.1 42.0 36.8 2.55 Tata Consultancy Services Limited (NSEI:TCS) 16.0 0.592 26.1 34.0 24.6 4.05 Cognizant Technology Solutions Corporation (NasdaqGS:CTSH) 15.4 0.943 16.2 18.2 13.3 2.63 Infosys Limited (NSEI:INFY) 8.06 0.333 26.7 21.2 15.4 2.78 DXC Technology Company (NYSE:DXC) 1.59 - - 4.54 5.36 2.1 Wipro Limited (BSE: 507685) 10.9 0.504 17.4 16.5 8.51 2.34 HCL Technologies Limited (NSEI:HCLTECH) - 0.515 20.7 27.9 18.9 2.44 Capgemini SE (ENXTPA:CAP) 4.71 1.1 11.2 13.9 7.96 1.44 NTT Data Corporation (TSE:9613) 8.98 0.694 7.8 7.74 6.03 1.16 Company Name 5Y Growth (revenues) 2 Year Beta EBIT Margin Return on Equity Return on Capital EV/ Revenues WPP plc (LSE:WPP) 8.22 0.556 19.7 19.7 8.73 1.45 Omnicom Group Inc. (NYSE:OMC) 1.66 0.824 14.2 40.9 15.7 1.35 Publicis Groupe S.A. (ENXTPA:PUB) 9.64 0.773 17.5 (8.47) 10.0 1.52 Dentsu Inc. (TSE:4324) - 1.21 18.1 - - 1.88 JCDecaux SA (ENXTPA:DEC) 3.45 1.08 11.4 10.9 4.08 2.57 The Interpublic Group of Companies, Inc. (NYSE:IPG) 2.3 0.79 21.4 26.6 14.1 1.22 CyberAgent, Inc. (TSE: 4751) - 1.11 4.93 12.9 19.8 1.38 Hakuhodo DY Holdings Inc (TSE:2433) 4.42 0.986 - 9.31 9.37 0.345 Compagnie du Cambodge (ENXTPA:CBDG) 114.3 0.191 12.6 4.11 3.71 2.2 Ströer SE & Co. KGaA (DB:SAX) 17.8 0.65 13.7 13.8 5.74 3.2 CUSTOMERSVALUE CHAIN* The below diagram shows how different offerings attract different margins and risk profiles. It is useful to bear in mind as Cognizant becomes ‘more digital’. Genesis technology which is initially highly visible attract the highest margins as the best and brightest master the solution space. Cognizant’s traditional competitors are shown on the left; the table on the right shows contrasting digital competitors which is where Cognizant intends to rotate, albeit partially. ValueChain Evolution BlockChain Machine Learning BPO Application Services Digital Platforms Digital Operations Digital Media Systems Integration Genesis Custom Product Commodity VisibleInvisible IT Consulting Median Aggregate Ave Levered Beta 0.73 0.76 0.76 Gross D/E ratio 7.25% 16.45% 15.56% Marginal tax rate 26.00% 26.00% 28.55% Unlevered Beta 0.69 0.67 0.68 Cash/Firm Value 6.41% 8.01% 8.63% Unlevered Beta* 0.74 0.73 0.75 EV/Sales 2.03 1.93 3.90 Sales to capital 1.81 1.90 2.65 EBIT margin 8.13% 11.48% 10.85% Infra- Structure Digital Agencies Median Aggregate Ave Levered Beta 0.56 0.74 0.74 Gross D/E ratio 11.05% 40.66% 50.53% Marginal tax rate 26.00% 26.00% 28.48% Unlevered Beta 0.52 0.57 0.54 Cash/Firm Value 7.96% 8.52% 13.62% Unlevered Beta* 0.56 0.62 0.63 EV/Sales 2.14 1.59 4.80 Sales to capital 1.27 1.32 11.06 EBIT margin 9.36% 10.84% 12.94% Blue items used in calculations * Unlevered Beta corrected for cash Lower MarginHigher Margin Digital Traditional The IT Solutions sector is probably the best sector to evaluate Cognizant in its present form.The Sales to Capital is very close to Cognizant’s current 1.99 and confirms 2.0 as a sensible assumption in the intrinsic valuation that follows.The sector unlevered Beta is slightly lower then used (0.74 v. 0.86). Cognizant has low debt exposure with D/E of 3.6% versus sector median of 7.5%. Following the logic that Cognizant is moving towards more digital value offerings, the below table offers some perspective of how the company may be impacted. Of note is a lower unlevered Beta (0.56) and lower Sales to Capital of 1.32 which implies higher re-investment rates. EV/Sales is also lower and well below the Cognizant’s current 2.63. Interesting these agencies have much higher D/E ratios. *For more on Strategy Mapping see Simon Wardley at http://blog.gardeviance.org TABLE OF CONTENT Page Competitors and Value Offering 1 Intrinsic Valuation & Sensitivity 2 Pricing Analysis & Regression 3 Conclusions and Recommendations 4
  • 2. Value/Share Revenue Growth 7% 8% 9% 10% 11% 15% 63 66 69 72 75 16% 67 70 73 76 79 17% 70 73 77 80 84 18% 74 77 80 84 88 19% 77 80 84 88 92 20% 80 84 88 92 97 21% 84 88 92 96 101 Operating Margin The FutureAn intrinsic model has been built based on current revenues and growth of 9%. The operating margins begin at 17% but various scenarios are tested on the bottom right of this page.The table below summarizes the valuation based on the tables and comments on this page; INTRINSICVALUE SCENARIOSWACC This model shows different share values over Operating Margin and Revenue growth. The yellow is current model. Financial Services Med Agg Ave Levered Beta 1.12 1.10 1.10 Unlevered Beta* 0.90 1.80 1.00 EV/Sales 3.52 2.40 17.66 Segments Healthcare Med Agg Ave Levered Beta 0.82 0.87 0.87 Unlevered Beta* 0.77 0.83 0.83 EV/Sales 4.46 2.40 6.34 Products, Resource Med Agg Ave Levered Beta 0.94 0.95 0.95 Unlevered Beta* 0.79 0.78 0.76 EV/Sales 2.24 1.69 2.90 Comms, Media,Tech Med Agg Ave Levered Beta 1.00 1.00 1.00 Unlevered Beta* 0.99 0.98 0.94 EV/Sales 3.66 3.29 5.13 *Unlevered Beta corrected for cash Blue items used in calculations Business Revenue EV/Sales Value UL Financial $5,511.00 2.40 $13,226.40 0.90 Healthcare $4,051.00 2.40 $9,722.40 0.77 Products $2,851.00 1.69 $4,818.19 0.79 CMT $1,718.00 3.29 $5,652.22 0.99 Company $14,131 $33,419.21 0.8615 Beta
 Using customer segments as a surrogate for the risk generates a unlevered Beta os 0.86.This translates to a levered Beta of 0.88. Interestingly this is very close to the sector Beta for Computer Services (0.89). Another perspective is from the direct competitors who have a bottom up unlevered Beta of 0.74.As Cognizant implements its ‘digital’ strategy the Beta should decrease moving somewhat towards towards 0.56 - the bottom up Beta for Digital Agencies. See Scenarios (right) for implications of lowering Beta. Region* Revenues ERP Weight ERP-Weighted Europe 1,082 6.23% 7.66% 0.4769% North America 11,037 4.86% 78.10% 3.7959% Rest of World 884 6.73% 6.26% 0.4212% United Kingdom 1,128 5.34% 7.98% 0.4262% Total 14,131 100.00% 5.1203% Cost of Capital is composed of Cost of Equity plus Cost of Debt.The Cost of Equity is calculated on a risk free rate of 2.28% plus the levered beta x the weighted ERP (shown above based on the weighted revenue generated at the regions).The levered beta is calculated using a Debt/Equity of 3.64% and tax at the margin of 26%.This provides a cost of equity of 6.81% The Cost of Debt is based on a 0.6% spread based on a synthetic rating (Aaa/AAA) on Cognizant’s Interest coverage ratio; yielding a pre-tax cost of debt of 2.88% The overall Weighted Average Cost of Capital (WACC) is 6.64% (taking the operating leases into account). Terminal cash flow 2,365.51$ Terminal cost of capital 6.78% Terminal value 52,566.87$ PV(Terminal value) 27,531.96$ PV (CF over next 10 years) 14,226.06$ Sum of PV 41,758.02$ Probability of failure = 0.00% Proceeds if firm fails = $20,879.01 Value of operating assets = 41,758.02$ - Debt 1,526.54$ - Minority interests -$ + Cash 4,713.00$ + Non-operating assets 304.61$ Value of equity 45,249.09$ - Value of options $123.44 Value of equity in common stock 45,125.65$ Number of shares 589.65 Estimated value /share 76.53$ Price 72.00$ Price as % of value 94.08% Base year 1 2 3 4 5 6 7 8 9 10 Terminal year Revenue growth rate 9.00% 9.00% 9.00% 9.00% 9.00% 7.66% 6.31% 4.97% 3.62% 2.28% 2.28% Revenues 14,131.00$ 15,402.79$ 16,789.04$ 18,300.05$ 19,947.06$ 21,742.30$ 23,406.67$ 24,883.63$ 26,119.10$ 27,064.61$ 27,680.33$ 28,310.06$ EBIT (Operating) margin 16.59% 16.63% 16.67% 16.72% 16.76% 16.80% 16.84% 16.88% 16.92% 16.96% 17.00% 17.00% EBIT (Operating income) 2,344.76$ 2,562.05$ 2,799.47$ 3,058.87$ 3,342.29$ 3,651.94$ 3,941.03$ 4,199.83$ 4,418.99$ 4,589.97$ 4,705.66$ 4,812.71$ Tax rate 24.90% 24.90% 24.90% 24.90% 24.90% 24.90% 25.12% 25.34% 25.56% 25.78% 26.00% 26.00% EBIT(1-t) 1,760.91$ 1,924.10$ 2,102.40$ 2,297.21$ 2,510.06$ 2,742.61$ 2,951.04$ 3,135.60$ 3,289.49$ 3,406.67$ 3,482.19$ 3,561.41$ - Reinvestment 635.90$ 693.13$ 755.51$ 823.50$ 897.62$ 832.19$ 738.48$ 617.74$ 472.76$ 307.86$ 1,195.90$ FCFF 1,288.21$ 1,409.28$ 1,541.71$ 1,686.56$ 1,844.99$ 2,118.85$ 2,397.12$ 2,671.76$ 2,933.92$ 3,174.33$ 2,365.51$ NOL -$ -$ -$ -$ -$ -$ -$ -$ -$ -$ -$ -$ Cost of capital 6.64% 6.64% 6.64% 6.64% 6.64% 6.67% 6.69% 6.72% 6.75% 6.78% 6.78% Cumulated discount factor 0.9377 0.8793 0.8246 0.7732 0.7251 0.6797 0.6371 0.5970 0.5592 0.5238 PV(FCFF) 1,207.99$ 1,239.22$ 1,271.25$ 1,304.09$ 1,337.75$ 1,440.29$ 1,527.20$ 1,594.97$ 1,640.75$ 1,662.56$ Implied variables Base year 1 2 3 4 5 6 7 8 9 10 After year 10 Sales to capital ratio 2.00 2.00 2.00 2.00 2.00 2.00 2.00 2.00 2.00 2.00 Invested capital 7,793$ 8,428$ 9,122$ 9,877$ 10,701$ 11,598$ 12,430$ 13,169$ 13,787$ 14,259$ 14,567$ ROIC 22.60% 22.83% 23.05% 23.26% 23.46% 23.65% 23.74% 23.81% 23.86% 23.89% 23.90% 6.78% Cognizant has been growing at 9% which close too the sector median Current Operating Margin growing to 17% - see Scenarios below for alternatives Cost of Capital (see below) grows slightly to typical mature company inYear 10 Current sales/capital ratio is 2 and the sector has an aggregate of 1.9; it’s reasonable to assume this will remain at 2 Return on Capital grows to 24% from 22.6% - sector average 23% Reinvestment Rate =2.28/6.78=33.58% New US MarginalTax Rate 26% Value per share is $76.53 based on 9% per year revenue growth and 17% margin. See scenario tab for sensitivity as Cognizant management desire a 20% margin target. ROIC Revenue Growth 7% 8% 9% 10% 11% 15% 20.9% 21.0% 21.1% 21.2% 21.2% 16% 22.3% 22.4% 22.5% 22.6% 22.6% 17% 23.7% 23.8% 23.9% 24.0% 24.0% 18% 25.1% 25.2% 25.3% 25.4% 25.5% 19% 26.5% 26.6% 26.7% 26.8% 26.9% 20% 27.9% 28.0% 28.1% 28.2% 28.3% 21% 29.3% 29.4% 29.5% 29.6% 29.7% Operating Margin Value/Share Levered Beta 0.70 0.75 0.80 0.85 0.90 15% 72 71 70 70 69 16% 76 75 74 73 72 17% 80 79 78 77 76 18% 85 83 82 81 80 19% 89 87 86 85 84 20% 93 91 90 89 88 21% 97 95 94 93 91 Operating Margin This shows the impact of different Revenue growth and Operating Margin changes on Return on Invested Capital. Green is improvement over current. In this scenario we examine the sensitivity in Beta at various Operating Margins. 0.05 points in Beta moves the price by approximately $1 Current Model Currently Cognizant is trading in a band of $70 to $72; on release of Q3 it was trading at $76 Glossary
 PV - Present Value
 FCFF - Free Cash Flows to Firm
 NOL - Net Operating Loss
 ERP - Equity Risk Premium
 WACC - Weighted Average Cost of Capital
 Med - Median;Age - Aggregate
 Ave - Average
 UL - Unlevered Beta *Notes on Regions:
 Unfortunately Cognizant does not provide useful details on its regional business and prefers to consolidate into area’s like ‘Rest of World’ and it’s definition of Europe is nebulous.This makes it difficult to estimate an accurate Equity Risk Premium. Since NA is a large percentage weight the impact is currently minimal.
  • 3. PRICING 1Year EV/S The Market Grouping the Cognizant competitors produces a global set of 85 companies that compete with Cognizant within the same industry sector with at least $1B of market capitalization namely - IT Consulting and Other Services. Thirty of these are direct competitors of similar scope as mentioned in various industry reports.
 
 Selecting multiples of enterprise value is likely the best measure of firms who’s primary asset are their employees. Measures of Enterprise Value to Invested Capital and EnterpriseValue to Revenues are examined as indicators of pricing discrepancies and predictors. 0 5 10 15 20 25 30 1 3 5 7 9 11 13 15 17 19 21 23 25 27 29 31 33 35 37 39 Frequency Distribution EV/Sales EV/IC The Frequency Distribution above shows how both EV/Sales and EV/IC are distributed around a skewed distribution of multiple frequency.The sector aggregate values of 3.67 (EV/IC) and 1.93 (EV/S) are closely correlated with the median. Cognizant is currently trading at multiples of 5.46 (EV/IC) and 2.68 (EV/S). This would tend to indicate that the market is overpricing Cognizant. ACN TCS IBM INFY CTSH Growth ROIC DFR EV/IC Forecast EV/IC Under/ Over % IBM 5.63 16.92 26.75 3.38 3.97 -17.3% Accenture 5.07 74.31 3.35 15.07 15.33 -1.7% Tata 16 47.64 0.76 11.45 10.71 6.5% Cognizant 15.4 25.62 3.50 5.46 6.52 -19.5% Infosys 8.06 30.74 - 5.24 7.41 -41.3% DXC 1.59 4.61 24.80 1.82 1.65 9.2% Wipro 10.9 18.62 9.43 4.17 4.94 -18.3% HCL 0 24.62 1.76 4.61 6.03 -30.8% Capgemini 4.71 9.69 19.62 2.19 2.82 -28.6% NTT 8.98 6.19 24.22 1.84 2.13 -16.0% The above table shows a regression of expected Revenue growth over the next 5 years, Return on Invested Capital and Debt/Capital against EnterpriseValue to Invested Capital. The regression highlights Cognizant being undervalued by nearly 20% and renders a forecast EnterpriseValue of $46M. The R-Squared is an excellent 72%, however there should be caution over the standard error of 1.73 which is high against the EV/IC median of 3.49.When taking the entire sector of 85 companies into the regression the R-Squared drops to 21% EV/IC Regression Statistics Coefficients t Stat Multiple R 0.86914982 Intercept 1.50796902 1.50211105 R Square 0.75542141 Growth 0.02338696 0.63188241 Adjusted R Square0.72720081 ROIC 0.18572347 7.03399052 Standard Error1.73033293 DFR -0.030361 -0.9321913 Observations 30 6.18 0.43 Regression Statistics Coefficients t Stat Multiple R 0.79334665 Intercept -0.054601 -0.0488684 R Square 0.62939891 OpMargin 0.20929319 6.14814665 Adjusted R Square0.57010273 DFR 0.03457438 1.35804816 Standard Error1.43649958 Tax -0.0350549 -1.1814995 Observations 30 Growth 0.03076679 0.99358861 Operating Margin DFR Tax (eff) Growth EV/ Sales Forecast EV/Sales Under/ Over % IBM 15.72 26.75 5 5.63 2.33 4.16 -78.6% Accenture 14.77 3.35 21 5.07 2.62 2.57 2.1% Tata 25.06 0.76 24 16 4.07 4.88 -19.9% Cognizant 16.99 3.50 23 15.4 2.68 3.30 -23.4% Infosys 24.50 - 28 8.06 2.82 4.35 -54.3% DXC 7.20 24.80 23 1.59 2.10 1.57 25.2% Wipro 16.42 9.43 23 10.9 2.49 3.24 -30.5% HCL 20.05 1.76 18 0 2.54 3.56 -40.3% Capgemin i 10.32 19.62 14 4.71 1.56 2.44 -56.9% NTT 6.27 24.22 40 8.98 1.15 0.98 15.4% EV/Sales The above table shows a regression of expected Operating Margin, Debt/Capital, EffectiveTax Rate and Revenue growth over the next 5 years against EnterpriseValue to Sales. The regression highlights Cognizant being undervalued by nearly 23% and renders a forecast EnterpriseValue of $48M. The R-Squared is an good 63%, however there should be caution over the standard error of 1.44 which is high against the EV/S median of 2.03.When taking the entire sector of 85 companies into the regression the R-Squared drops to 43% Regression Statistics Coefficients t Stat Multiple R 0.5385302 Intercept 6.88480888 5.74804798 R Square 0.29001478 Growth -0.0109217 -0.1736098 Adjusted R Square0.2080934 EBI/Employee-0.0034182 -0.0251126 Standard Error 2.9481197 DFR -0.1498328 -3.164286 Observations 30 Consulting companies are intrinsically linked to the quality and numbers of employees who are generating revenues and providing leverage over their costs. In the above regression we substitute EBIT/Employee for ROIC and attempted further regressions which drops the R-Squared to 29% and yields a unacceptable standard error of 3. Regression Statistics Coefficients t Stat Multiple R 0.53232302 Intercept 3.21865624 2.48792605 R Square 0.2833678 Revenue/Employee0.05432973 2.73430217 Adjusted R Square0.16870665 DFR -0.0397839 -1.2327999 Standard Error1.99756223 Tax -0.0623765 -1.4831117 Observations 30 Growth 0.03130246 0.71843109 In this scenario we have taken Revenues/ Employee as a replacement for Operating Margin. The attempted regressions drops R- Squared to 28% and yields a standard error of 2. $46,217 Regression Enterprise Value: $47,720 Regression Enterprise Value: The regression of the direct 30 competitors yields some contrasting perspectives.The regressions is forecasting that EV/IC can potentially move up 20% and that EV/Sales has 23% capacity.The implications are calculated EnterpriseValue which is very similar for both regressions of $46-47B; we will compare this shortly with the intrinsic appraisal. The below graph shows trading history of EV to Sales for the 4 major competitors. Notice how around May 2017 the markets took a major re-valuation of the players, notably pushing IBM lowest (high debt) and Accenture and Cognizant upwards. EV/IC (forecast)= 
 1.51+0.023xG+0.186xROIC-0.03xDFR EV/S (forecast) = -0.055+0.21xOM+0.035xDFR-0.035xT+0.031xG IT Services Median Aggregate EV/IC (85) 3.49 3.67 EV/IC (30) 3.55 3.35 IT Services Med Aggregate EV/Sales (85) 2.03 1.93 EV/Sales (30) 2.07 2.26 Glossary
 EV - Enterprise Value
 EV/IC - Enterprise Value/Invested Capital
 EV/S - Enterprise Value to Revenue
 DFR - Debt to Capital
 ROIC - Return on Capital
  • 4. Share Price CONCLUSIONS BUY Action Presented by Malcolm Silberman January 3rd 2018 Cognizant share price has been on a constant rise as it met and exceeded its high growth targets. Lately the market seems to be lowering its estimates of growth targets.The intrinsic valuation shows a slight discount on the intrinsic value. Recently as shown in the below pricing graph the price has dropped slightly with the release of third quarter results. 
 Management has set a target of 20% (for 2019) operating margin improvement from the current 17%. Currently the markets seem reluctant to buy into the margin improvement strategy and the stated movement into digital offerings.This is understandable as many consulting organizations have struggled to embrace these digital agency models. Interestingly digital agencies are attempting to become more consulting focused and are also finding this path difficult. It is likely that the market consensus is based on a wait and see philosophy. Tax Assumptions PricingValuation IT Services 85 30 Cognizant EV/IC 3.67 3.35 5.46 EV/S 1.93 2.26 2.68 EV (regression) See pg. 3 $47B Cognizant 30 Current Valuation Revenue Growth 14.4% 8.95% 9% Operating Margin 13.3% 17% 17% EV $24B $39B $41,76B Terminal cash flow 2,365.51$ Terminal cost of capital 6.78% Terminal value 52,566.87$ PV(Terminal value) 27,531.96$ PV (CF over next 10 years) 14,226.06$ Sum of PV 41,758.02$ Probability of failure = 0.00% Proceeds if firm fails = $20,879.01 Value of operating assets = 41,758.02$ - Debt 1,526.54$ - Minority interests -$ + Cash 4,713.00$ + Non-operating assets 304.61$ Value of equity 45,249.09$ - Value of options $123.44 Value of equity in common stock 45,125.65$ Number of shares 589.65 Estimated value /share 76.53$ Price 72.00$ Price as % of value 94.08% The valuation is conservatively based on 9% revenue growth and 17% operating margin.The competitors set of 30 with market capitalization > $4B reflects a higher revenue growth of 14% and lower operating margins of 13%. Managements stated intent is to grow operating margin to 22% (non-GAAP) which we calculate as 20% and have built that into our cashflow forecast over 10 years. Clearly management would like a more aggressive timetable. If they meet this goal in 2019 as desired the projected share price is $88 (see page 2 Scenarios). The pricing indicators are a somewhat contrarian to each other.The above table shows IT services i.e. the Cognizant competitor set.The 85 represents the 85 competitors with market capitalization > $1B and the 30 represents direct competitors with a market capitalization > $4B. In both cases of EV/IC and EV/S Cognizant is trading overpriced. However the regression analysis showed a forecast of $46-47B in EnterpriseValue based on the market view of the 30 competitor set. At $46B this would imply a share price of approximately $83. SUMMARY The market seems a to be raising a concern about Cognizant maintaining its leadership as one of the S&P500 top revenue growth companies.This probably explains the current dichotomy between the current high multiples Cognizant attracts versus the regression opportunities. However the fundamentals from the valuation models show that Cognizant has some intrinsic value. Currently the model predicts it is priced at a slight discount of 94%.The market has not yet factored in (or believed) the management objective of 20% operating margin while maintaining the 9% year on year revenue growth, also the Beta should drop by half to one unit as the company evolves to a more digital orientated business model.This analysis (page 2) indicates that at 20% Operating Margins and 0.5 drop in Beta the share price could reach $88-90. Given the strong indicators from the regression models ($83) and the valuation fundamentals a BUY is proposed on Cognizant. BUSINESS MODEL A short note to cover back on the evolution of Cognizant’s business model which opened the story on page one. Managements stated objectives are moving towards more digital offerings and increasing Operating Margins by at least 3 points - all the while maintaining 9% plus revenue growth. Fortunately the digital space has constantly evolving opportunities to add value. In particular there is great demand for two newish technologies, namely Machine Learning (AI) and Blockchain. Both of these are within the managements stated strategy. Cognizant is well positioned to provide these services and certainly in the early days will garner high margins which will mature like all other technologies as they become more commoditized. However this constant cycling from genesis to commodity bodes well for the company.As many customers aspire to become more algorithmic these services will have a strong demand. A note on the marginal tax assumptions. Late in December 2017 the US Senate passed legislation decreasing the US marginal tax rate from 35% to 21%. Previous calculations where based on a 40% marginal tax rate (taking state taxes into account). For this evaluation the new rate of 26% (including state taxes) was used for both intrinsic and pricing calculations. Computer Services 929 EV/IC 4.00 EV/S 1.13 Sales to Capital 3.54 As an alternative the above table reflects on the multiples from the Computer Services sector.This is a far broader segment consisting of 929 companies. Here you can see a higher EV/IC against the IT services sector of about 0.4.The EV/S is lower in the Computer Services by approximately 0.7. Against this sector Cognizant is still trading at higher multiples and still looking expensive. Glossary
 30 - this is 30 direct competitors with market capitalization > $4B
 85 - the is the 85 IT Services companies with market capitalization > $1B
 929 - these are 929 companies in the Computer Services sector
 Current - these are the latest financial numbers
 Valuation - these are the financial numbers used in the intrinsic valuation on page 2
 EV - Enterprise Value
 EV/IC - Enterprise Value/Invested Capital
 EV/S - Enterprise Value to Revenue malcsilberman@gmail.com