SlideShare une entreprise Scribd logo
1  sur  19
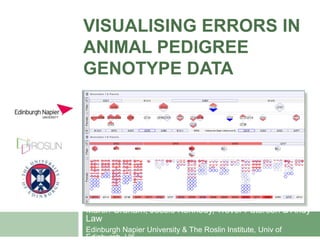
VISUALISING ERRORS IN
ANIMAL PEDIGREE
GENOTYPE DATA


Martin Graham, Jessie Kennedy, Trevor Paterson & Andy
Law
Edinburgh Napier University & The Roslin Institute, Univ of
Edinburgh, UK
2 years ago at Firbush...
   I said:
   “Aim is to develop interactive tools to locate and isolate errors in pedigree genotype
    data in their datasets”

   Where a
     Pedigree= Family tree of related animals
     Genotype = Genetic makeup of an organism
Inheritance Basics (Very)
   Humans have DNA
   They in fact have 2 lots of DNA
    (diploidy), which may or may not match at
    certain points
             Two lots of DNA bundled in a
        chromosome


   When two parents produce offspring, one lot of
    DNA is passed onto the child from each parent
     Which    lot is used changes just to shuffle things up
        a bit more
Inheritance Basics (Very)
   By looking at many, many Single Nucleotide
    Polymorphisms markers (points where we
    know things vary between individuals at the
    level of single DNA letters) we can check for
    errors
                                 A G    A C     A C


   If one letter from each parent at these points
    turns up in the same place in the child’s DNA
    everything is good
Errorz
   But inevitably....              Nothing inherited from mum
     Errorscreep in for various
      reasons, bad record-          A G        C C         C C

      keeping, observations...
                                    Nothing inherited from dad

                                    A G        C A         G G

                                    Novel allele. No inheritance
                                    from one parent, but we
     Muddled  DNA                  can’t tell which...
      sampling, animals “jumping    A G        C A         T     A
      the fence” etc etc
     Unusable data in this state
Thus
   There is a constant need to clean up pedigree
    data
   Roslin have a tool that views data as a table
    (markers by individuals), so pedigree-based
    patterns to error, such as the wrong dad for an
    entire set of offspring, were very hard to spot


   So they wanted a new tool, with a funky
Layouts
   So (2 years ago) we looked at pedigree
    layouts
     And   they were all rubbish
Layouts
   Didn’t scale, became intractable to follow relationships, couldn’t
    resolve generations, often only individual-out views rather than
    whole pedigree etc
Layouts
   So we developed what we called the sandwich
    view. Between neighbouring generations, we
    draw
     Dads  as the top slice of bread
     Mums as the bottom slice of bread

     Kids as the filling


     Errors   colour-coded across the marker set, more
Layouts
   Each family forms a block between the
    respective mum and dad, making it easy to
    see who is who’s offspring/parents
   Layout works as males mate with multiple
    females in each generation but the opposite is
    rare
Layouts
   Each child forms a glyph used to
    show error
   Divided into three parts
     Up  triangle coloured if error with dad
     Down triangle coloured if error with
      mum
     Middle band coloured if error, but
      parent in error is unknown (novel
      allele)
   Lo, pedigree-based error patterns
    revealed themselves
Layouts
   Tables full of data and histograms to show
    error distribution by marker and individuals
    also help
Cleaning
   So, we can show errors nicely
   But the aim is to get rid of all these errors
   Masking is when we pretend we don’t know
    the values for particular markers / individuals /
    combinations thereof
   What happens then is that those values are
    inferred from the corresponding values in the
    parents                    A G      G C
    A G     C C     C C

                                  ?   ?   C C    C C
Cleaning
   The visualisations lets the biologist mask
    individuals / bunches of markers / individual
    genotype points / relationships


   These are then shown in blue in the interface
Cleaning
   This last point’s important as pedigree errors
    just propagate down the pedigree. A wrong
    parent for a child can’t be cured by hiding the
    child


   It’s also why we cant clean these data sets
    automatically, the biologists judgement in what
The Goal
   Eventually we want a display with no nasty red
    colours and then we can save it as a “clean”
    data set
     Though   obviously with lots of missing data
     But the biologists say their tools can handle
      missing things, but wrong things blow them up
     And we did have to stick in a final “auto clean up”
      button to fix sporadic errors that would have taken
      ages to fix manually
     But the major systematic errors are fixed by the
      biologist
User Test
   We did a user test with 11 biologists at Roslin
   They preferred the new tool to the table-like
    tool
   Probably the most interesting thing past the
    numbers was once again how much a bunch
    of scientists are in thrall to Excel
     Just  like the taxonomists we’ve worked with /
      social scientists we’re writing a proposal with
     Which is why the Roslin guys made a table-a-like
      tool in the first place to try and appease them
Conclusion
   Built successful tool (got it published in
    EuroVis, BioVis and AVI)
   Whether it’s successful from the biologists
    point of view...
     During the project, marker set sizes jumped from
      thousands to hundreds of thousands
     Sequencing the data used to be the costly part of
      the process, staff time to clean it up was relatively
      cheap
     Biology in general is having a data crisis, some
      opinions say its cheaper/easier to redo
      experiments than store the TBs of information
Conclusion
   Available at www.viper-project.org
   Did do JavaDocs this time

   I enjoyed it

Contenu connexe

Similaire à Final Viper Prototype Presentation

Visualising errors in animal pedigree genotype data
Visualising errors in animal pedigree genotype dataVisualising errors in animal pedigree genotype data
Visualising errors in animal pedigree genotype datamartinjgraham
 
What is DNA.ppt
What is DNA.pptWhat is DNA.ppt
What is DNA.pptRaulemar1
 
A detailed lesson plan in biology for grade 9
A detailed lesson plan in biology for grade 9A detailed lesson plan in biology for grade 9
A detailed lesson plan in biology for grade 9swissmitchick
 
Dragon Genetics Hands on LabIntroductionThere are many patterns o.docx
Dragon Genetics Hands on LabIntroductionThere are many patterns o.docxDragon Genetics Hands on LabIntroductionThere are many patterns o.docx
Dragon Genetics Hands on LabIntroductionThere are many patterns o.docxmadlynplamondon
 
Dna fingerprinting activity
Dna fingerprinting activityDna fingerprinting activity
Dna fingerprinting activityDayle Kristopher
 
2014 whitney-public-talk
2014 whitney-public-talk2014 whitney-public-talk
2014 whitney-public-talkc.titus.brown
 
Data monetization
Data monetizationData monetization
Data monetizationGramener
 
Module 7 part 1
Module 7   part 1Module 7   part 1
Module 7 part 1pamiepk
 
Tour of the basics
 Tour of the basics Tour of the basics
Tour of the basicsJanna Naypes
 
Genealogia Y Dna
Genealogia Y DnaGenealogia Y Dna
Genealogia Y Dnaguest940c24
 
Biology 106 EpistasisSex linked TraitsAnswer each question in.docx
Biology 106 EpistasisSex linked TraitsAnswer each question in.docxBiology 106 EpistasisSex linked TraitsAnswer each question in.docx
Biology 106 EpistasisSex linked TraitsAnswer each question in.docxhartrobert670
 
Meiosis Block 2 PPT Breakdown
Meiosis Block 2 PPT BreakdownMeiosis Block 2 PPT Breakdown
Meiosis Block 2 PPT BreakdownChristen Mamenko
 

Similaire à Final Viper Prototype Presentation (20)

Visualising errors in animal pedigree genotype data
Visualising errors in animal pedigree genotype dataVisualising errors in animal pedigree genotype data
Visualising errors in animal pedigree genotype data
 
What is DNA.ppt
What is DNA.pptWhat is DNA.ppt
What is DNA.ppt
 
A detailed lesson plan in biology for grade 9
A detailed lesson plan in biology for grade 9A detailed lesson plan in biology for grade 9
A detailed lesson plan in biology for grade 9
 
Dragon Genetics Hands on LabIntroductionThere are many patterns o.docx
Dragon Genetics Hands on LabIntroductionThere are many patterns o.docxDragon Genetics Hands on LabIntroductionThere are many patterns o.docx
Dragon Genetics Hands on LabIntroductionThere are many patterns o.docx
 
Dna fingerprinting activity
Dna fingerprinting activityDna fingerprinting activity
Dna fingerprinting activity
 
Introduction to heredity curriculum final
Introduction to heredity curriculum finalIntroduction to heredity curriculum final
Introduction to heredity curriculum final
 
2014 whitney-public-talk
2014 whitney-public-talk2014 whitney-public-talk
2014 whitney-public-talk
 
Data monetization
Data monetizationData monetization
Data monetization
 
Module 7 part 1
Module 7   part 1Module 7   part 1
Module 7 part 1
 
2014 villefranche
2014 villefranche2014 villefranche
2014 villefranche
 
IB REVIEW - GENETICS
IB REVIEW - GENETICSIB REVIEW - GENETICS
IB REVIEW - GENETICS
 
Designer babies
Designer babiesDesigner babies
Designer babies
 
B1 lesson part one
B1 lesson part oneB1 lesson part one
B1 lesson part one
 
Tour of the basics
 Tour of the basics Tour of the basics
Tour of the basics
 
01 genetics version 2
01 genetics version 201 genetics version 2
01 genetics version 2
 
Genealogia Y Dna
Genealogia Y DnaGenealogia Y Dna
Genealogia Y Dna
 
Biology 106 EpistasisSex linked TraitsAnswer each question in.docx
Biology 106 EpistasisSex linked TraitsAnswer each question in.docxBiology 106 EpistasisSex linked TraitsAnswer each question in.docx
Biology 106 EpistasisSex linked TraitsAnswer each question in.docx
 
Baby lab 2019
Baby lab 2019Baby lab 2019
Baby lab 2019
 
What is Genetics
What is GeneticsWhat is Genetics
What is Genetics
 
Meiosis Block 2 PPT Breakdown
Meiosis Block 2 PPT BreakdownMeiosis Block 2 PPT Breakdown
Meiosis Block 2 PPT Breakdown
 

Dernier

Making and Justifying Mathematical Decisions.pdf
Making and Justifying Mathematical Decisions.pdfMaking and Justifying Mathematical Decisions.pdf
Making and Justifying Mathematical Decisions.pdfChris Hunter
 
Python Notes for mca i year students osmania university.docx
Python Notes for mca i year students osmania university.docxPython Notes for mca i year students osmania university.docx
Python Notes for mca i year students osmania university.docxRamakrishna Reddy Bijjam
 
Holdier Curriculum Vitae (April 2024).pdf
Holdier Curriculum Vitae (April 2024).pdfHoldier Curriculum Vitae (April 2024).pdf
Holdier Curriculum Vitae (April 2024).pdfagholdier
 
How to Give a Domain for a Field in Odoo 17
How to Give a Domain for a Field in Odoo 17How to Give a Domain for a Field in Odoo 17
How to Give a Domain for a Field in Odoo 17Celine George
 
TỔNG ÔN TẬP THI VÀO LỚP 10 MÔN TIẾNG ANH NĂM HỌC 2023 - 2024 CÓ ĐÁP ÁN (NGỮ Â...
TỔNG ÔN TẬP THI VÀO LỚP 10 MÔN TIẾNG ANH NĂM HỌC 2023 - 2024 CÓ ĐÁP ÁN (NGỮ Â...TỔNG ÔN TẬP THI VÀO LỚP 10 MÔN TIẾNG ANH NĂM HỌC 2023 - 2024 CÓ ĐÁP ÁN (NGỮ Â...
TỔNG ÔN TẬP THI VÀO LỚP 10 MÔN TIẾNG ANH NĂM HỌC 2023 - 2024 CÓ ĐÁP ÁN (NGỮ Â...Nguyen Thanh Tu Collection
 
Energy Resources. ( B. Pharmacy, 1st Year, Sem-II) Natural Resources
Energy Resources. ( B. Pharmacy, 1st Year, Sem-II) Natural ResourcesEnergy Resources. ( B. Pharmacy, 1st Year, Sem-II) Natural Resources
Energy Resources. ( B. Pharmacy, 1st Year, Sem-II) Natural ResourcesShubhangi Sonawane
 
Beyond the EU: DORA and NIS 2 Directive's Global Impact
Beyond the EU: DORA and NIS 2 Directive's Global ImpactBeyond the EU: DORA and NIS 2 Directive's Global Impact
Beyond the EU: DORA and NIS 2 Directive's Global ImpactPECB
 
Unit-V; Pricing (Pharma Marketing Management).pptx
Unit-V; Pricing (Pharma Marketing Management).pptxUnit-V; Pricing (Pharma Marketing Management).pptx
Unit-V; Pricing (Pharma Marketing Management).pptxVishalSingh1417
 
Sociology 101 Demonstration of Learning Exhibit
Sociology 101 Demonstration of Learning ExhibitSociology 101 Demonstration of Learning Exhibit
Sociology 101 Demonstration of Learning Exhibitjbellavia9
 
1029 - Danh muc Sach Giao Khoa 10 . pdf
1029 -  Danh muc Sach Giao Khoa 10 . pdf1029 -  Danh muc Sach Giao Khoa 10 . pdf
1029 - Danh muc Sach Giao Khoa 10 . pdfQucHHunhnh
 
Measures of Central Tendency: Mean, Median and Mode
Measures of Central Tendency: Mean, Median and ModeMeasures of Central Tendency: Mean, Median and Mode
Measures of Central Tendency: Mean, Median and ModeThiyagu K
 
Nutritional Needs Presentation - HLTH 104
Nutritional Needs Presentation - HLTH 104Nutritional Needs Presentation - HLTH 104
Nutritional Needs Presentation - HLTH 104misteraugie
 
Grant Readiness 101 TechSoup and Remy Consulting
Grant Readiness 101 TechSoup and Remy ConsultingGrant Readiness 101 TechSoup and Remy Consulting
Grant Readiness 101 TechSoup and Remy ConsultingTechSoup
 
Role Of Transgenic Animal In Target Validation-1.pptx
Role Of Transgenic Animal In Target Validation-1.pptxRole Of Transgenic Animal In Target Validation-1.pptx
Role Of Transgenic Animal In Target Validation-1.pptxNikitaBankoti2
 
Food Chain and Food Web (Ecosystem) EVS, B. Pharmacy 1st Year, Sem-II
Food Chain and Food Web (Ecosystem) EVS, B. Pharmacy 1st Year, Sem-IIFood Chain and Food Web (Ecosystem) EVS, B. Pharmacy 1st Year, Sem-II
Food Chain and Food Web (Ecosystem) EVS, B. Pharmacy 1st Year, Sem-IIShubhangi Sonawane
 
Class 11th Physics NEET formula sheet pdf
Class 11th Physics NEET formula sheet pdfClass 11th Physics NEET formula sheet pdf
Class 11th Physics NEET formula sheet pdfAyushMahapatra5
 
Web & Social Media Analytics Previous Year Question Paper.pdf
Web & Social Media Analytics Previous Year Question Paper.pdfWeb & Social Media Analytics Previous Year Question Paper.pdf
Web & Social Media Analytics Previous Year Question Paper.pdfJayanti Pande
 
The basics of sentences session 2pptx copy.pptx
The basics of sentences session 2pptx copy.pptxThe basics of sentences session 2pptx copy.pptx
The basics of sentences session 2pptx copy.pptxheathfieldcps1
 

Dernier (20)

Making and Justifying Mathematical Decisions.pdf
Making and Justifying Mathematical Decisions.pdfMaking and Justifying Mathematical Decisions.pdf
Making and Justifying Mathematical Decisions.pdf
 
Python Notes for mca i year students osmania university.docx
Python Notes for mca i year students osmania university.docxPython Notes for mca i year students osmania university.docx
Python Notes for mca i year students osmania university.docx
 
Holdier Curriculum Vitae (April 2024).pdf
Holdier Curriculum Vitae (April 2024).pdfHoldier Curriculum Vitae (April 2024).pdf
Holdier Curriculum Vitae (April 2024).pdf
 
How to Give a Domain for a Field in Odoo 17
How to Give a Domain for a Field in Odoo 17How to Give a Domain for a Field in Odoo 17
How to Give a Domain for a Field in Odoo 17
 
TỔNG ÔN TẬP THI VÀO LỚP 10 MÔN TIẾNG ANH NĂM HỌC 2023 - 2024 CÓ ĐÁP ÁN (NGỮ Â...
TỔNG ÔN TẬP THI VÀO LỚP 10 MÔN TIẾNG ANH NĂM HỌC 2023 - 2024 CÓ ĐÁP ÁN (NGỮ Â...TỔNG ÔN TẬP THI VÀO LỚP 10 MÔN TIẾNG ANH NĂM HỌC 2023 - 2024 CÓ ĐÁP ÁN (NGỮ Â...
TỔNG ÔN TẬP THI VÀO LỚP 10 MÔN TIẾNG ANH NĂM HỌC 2023 - 2024 CÓ ĐÁP ÁN (NGỮ Â...
 
Energy Resources. ( B. Pharmacy, 1st Year, Sem-II) Natural Resources
Energy Resources. ( B. Pharmacy, 1st Year, Sem-II) Natural ResourcesEnergy Resources. ( B. Pharmacy, 1st Year, Sem-II) Natural Resources
Energy Resources. ( B. Pharmacy, 1st Year, Sem-II) Natural Resources
 
Beyond the EU: DORA and NIS 2 Directive's Global Impact
Beyond the EU: DORA and NIS 2 Directive's Global ImpactBeyond the EU: DORA and NIS 2 Directive's Global Impact
Beyond the EU: DORA and NIS 2 Directive's Global Impact
 
Unit-V; Pricing (Pharma Marketing Management).pptx
Unit-V; Pricing (Pharma Marketing Management).pptxUnit-V; Pricing (Pharma Marketing Management).pptx
Unit-V; Pricing (Pharma Marketing Management).pptx
 
Sociology 101 Demonstration of Learning Exhibit
Sociology 101 Demonstration of Learning ExhibitSociology 101 Demonstration of Learning Exhibit
Sociology 101 Demonstration of Learning Exhibit
 
INDIA QUIZ 2024 RLAC DELHI UNIVERSITY.pptx
INDIA QUIZ 2024 RLAC DELHI UNIVERSITY.pptxINDIA QUIZ 2024 RLAC DELHI UNIVERSITY.pptx
INDIA QUIZ 2024 RLAC DELHI UNIVERSITY.pptx
 
1029 - Danh muc Sach Giao Khoa 10 . pdf
1029 -  Danh muc Sach Giao Khoa 10 . pdf1029 -  Danh muc Sach Giao Khoa 10 . pdf
1029 - Danh muc Sach Giao Khoa 10 . pdf
 
Measures of Central Tendency: Mean, Median and Mode
Measures of Central Tendency: Mean, Median and ModeMeasures of Central Tendency: Mean, Median and Mode
Measures of Central Tendency: Mean, Median and Mode
 
Nutritional Needs Presentation - HLTH 104
Nutritional Needs Presentation - HLTH 104Nutritional Needs Presentation - HLTH 104
Nutritional Needs Presentation - HLTH 104
 
Grant Readiness 101 TechSoup and Remy Consulting
Grant Readiness 101 TechSoup and Remy ConsultingGrant Readiness 101 TechSoup and Remy Consulting
Grant Readiness 101 TechSoup and Remy Consulting
 
Role Of Transgenic Animal In Target Validation-1.pptx
Role Of Transgenic Animal In Target Validation-1.pptxRole Of Transgenic Animal In Target Validation-1.pptx
Role Of Transgenic Animal In Target Validation-1.pptx
 
Food Chain and Food Web (Ecosystem) EVS, B. Pharmacy 1st Year, Sem-II
Food Chain and Food Web (Ecosystem) EVS, B. Pharmacy 1st Year, Sem-IIFood Chain and Food Web (Ecosystem) EVS, B. Pharmacy 1st Year, Sem-II
Food Chain and Food Web (Ecosystem) EVS, B. Pharmacy 1st Year, Sem-II
 
Class 11th Physics NEET formula sheet pdf
Class 11th Physics NEET formula sheet pdfClass 11th Physics NEET formula sheet pdf
Class 11th Physics NEET formula sheet pdf
 
Web & Social Media Analytics Previous Year Question Paper.pdf
Web & Social Media Analytics Previous Year Question Paper.pdfWeb & Social Media Analytics Previous Year Question Paper.pdf
Web & Social Media Analytics Previous Year Question Paper.pdf
 
The basics of sentences session 2pptx copy.pptx
The basics of sentences session 2pptx copy.pptxThe basics of sentences session 2pptx copy.pptx
The basics of sentences session 2pptx copy.pptx
 
Asian American Pacific Islander Month DDSD 2024.pptx
Asian American Pacific Islander Month DDSD 2024.pptxAsian American Pacific Islander Month DDSD 2024.pptx
Asian American Pacific Islander Month DDSD 2024.pptx
 

Final Viper Prototype Presentation

  • 1. VISUALISING ERRORS IN ANIMAL PEDIGREE GENOTYPE DATA Martin Graham, Jessie Kennedy, Trevor Paterson & Andy Law Edinburgh Napier University & The Roslin Institute, Univ of Edinburgh, UK
  • 2. 2 years ago at Firbush...  I said:  “Aim is to develop interactive tools to locate and isolate errors in pedigree genotype data in their datasets”  Where a  Pedigree= Family tree of related animals  Genotype = Genetic makeup of an organism
  • 3. Inheritance Basics (Very)  Humans have DNA  They in fact have 2 lots of DNA (diploidy), which may or may not match at certain points   Two lots of DNA bundled in a chromosome  When two parents produce offspring, one lot of DNA is passed onto the child from each parent  Which lot is used changes just to shuffle things up a bit more
  • 4. Inheritance Basics (Very)  By looking at many, many Single Nucleotide Polymorphisms markers (points where we know things vary between individuals at the level of single DNA letters) we can check for errors A G A C A C  If one letter from each parent at these points turns up in the same place in the child’s DNA everything is good
  • 5. Errorz  But inevitably.... Nothing inherited from mum  Errorscreep in for various reasons, bad record- A G C C C C keeping, observations... Nothing inherited from dad A G C A G G Novel allele. No inheritance from one parent, but we  Muddled DNA can’t tell which... sampling, animals “jumping A G C A T A the fence” etc etc  Unusable data in this state
  • 6. Thus  There is a constant need to clean up pedigree data  Roslin have a tool that views data as a table (markers by individuals), so pedigree-based patterns to error, such as the wrong dad for an entire set of offspring, were very hard to spot  So they wanted a new tool, with a funky
  • 7. Layouts  So (2 years ago) we looked at pedigree layouts  And they were all rubbish
  • 8. Layouts  Didn’t scale, became intractable to follow relationships, couldn’t resolve generations, often only individual-out views rather than whole pedigree etc
  • 9. Layouts  So we developed what we called the sandwich view. Between neighbouring generations, we draw  Dads as the top slice of bread  Mums as the bottom slice of bread  Kids as the filling  Errors colour-coded across the marker set, more
  • 10. Layouts  Each family forms a block between the respective mum and dad, making it easy to see who is who’s offspring/parents  Layout works as males mate with multiple females in each generation but the opposite is rare
  • 11. Layouts  Each child forms a glyph used to show error  Divided into three parts  Up triangle coloured if error with dad  Down triangle coloured if error with mum  Middle band coloured if error, but parent in error is unknown (novel allele)  Lo, pedigree-based error patterns revealed themselves
  • 12. Layouts  Tables full of data and histograms to show error distribution by marker and individuals also help
  • 13. Cleaning  So, we can show errors nicely  But the aim is to get rid of all these errors  Masking is when we pretend we don’t know the values for particular markers / individuals / combinations thereof  What happens then is that those values are inferred from the corresponding values in the parents A G G C A G C C C C ? ? C C C C
  • 14. Cleaning  The visualisations lets the biologist mask individuals / bunches of markers / individual genotype points / relationships  These are then shown in blue in the interface
  • 15. Cleaning  This last point’s important as pedigree errors just propagate down the pedigree. A wrong parent for a child can’t be cured by hiding the child  It’s also why we cant clean these data sets automatically, the biologists judgement in what
  • 16. The Goal  Eventually we want a display with no nasty red colours and then we can save it as a “clean” data set  Though obviously with lots of missing data  But the biologists say their tools can handle missing things, but wrong things blow them up  And we did have to stick in a final “auto clean up” button to fix sporadic errors that would have taken ages to fix manually  But the major systematic errors are fixed by the biologist
  • 17. User Test  We did a user test with 11 biologists at Roslin  They preferred the new tool to the table-like tool  Probably the most interesting thing past the numbers was once again how much a bunch of scientists are in thrall to Excel  Just like the taxonomists we’ve worked with / social scientists we’re writing a proposal with  Which is why the Roslin guys made a table-a-like tool in the first place to try and appease them
  • 18. Conclusion  Built successful tool (got it published in EuroVis, BioVis and AVI)  Whether it’s successful from the biologists point of view...  During the project, marker set sizes jumped from thousands to hundreds of thousands  Sequencing the data used to be the costly part of the process, staff time to clean it up was relatively cheap  Biology in general is having a data crisis, some opinions say its cheaper/easier to redo experiments than store the TBs of information
  • 19. Conclusion  Available at www.viper-project.org  Did do JavaDocs this time  I enjoyed it