
Recommandé
Recommandé
Contenu connexe
Similaire à Re-architecting visualisations in Java Swing
Similaire à Re-architecting visualisations in Java Swing (20)
Dernier
Dernier (20)
Re-architecting visualisations in Java Swing
- 1. R E - ARCHITECTING V ISUALIZATIONS TO J AVA S WING
- 2. H ISTORY Napier has been developing visualisations for 15 years Perspective Tunnel OO Database Vis (1994) (1997) Rapley & Kennedy Mitchell & Kennedy
- 3. H ISTORY Multiple Tree Graph Matrix Vis (2004) (2000) Parallel Coordinates Multiple Tree DAG (2003) (2007)
- 4. S PECIFIC TOOLS But each visualisation in turn has been built specifically for a given context (databases, taxonomy, microarray data) Reusability hasn’t been one of the criteria our projects have been concerned with – build a demo to show the principles for the problem at hand and leave it at that Which makes it hard when other data comes along… Those are variable depth phylogenetic trees mate, you ain’t getting in.
- 5. DRIVER We wanted to reuse our work to compete for small projects that last perhaps weeks or months That sort of timescale doesn’t leave much scope for development from scratch A set of general components could be specialised more easily than trying to fit some specialised visualisation into a differently-shaped hole
- 6. U SE A VIS TOOLKIT ? Plenty of visualisation toolkits to use out there User level suites allow given types of data sets to be visualised Programmer level toolkits allow visualisations to form part of larger applications The user level toolkits tend to be stand- alone, more difficult to integrate with other programs The programmer level toolkits tend to have their own new models and syntaxes to learn
- 7. S WING Most of our visualisations were built in Java Swing but with custom models, components and UIs Swing itself is a concrete architecture; a fully- coded implementation of an MVC-patterned GUI Re-architect our visualisations for Swing – not just built in Swing but composed on top of Swing’s existing classes for modelling/viewing Table and Tree data Our visualisations can be re-built in a reusable and general form by extending the existing Swing UI and Model classes and building necessary new classes in the Swing style
- 8. C ASE S TUDY: PARALLEL C OORDINATES A Parallel Coordinate display is essentially a table where data in each column is ordered independently, so ‘rows’ zig-zag across rather than read horizontally By coupling a new UI class with an extended JTable class (plus a couple of additional sorting classes) we have a Parallel Coordinates Model Interface Controller View (+Controller) implementation. TableMod JTable TableUI el Extended by JParCoor ParCoord d UI
- 9. C ASE S TUDY: PARALLEL C OORDINATES LOC: 3,645 2,664 Reusability: Custom App Model Generic Model
- 10. C ASE S TUDY: PARALLEL C OORDINATES By extending the Parallel Coordinate classes, we can also build a Scatter-plot Matrix
- 11. C ASE S TUDY: PARALLEL C OORDINATES Easy to adapt Swing-based GUIs to use our components: replace instantiations of JTable(…)with JParCoord(…) Re: Bederson’s FishEye drop-in replacement for JList (2000) We now have access to default JTable functionality such as Row filtering, Column drag’n’drop interaction, direct value editing etc, which we haven’t had to implement ourselves Two or more JTables or JParCoords can share the same TableModel A standard JTable in synch with a parallel coordinate plot provides a convenient way to edit data ! Selection models had to be processed differently as
- 12. C ASE S TUDY: PARALLEL C OORDINATES …extends JParCoord and uses a JScatterPlot as a cell renderer in it’s associated UI class Model Interface Controller View (+Controller) TableMode l JTable TableUI JParCoor ParCoord d UI Extended JScatte by rPlot JScatterPl ScatterPlot otMatrix Matrix UI
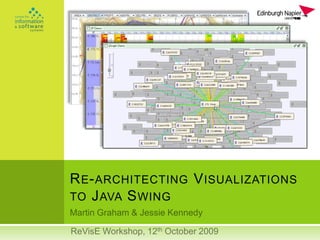
- 13. C ASE S TUDY: G RAPHS /N ETWORKS Re-architecture of previous visualisations of social network and taxonomy data
- 14. C ASE S TUDY: G RAPHS /N ETWORKS Swing doesn’t have classes that handle general graph data… So here we have to build our own graph model But Swing provides conventions, an architecture, of Models, Views & Listeners etc that can be followed For the views, we have two existing views that show graph data A node-link graph A matrix
- 15. C ASE S TUDY: G RAPHS /N ETWORKS For the node-link view we built a JGraph class, some associated classes, and a GraphUI class Fair amount of work
- 16. C ASE S TUDY: G RAPHS /N ETWORKS For the matrix though… what’s a graph matrix? It’s a table, with nodes along axes, edges in the middle We build a TableModel instance that sits as a wrapper around a GraphModel instance Plug this into a JTable and we have a JMatrix (extended with extras we’ve put in such as row headers & sorting)
- 17. C ASE S TUDY: G RAPHS /N ETWORKS The graph and table models for the matrix are context-free, they just hold objects and associated renderers decide how to display them
- 18. C ASE S TUDY: G RAPHS /N ETWORKS Graph and matrix views can thus share models + Shared selection models for highlighting / filtering etc View (+C) Controller Model Controller View (+C) GraphUI JGraph GraphModel Wrapped by instance of TableMod JTable TableUI el JMatrix MatrixUI
- 19. I N PROGRESS : M ULTIPLE T REES Re-architecting Multiple Trees to work on top of multiple JTree components
- 20. A DVANTAGES OF R E - ARCH Java Swing’s model framework is very flexible Table, Tree and ListModels as interfaces with any implementation you like underneath that fits Pluggable Selection models Pluggable sets of Renderers that display whatever objects you choose Access to functionality built in to standard Swing tree and table widgets The default Swing widgets include editing functionality, visualisation components are usually poor at editing data
- 21. ! A DVANTAGES OF R E - ARCH Swing’s UI classes are pretty monolithic and inextensible Mix of private / protected methods that would have been useful to extend, copy/pasting done at some point. They often reference helper classes with restricted access Default selection models are limited, mostly yes/no Have to understand the Swing classes clearly to incorporate new visualisation effects i.e. programmatically expanding a column header
- 22. C URRENTLY Talks with a couple of firms/existing projects about visualising their data with the Parallel Coordinate component Integrated Parallel Coordinates into an existing Java-based estate agency prototype Developed the Scatterplot matrix component with a health informatics firm in prep for a project bid
- 23. C ONCLUSION From our viewpoint, developing this suite of visualisations components that are pluggable directly into Java Swing eases a lot of development headaches We can adapt existing Java Swing GUIs with our components, for the most part it’s one or two lines of code substitution or an init() method We can quickly adapt the components themselves for given contexts/data domains This kind of piggybacking on a commonly-used GUI technology makes it more likely people will incorporate visualisations – and then more people will use them
- 24. E ND Thanks Questions / Insults?
Notes de l'éditeur
- Hello. I’m me.
- Built a lot of tools, all for specific needsClick to get bouncer
- Re-using such highly tailored work is difficult, often the semantics of the domain are entangled in the code (yeah, my bad)
- I differentiate on documentation.If most of the documentation is in the source code (i.e. javadocs) then I deem it to be a programmer-level toolkit.If most of the documentation is somewhere else and related to getting data on-screen then I say it’s user-level.
- We had arguments over what models/architectures we should base this toolkit on, in the end I picked Swing as I’m already familiar with it and it already demonstrates it can handle complex GUIs. Not saying this is new, but it seemed the quickest, most flexible, most $$$£££€€€-wise way of doing things
- Parallel coordinate data is table/tuple data, one tablecolumn per dimensionAdditional sorting classes – individual sort order perTableColumn
- Knocked down the lines of code by between a third and a quarterAnd the Parallel Coordinates now accepts anything you can stuff in a Java TableModel and has the same interactions for dragging/resizing columns etc. Even knocked in a progressive rendering ability for large data sets
- Not a big leap from parallel coordinates to a scatterplot matrixThe parallel coordinates has a sort order per column, which the scatterplot drawing utilisesInstead of individual row/column data points, the ‘table’ shows column-column pairwise comparison for the entire data setThis example has 3,750
- Easy way to adapt standard Swing GUIsFunctionality from standard swing widgets availableSwing’s MVC model makes sharing models between views easy
- Builds on functionality we’ve got for parallel coordinates
- Here’s some old versions we knocked up
- Here we hit a wall, swing doesn’t have concrete implementations of these kinds of data, but the examples it does have are enough to supply an architecture to build to.
- No getting round this, it was a fair bit of work, but at least Swing supplied conventions and concrete examples from other objects for us to use
- A matrix is a table view of graph data, easy enough to build a tablemodel instance that wraps a graphmodel instance, and we can view table-style
- Demo of graph matrix built on top of Jtable, showing a) image renderer and b) multi-edge renderer
- Graph Model works with Jgraph and GraphUI for the node-linkWe instantiate a class of TableModel that wraps round graphModel
- Multiple trees each with it’s own tree model that can hold similar objectsRequires a new selection model that works on objects rather than view-based selection indexing
- Our components are a lot more reusable now, if you can fit the data in one of the models we can view itUsed in combo with the default Swing widgets, we can edit with the standard view and observe with the more abstract views
- We’ve done a few minor projects, month timescales etc
- If we can do it quickly, it costs less, people are more likely to pay us – specially if its to integrate with existing projects / technologyVisualisation still hasn’t penetrated mainstream – mostly because it requires developers to use new UI frameworks / models – piggybacking on a popular GUI implementation / architecture like Swing makes take-up more likely in our opinion
- Q’s?