SlideShare une entreprise Scribd logo
1  sur  25
Chapter 7 MEASURE
At the beginning, a startup is little more than a model on a
piece of paper. The financials in the business plan include
projections of how many customers the company expects to
attract, how much it will spend, and how much revenue and
profit that will lead to. It’s an ideal that’s usually far from
where the startup is in its early days. A startup’s job is to (1)
rigorously measure where it is right now, confronting the hard
truths that assessment reveals, and then (2) devise experiments
to learn how to move the real numbers closer to the ideal
reflected in the business plan. Most products—even the ones
that fail—do not have zero traction. Most products have some
customers, some growth, and some positive results. One of the
most dangerous outcomes for a startup is to bumble along in the
land of the living dead. Employees and entrepreneurs tend to be
optimistic by nature. We want to keep believing in our ideas
even when the writing is on the wall. This is why the myth of
perseverance is so dangerous. We all know stories of epic
entrepreneurs who managed to pull out a victory when things
seemed incredibly bleak. Unfortunately, we don’t hear stories
about the countless nameless others who persevered too long,
leading their companies to failure.
WHY SOMETHING AS SEEMINGLY DULL AS
ACCOUNTING WILL CHANGE YOUR LIFE People are
accustomed to thinking of accounting as dry and boring, a
necessary evil used primarily to prepare financial reports and
survive audits, but that is because accounting is something that
has become taken for granted. Historically, under the leadership
of people such as Alfred Sloan at General Motors, accounting
became an essential part of the method of exerting centralized
control over far-flung divisions. Accounting allowed GM to set
clear milestones for each of its divisions and then hold each
manager accountable for his or her division’s success in
reaching those goals. All modern corporations use some
variation of that approach. Accounting is the key to their
success. Unfortunately, standard accounting is not helpful in
evaluating entrepreneurs. Startups are too unpredictable for
forecasts and milestones to be accurate. I recently met with a
phenomenal startup team. They are well financed, have
significant customer traction, and are growing rapidly. Their
product is a leader in an emerging category of enterprise
software that uses consumer marketing techniques to sell into
large companies. For example, they rely on employee-to-
employee viral adoption rather than a traditional sales process,
which might target the chief information officer or the head of
information technology (IT). As a result, they have the
opportunity to use cutting-edge experimental techniques as they
constantly revise their product. During the meeting, I asked the
team a simple question that I make a habit of asking startups
whenever we meet: are you making your product better? They
always say yes. Then I ask: how do you know? I invariably get
this answer: well, we are in engineering and we made a number
of changes last month, and our customers seem to like them, and
our overall numbers are higher this month. We must be on the
right track. This is the kind of storytelling that takes place at
most startup board meetings. Most milestones are built the same
way: hit a certain product milestone, maybe talk to a few
customers, and see if the numbers go up. Unfortunately, this is
not a good indicator of whether a startup is making progress.
How do we know that the changes we’ve made are related to the
results we’re seeing? More important, how do we know that we
are drawing the right lessons from those changes? To answer
these kinds of questions, startups have a strong need for a new
kind of accounting geared specifically to disruptive innovation.
That’s what innovation accounting is.
An Accountability Framework That Works Across Industries
Innovation accounting enables startups to prove objectively that
they are learning how to grow a sustainable business.
Innovation accounting begins by turning the leap-of-faith
assumptions discussed in Chapter 5 into a quantitative financial
model. Every business plan has some kind of model associated
with it, even if it’s written on the back of a napkin. That model
provides assumptions about what the business will look like at a
successful point in the future. For example, the business plan
for an established manufacturing company would show it
growing in proportion to its sales volume. As the profits from
the sales of goods are reinvested in marketing and promotions,
the company gains new customers. The rate of growth depends
primarily on three things: the profitability of each customer, the
cost of acquiring new customers, and the repeat purchase rate of
existing customers. The higher these values are, the faster the
company will grow and the more profitable it will be. These are
the drivers of the company’s growth model. By contrast, a
marketplace company that matches buyers and sellers such as
eBay will have a different growth model. Its success depends
primarily on the network effects that make it the premier
destination for both buyers and sellers to transact business.
Sellers want the marketplace with the highest number of
potential customers. Buyers want the marketplace with the most
competition among sellers, which leads to the greatest
availability of products and the lowest prices. (In economics,
this sometimes is called supply-side increasing returns and
demand-side increasing returns.) For this kind of startup, the
important thing to measure is that the network effects are
working, as evidenced by the high retention rate of new buyers
and sellers. If people stick with the product with very little
attrition, the marketplace will grow no matter how the company
acquires new customers. The growth curve will look like a
compounding interest table, with the rate of growth depending
on the “interest rate” of new customers coming to the product.
Though these two businesses have very different drivers of
growth, we can still use a common framework to hold their
leaders accountable. This framework supports accountability
even when the model changes.
HOW INNOVATION ACCOUNTING WORKS—THREE
LEARNING MILESTONES Innovation accounting works in
three steps:
first, use a minimum viable product to establish real data on
where the company is right now. Without a clear-eyed picture of
your current status—no matter how far from the goal you may
be—you cannot begin to track your progress.
Second, startups must attempt to tune the engine from the
baseline toward the ideal. This may take many attempts. After
the startup has made all the micro changes and product
optimizations it can to move its baseline toward the ideal, the
company reaches a decision point. That is the third step: pivot
or persevere. If the company is making good progress toward
the ideal, that means it’s learning appropriately and using that
learning effectively, in which case it makes sense to continue. If
not, the management team eventually must conclude that its
current product strategy is flawed and needs a serious change.
When a company pivots, it starts the process all over again,
reestablishing a new baseline and then tuning the engine from
there. The sign of a successful pivot is that these engine-tuning
activities are more productive after the pivot than before.
Establish the Baseline For example, a startup might create a
complete prototype of its product and offer to sell it to real
customers through its main marketing channel. This single MVP
would test most of the startup’s assumptions and establish
baseline metrics for each assumption simultaneously.
Alternatively, a startup might prefer to build separate MVPs
that are aimed at getting feedback on one assumption at a time.
Before building the prototype, the company might perform a
smoke test with its marketing materials. This is an old direct
marketing technique in which customers are given the
opportunity to preorder a product that has not yet been built. A
smoke test measures only one thing: whether customers are
interested in trying a product. By itself, this is insufficient to
validate an entire growth model. Nonetheless, it can be very
useful to get feedback on this assumption before committing
more money and other resources to the product. These MVPs
provide the first example of a learning milestone. An MVP
allows a startup to fill in real baseline data in its growth
model—conversion rates, sign-up and trial rates, customer
lifetime value, and so on—and this is valuable as the foundation
for learning about customers and their reactions to a product
even if that foundation begins with extremely bad news. When
one is choosing among the many assumptions in a business plan,
it makes sense to test the riskiest assumptions first. If you can’t
find a way to mitigate these risks toward the ideal that is
required for a sustainable business, there is no point in testing
the others. For example, a media business that is selling
advertising has two basic assumptions that take the form of
questions: Can it capture the attention of a defined customer
segment on an ongoing basis? and can it sell that attention to
advertisers? In a business in which the advertising rates for a
particular customer segment are well known, the far riskier
assumption is the ability to capture attention. Therefore, the
first experiments should involve content production rather than
advertising sales. Perhaps the company will produce a pilot
episode or issue to see how customers engage.
Tuning the Engine Once the baseline has been established, the
startup can work toward the second learning milestone: tuning
the engine. Every product development, marketing, or other
initiative that a startup undertakes should be targeted at
improving one of the drivers of its growth model. For example,
a company might spend time improving the design of its product
to make it easier for new customers to use. This presupposes
that the activation rate of new customers is a driver of growth
and that its baseline is lower than the company would like. To
demonstrate validated learning, the design changes must
improve the activation rate of new customers. If they do not, the
new design should be judged a failure. This is an important
rule: a good design is one that changes customer behavior for
the better. Compare two startups. The first company sets out
with a clear baseline metric, a hypothesis about what will
improve that metric, and a set of experiments designed to test
that hypothesis. The second team sits around debating what
would improve the product, implements several of those
changes at once, and celebrates if there is any positive increase
in any of the numbers. Which startup is more likely to be doing
effective work and achieving lasting results?
Pivot or Persevere Over time, a team that is learning its way
toward a sustainable business will see the numbers in its model
rise from the horrible baseline established by the MVP and
converge to something like the ideal one established in the
business plan. A startup that fails to do so will see that ideal
recede ever farther into the distance. When this is done right,
even the most powerful reality distortion field won’t be able to
cover up this simple fact: if we’re not moving the drivers of our
business model, we’re not making progress. That becomes a
sure sign that it’s time to pivot.
INNOVATION ACCOUNTING AT IMVU Here’s what
innovation accounting looked like for us in the early days of
IMVU. Our minimum viable product had many defects and,
when we first released it, extremely low sales. We naturally
assumed that the lack of sales was related to the low quality of
the product, so week after week we worked on improving the
quality of the product, trusting that our efforts were worthwhile.
At the end of each month, we would have a board meeting at
which we would present the results. The night before the board
meeting, we’d run our standard analytics, measuring conversion
rates, customer counts, and revenue to show what a good job we
had done. For several meetings in a row, this caused a last-
minute panic because the quality improvements were not
yielding any change in customer behavior. This led to some
frustrating board meetings at which we could show great
product “progress” but not much in the way of business results.
After a while, rather than leave it to the last minute, we began
to track our metrics more frequently, tightening the feedback
loop with product development. This was even more depressing.
Week in, week out, our product changes were having no effect.
Improving a Product on Five Dollars a Day We tracked the
“funnel metrics” behaviors that were critical to our engine of
growth: customer registration, the download of our application,
trial, repeat usage, and purchase. To have enough data to learn,
we needed just enough customers using our product to get real
numbers for each behavior. We allocated a budget of five
dollars per day: enough to buy clicks on the then-new Google
AdWords system. In those days, the minimum you could bid for
a click was 5 cents, but there was no overall minimum to your
spending. Thus, we could afford to open an account and get
started even though we had very little money.1 Five dollars
bought us a hundred clicks—every day. From a marketing point
of view this was not very significant, but for learning it was
priceless. Every single day we were able to measure our
product’s performance with a brand new set of customers. Also,
each time we revised the product, we got a brand new report
card on how we were doing the very next day. For example, one
day we would debut a new marketing message aimed at first-
time customers. The next day we might change the way new
customers were initiated into the product. Other days, we would
add new features, fix bugs, roll out a new visual design, or try a
new layout for our website. Every time, we told ourselves we
were making the product better, but that subjective confidence
was put to the acid test of real numbers. Day in and day out we
were performing random trials. Each day was a new experiment.
Each day’s customers were independent of those of the day
before. Most important, even though our gross numbers were
growing, it became clear that our funnel metrics were not
changing. Here is a graph from one of IMVU’s early board
meetings:
This graph represents approximately seven months of work.
Over that period, we were making constant improvements to the
IMVU product, releasing new features on a daily basis. We were
conducting a lot of in-person customer interviews, and our
product development team was working extremely hard.
Cohort Analysis To read the graph, you need to understand
something called cohort analysis. This is one of the most
important tools of startup analytics. Although it sounds
complex, it is based on a simple premise. Instead of looking at
cumulative totals or gross numbers such as total revenue and
total number of customers, one looks at the performance of each
group of customers that comes into contact with the product
independently. Each group is called a cohort. The graph shows
the conversion rates to IMVU of new customers who joined in
each indicated month. Each conversion rate shows the
percentage of customer who registered in that month who
subsequently went on to take the indicated action. Thus, among
all the customers who joined IMVU in February 2005, about 60
percent of them logged in to our product at least one time.
Managers with an enterprise sales background will recognize
this funnel analysis as the traditional sales funnel that is used to
manage prospects on their way to becoming customers. Lean
Startups use it in product development, too. This technique is
useful in many types of business, because every company
depends for its survival on sequences of customer behavior
called flows. Customer flows govern the interaction of
customers with a company’s products. They allow us to
understand a business quantitatively and have much more
predictive power than do traditional gross metrics. If you look
closely, you’ll see that the graph shows some clear trends. Some
product improvements are helping—a little. The percentage of
new customers who go on to use the product at least five times
has grown from less than 5 percent to almost 20 percent. Yet
despite this fourfold increase, the percentage of new customers
who pay money for IMVU is stuck at around 1 percent. Think
about that for a moment. After months and months of work,
thousands of individual improvements, focus groups, design
sessions, and usability tests, the percentage of new customers
who subsequently pay money is exactly the same as it was at the
onset even though many more customers are getting a chance to
try the product. Thanks to the power of cohort analysis, we
could not blame this failure on the legacy of previous customers
who were resistant to change, external market conditions, or any
other excuse. Each cohort represented an independent report
card, and try as we might, we were getting straight C’s. This
helped us realize we had a problem. I was in charge of the
product development team, small though it was in those days,
and shared with my cofounders the sense that the problem had
to be with my team’s efforts. I worked harder, tried to focus on
higher- and higher-quality features, and lost a lot of sleep. Our
frustration grew. When I could think of nothing else to do, I
was finally ready to turn to the last resort: talking to customers.
Armed with our failure to make progress tuning our engine of
growth, I was ready to ask the right questions. Before this
failure, in the company’s earliest days, it was easy to talk to
potential customers and come away convinced we were on the
right track. In fact, when we would invite customers into the
office for in-person interviews and usability tests, it was easy to
dismiss negative feedback. If they didn’t want to use the
product, I assumed they were not in our target market. “Fire that
customer,” I’d say to the person responsible for recruiting for
our tests. “Find me someone in our target demographic.”
If the next customer was more positive, I would take it as
confirmation that I was right in my targeting. If not, I’d fire
another customer and try again. By contrast, once I had data in
hand, my interactions with customers changed. Suddenly I had
urgent questions that needed answering: Why aren’t customers
responding to our product “improvements”? Why isn’t our hard
work paying off? For example, we kept making it easier and
easier for customers to use IMVU with their existing friends.
Unfortunately, customers didn’t want to engage in that
behavior. Making it easier to use was totally beside the point.
Once we knew what to look for, genuine understanding came
much faster. As was described in Chapter 3, this eventually led
to a critically important pivot: away from an IM add-on used
with existing friends and toward a stand-alone network one can
use to make new friends. Suddenly, our worries about
productivity vanished. Once our efforts were aligned with what
customers really wanted, our experiments were much more
likely to change their behavior for the better. This pattern would
repeat time and again, from the days when we were making less
than a thousand dollars in revenue per month all the way up to
the time we were making millions. In fact, this is the sign of a
successful pivot: the new experiments you run are overall more
productive than the experiments you were running before. This
is the pattern: poor quantitative results force us to declare
failure and create the motivation, context, and space for more
qualitative research. These investigations produce new ideas—
new hypotheses—to be tested, leading to a possible pivot. Each
pivot unlocks new opportunities for further experimentation,
and the cycle repeats. Each time we repeat this simple rhythm:
establish the baseline, tune the engine, and make a decision to
pivot or persevere.
OPTIMIZATION VERSUS LEARNING Engineers, designers,
and marketers are all skilled at optimization. For example,
direct marketers are experienced at split testing value
propositions by sending a different offer to two similar groups
of customers so that they can measure differences in the
response rates of the two groups. Engineers, of course, are
skilled at improving a product’s performance, just as designers
are talented at making products easier to use. All these
activities in a well-run traditional organization offer
incremental benefit for incremental effort. As long as we are
executing the plan well, hard work yields results. However,
these tools for product improvement do not work the same way
for startups.
If you are building the wrong thing, optimizing the product or
its marketing will not yield significant results. A startup has to
measure progress against a high bar: evidence that a sustainable
business can be built around its products or services. That’s a
standard that can be assessed only if a startup has made clear,
tangible predictions ahead of time. In the absence of those
predictions, product and strategy decisions are far more difficult
and time-consuming. I often see this in my consulting practice.
I’ve been called in many times to help a startup that feels that
its engineering team “isn’t working hard enough.” When I meet
with those teams, there are always improvements to be made
and I recommend them, but invariably the real problem is not a
lack of development talent, energy, or effort. Cycle after cycle,
the team is working hard, but the business is not seeing results.
Managers trained in a traditional model draw the logical
conclusion: our team is not working hard, not working
effectively, or not working efficiently. Thus the downward
cycle begins: the product development team valiantly tries to
build a product according to the specifications it is receiving
from the creative or business leadership. When good results are
not forthcoming, business leaders assume that any discrepancy
between what was planned and what was built is the cause and
try to specify the next iteration in greater detail. As the
specifications get more detailed, the planning process slows
down, batch size increases, and feedback is delayed. If a board
of directors or CFO is involved as a stakeholder, it doesn’t take
long for personnel changes to follow. A few years ago, a team
that sells products to large media companies invited me to help
them as a consultant because they were concerned that their
engineers were not working hard enough. However, the fault
was not in the engineers; it was in the process the whole
company was using to make decisions. They had customers but
did not know them very well. They were deluged with feature
requests from customers, the internal sales team, and the
business leadership. Every new insight became an emergency
that had to be addressed immediately. As a result, long-term
projects were hampered by constant interruptions. Even worse,
the team had no clear sense of whether any of the changes they
were making mattered to customers. Despite the constant tuning
and tweaking, the business results were consistently mediocre.
Learning milestones prevent this negative spiral by emphasizing
a more likely possibility: the company is executing—with
discipline!—a plan that does not make sense. The innovation
accounting framework makes it clear when the company is stuck
and needs to change direction. In the example above, early in
the company’s life, the product development team was
incredibly productive because the company’s founders had
identified a large unmet need in the target market. The initial
product, while flawed, was popular with early adopters. Adding
the major features that customers asked for seemed to work
wonders, as the early adopters spread the word about the
innovation far and wide. But unasked and unanswered were
other lurking questions: Did the company have a working
engine of growth? Was this early success related to the daily
work of the product development team? In most cases, the
answer was no; success was driven by decisions the team had
made in the past. None of its current initiatives were having any
impact. But this was obscured because the company’s gross
metrics were all “up and to the right.”
As we’ll see in a moment, this is a common danger. Companies
of any size that have a working engine of growth can come to
rely on the wrong kind of metrics to guide their actions. This is
what tempts managers to resort to the usual bag of success
theater tricks: last-minute ad buys, channel stuffing, and whiz-
bang demos, in a desperate attempt to make the gross numbers
look better. Energy invested in success theater is energy that
could have been used to help build a sustainable business. I call
the traditional numbers used to judge startups “vanity metrics,”
and innovation accounting requires us to avoid the temptation to
use them.
VANITY METRICS: A WORD OF CAUTION To see the danger
of vanity metrics clearly, let’s return once more to the early
days of IMVU. Take a look at the following graph, which is
from the same era in IMVU’s history as that shown earlier in
this chapter. It covers the same time period as the cohort-style
graph on this page; in fact, it is from the same board
presentation. This graph shows the traditional gross metrics for
IMVU so far: total registered users and total paying customers
(the gross revenue graph looks almost the same). From this
viewpoint, things look much more exciting. That’s why I call
these vanity metrics: they give the rosiest possible picture.
You’ll see a traditional hockey stick graph (the ideal in a rapid-
growth company). As long as you focus on the top-line numbers
(signing up more customers, an increase in overall revenue),
you’ll be forgiven for thinking this product development team is
making great progress. The company’s growth engine is
working. Each month it is able to acquire customers and has a
positive return on investment. The excess revenue from those
customers is reinvested the next month in acquiring more.
That’s where the growth is coming from.
But think back to the same data presented in a cohort style.
IMVU is adding new customers, but it is not improving the
yield on each new group. The engine is turning, but the efforts
to tune the engine are not bearing much fruit. From the
traditional graph alone, you cannot tell whether IMVU is on
pace to build a sustainable business; you certainly can’t tell
anything about the efficacy of the entrepreneurial team behind
it. Innovation accounting will not work if a startup is being
misled by these kinds of vanity metrics: gross number of
customers and so on. The alternative is the kind of metrics we
use to judge our business and our learning milestones, what I
call actionable metrics.
ACTIONABLE METRICS VERSUS VANITY METRICS To get
a better sense of the importance of good metrics, let’s look at a
company called Grockit. Its founder, Farbood Nivi, spent a
decade working as a teacher at two large for-profit education
companies, Princeton Review and Kaplan, helping students
prepare for standardized tests such as the GMAT, LSAT, and
SAT. His engaging classroom style won accolades from his
students and promotions from his superiors; he was honored
with Princeton Review’s National Teacher of the Year award.
But Farb was frustrated with the traditional teaching methods
used by those companies. Teaching six to nine hours per day to
thousands of students, he had many opportunities to experiment
with new approaches.2 Over time, Farb concluded that the
traditional lecture model of education, with its one-to-many
instructional approach, was inadequate for his students. He set
out to develop a superior approach, using a combination of
teacher-led lectures, individual homework, and group study. In
particular, Farb was fascinated by how effective the student-to-
student peer-driven learning method was for his students. When
students could help each other, they benefited in two ways.
First, they could get customized instruction from a peer who
was much less intimidating than a teacher. Second, they could
reinforce their learning by teaching it to others. Over time,
Farb’s classes became increasingly social—and successful. As
this unfolded, Farb felt more and more that his physical
presence in the classroom was less important. He made an
important connection: “I have this social learning model in my
classroom. There’s all this social stuff going on on the web.”
His idea was to bring social peer-to-peer learning to people who
could not afford an expensive class from Kaplan or Princeton
Review or an even more expensive private tutor. From this
insight Grockit was born. Farb explains, “Whether you’re
studying for the SAT or you’re studying for algebra, you study
in one of three ways. You spend some time with experts, you
spend some time on your own, and you spend some time with
your peers. Grockit offers these three same formats of studying.
What we do is we apply technology and algorithms to optimize
those three forms.” Farb is the classic entrepreneurial visionary.
He recounts his original insight this way: “Let’s forget
educational design up until now, let’s forget what’s possible
and just redesign learning with today’s students and today’s
technology in mind. There were plenty of multi-billion-dollar
organizations in the education space, and I don’t think they
were innovating in the way that we needed them to and I didn’t
think we needed them anymore. To me, it’s really all about the
students and I didn’t feel like the students were being served as
well as they could.” Today Grockit offers many different
educational products, but in the beginning Farb followed a lean
approach. Grockit built a minimum viable product, which was
simply Farb teaching test prep via the popular online web
conferencing tool WebEx. He built no custom software, no new
technology. He simply attempted to bring his new teaching
approach to students via the Internet. News about a new kind of
private tutoring spread quickly, and within a few months Farb
was making a decent living teaching online, with monthly
revenues of $10,000 to $15,000. But like many entrepreneurs
with ambition, Farb didn’t build his MVP just to make a living.
He had a vision of a more collaborative, more effective kind of
teaching for students everywhere. With his initial traction, he
was able to raise money from some of the most prestigious
investors in Silicon Valley. When I first met Farb, his company
was already on the fast track to success. They had raised
venture capital from well-regarded investors, had built an
awesome team, and were fresh off an impressive debut at one of
Silicon Valley’s famous startup competitions.
They were extremely process-oriented and disciplined. Their
product development followed a rigorous version of the agile
development methodology known as Extreme Programming
(described below), thanks to their partnership with a San
Francisco–based company called Pivotal Labs. Their early
product was hailed by the press as a breakthrough. There was
only one problem: they were not seeing sufficient growth in the
use of the product by customers. Grockit is an excellent case
study because its problems were not a matter of failure of
execution or discipline. Following standard agile practice,
Grockit’s work proceeded in a series of sprints, or one-month
iteration cycles. For each sprint, Farb would prioritize the work
to be done that month by writing a series of user stories, a
technique taken from agile development. Instead of writing a
specification for a new feature that described it in technical
terms, Farb would write a story that described the feature from
the point of view of the customer. That story helped keep the
engineers focused on the customer’s perspective throughout the
development process. Each feature was expressed in plain
language in terms everyone could understand whether they had
a technical background or not. Again following standard agile
practice, Farb was free to reprioritize these stories at any time.
As he learned more about what customers wanted, he could
move things around in the product backlog, the queue of stories
yet to be built. The only limit on this ability to change
directions was that he could not interrupt any task that was in
progress. Fortunately, the stories were written in such a way
that the batch size of work (which I’ll discuss in more detail in
Chapter 9) was only a day or two. This system is called agile
development for a good reason: teams that employ it are able to
change direction quickly, stay light on their feet, and be highly
responsive to changes in the business requirements of the
product owner (the manager of the process—in this case Farb—
who is responsible for prioritizing the stories). How did the
team feel at the end of each sprint? They consistently delivered
new product features. They would collect feedback from
customers in the form of anecdotes and interviews that indicated
that at least some customers liked the new features. There was
always a certain amount of data that showed improvement:
perhaps the total number of customers was increasing, the total
number of questions answered by students was going up, or the
number of returning customers was increasing. However, I
sensed that Farb and his team were left with lingering doubts
about the company’s overall progress. Was the increase in their
numbers actually caused by their development efforts? Or could
it be due to other factors, such as mentions of Grockit in the
press? When I met the team, I asked them this simple question:
How do you know that the prioritization decisions that Farb is
making actually make sense? Their answer: “That’s not our
department. Farb makes the decisions; we execute them.” At
that time Grockit was focused on just one customer segment:
prospective business school students who were studying for the
GMAT. The product allowed students to engage in online study
sessions with fellow students who were studying for the same
exam. The product was working: the students who completed
their studying via Grockit achieved significantly higher scores
than they had before. But the Grockit team was struggling with
the age-old startup problems: How do we know which features
to prioritize? How can we get more customers to sign up and
pay? How can we get out the word about our product? I put this
question to Farb: “How confident are you that you are making
the right decisions in terms of establishing priorities?” Like
most startup founders, he was looking at the available data and
making the best educated guesses he could. But this left a lot of
room for ambiguity and doubt. Farb believed in his vision
thoroughly and completely, yet he was starting to question
whether his company was on pace to realize that vision. The
product improved every day, but Farb wanted to make sure
those improvements mattered to customers. I believe he
deserves a lot of credit for realizing this. Unlike many
visionaries, who cling to their original vision no matter what,
Farb was willing to put his vision to the test. Farb worked hard
to sustain his team’s belief that Grockit was destined for
success. He was worried that morale would suffer if anyone
thought that the person steering the ship was uncertain about
which direction to go. Farb himself wasn’t sure if his team
would embrace a true learning culture. After all, this was part of
the grand bargain of agile development: engineers agree to
adapt the product to the business’s constantly changing
requirements but are not responsible for the quality of those
business decisions. Agile is an efficient system of development
from the point of view of the developers. It allows them to stay
focused on creating features and technical designs. An attempt
to introduce the need to learn into that process could undermine
productivity. (Lean manufacturing faced similar problems when
it was introduced in factories. Managers were used to focusing
on the utilization rate of each machine. Factories were designed
to keep machines running at full capacity as much of the time as
possible. Viewed from the perspective of the machine, that is
efficient, but from the point of view of the productivity of the
entire factory, it is wildly inefficient at times. As they say in
systems theory, that which optimizes one part of the system
necessarily undermines the system as a whole.) What Farb and
his team didn’t realize was that Grockit’s progress was being
measured by vanity metrics: the total number of customers and
the total number of questions answered. That was what was
causing his team to spin its wheels; those metrics gave the team
the sensation of forward motion even though the company was
making little progress. What’s interesting is how closely Farb’s
method followed superficial aspects of the Lean Startup
learning milestones: they shipped an early product and
established some baseline metrics. They had relatively short
iterations, each of which was judged by its ability to improve
customer metrics. However, because Grockit was using the
wrong kinds of metrics, the startup was not genuinely
improving. Farb was frustrated in his efforts to learn from
customer feedback. In every cycle, the type of metrics his team
was focused on would change: one month they would look at
gross usage numbers, another month registration numbers, and
so on. Those metrics would go up and down seemingly on their
own. He couldn’t draw clear cause-and-effect inferences.
Prioritizing work correctly in such an environment is extremely
challenging. Farb could have asked his data analyst to
investigate a particular question. For example, when we shipped
feature X, did it affect customer behavior? But that would have
required tremendous time and effort. When, exactly, did feature
X ship? Which customers were exposed to it? Was anything else
launched around that same time? Were there seasonal factors
that might be skewing the data? Finding these answers would
have required parsing reams and reams of data. The answer
often would come weeks after the question had been asked. In
the meantime, the team would have moved on to new priorities
and new questions that needed urgent attention. Compared to a
lot of startups, the Grockit team had a huge advantage: they
were tremendously disciplined. A disciplined team may apply
the wrong methodology but can shift gears quickly once it
discovers its error. Most important, a disciplined team can
experiment with its own working style and draw meaningful
conclusions.
Cohorts and Split-tests Grockit changed the metrics they used to
evaluate success in two ways. Instead of looking at gross
metrics, Grockit switched to cohort-based metrics, and instead
of looking for cause-and-effect relationships after the fact,
Grockit would launch each new feature as a true split-test
experiment. A split-test experiment is one in which different
versions of a product are offered to customers at the same time.
By observing the changes in behavior between the two groups,
one can make inferences about the impact of the different
variations. This technique was pioneered by direct mail
advertisers. For example, consider a company that sends
customers a catalog of products to buy, such as Lands’ End or
Crate & Barrel. If you wanted to test a catalog design, you
could send a new version of it to 50 percent of the customers
and send the old standard catalog to the other 50 percent. To
assure a scientific result, both catalogs would contain identical
products; the only difference would be the changes to the
design. To figure out if the new design was effective, all you
would have to do was keep track of the sales figures for both
groups of customers. (This technique is sometimes called A/B
testing after the practice of assigning letter names to each
variation.) Although split testing often is thought of as a
marketing-specific (or even a direct marketing–specific)
practice, Lean Startups incorporate it directly into product
development. These changes led to an immediate change in
Farb’s understanding of the business. Split testing often
uncovers surprising things. For example, many features that
make the product better in the eyes of engineers and designers
have no impact on customer behavior. This was the case at
Grockit, as it has been in every company I have seen adopt this
technique. Although working with split tests seems to be more
difficult because it requires extra accounting and metrics to
keep track of each variation, it almost always saves tremendous
amounts of time in the long run by eliminating work that
doesn’t matter to customers. Split testing also helps teams
refine their understanding of what customers want and don’t
want. Grockit’s team constantly added new ways for their
customers to interact with each other in the hope that those
social communication tools would increase the product’s value.
Inherent in those efforts was the belief that customers desired
more communication during their studying. When split testing
revealed that the extra features did not change customer
behavior, it called that belief into question. The questioning
inspired the team to seek a deeper understanding of what
customers really wanted. They brainstormed new ideas for
product experiments that might have more impact. In fact, many
of these ideas were not new. They had simply been overlooked
because the company was focused on building social tools. As a
result, Grockit tested an intensive solo-studying mode, complete
with quests and gamelike levels, so that students could have the
choice of studying by themselves or with others. Just as in
Farb’s original classroom, this proved extremely effective.
Without the discipline of split testing, the company might not
have had this realization. In fact, over time, through dozens of
tests, it became clear that the key to student engagement was to
offer them a combination of social and solo features. Students
preferred having a choice of how to study.
Kanban Following the lean manufacturing principle of kanban,
or capacity constraint, Grockit changed the product
prioritization process. Under the new system, user stories were
not considered complete until they led to validated learning.
Thus, stories could be cataloged as being in one of four states
of development: in the product backlog, actively being built,
done (feature complete from a technical point of view), or in the
process of being validated. Validated was defined as “knowing
whether the story was a good idea to have been done in the first
place.” This validation usually would come in the form of a
split test showing a change in customer behavior but also might
include customer interviews or surveys. The kanban rule
permitted only so many stories in each of the four states. As
stories flow from one state to the other, the buckets fill up.
Once a bucket becomes full, it cannot accept more stories. Only
when a story has been validated can it be removed from the
kanban board. If the validation fails and it turns out the story is
a bad idea, the relevant feature is removed from the product
(see the chart on this page).
B and C have been built, but under kanban, cannot be moved to
the next bucket for validation until A, D, E have been validated.
Work cannot begin on H and I until space opens up in the
buckets ahead. I have implemented this system with several
teams, and the initial result is always frustrating: each bucket
fills up, starting with the “validated” bucket and moving on to
the “done” bucket, until it’s not possible to start any more
work. Teams that are used to measuring their productivity
narrowly, by the number of stories they are delivering, feel
stuck. The only way to start work on new features is to
investigate some of the stories that are done but haven’t been
validated. That often requires nonengineering efforts: talking to
customers, looking at split-test data, and the like. Pretty soon
everyone gets the hang of it. This progress occurs in fits and
starts at first. Engineering may finish a big batch of work,
followed by extensive testing and validation. As engineers look
for ways to increase their productivity, they start to realize that
if they include the validation exercise from the beginning, the
whole team can be more productive. For example, why build a
new feature that is not part of a split-test experiment? It may
save you time in the short run, but it will take more time later to
test, during the validation phase. The same logic applies to a
story that an engineer doesn’t understand. Under the old system,
he or she would just build it and find out later what it was for.
In the new system, that behavior is clearly counterproductive:
without a clear hypothesis, how can a story ever be validated?
We saw this behavior at IMVU, too. I once saw a junior
engineer face down a senior executive over a relatively minor
change. The engineer insisted that the new feature be split-
tested, just like any other. His peers backed him up; it was
considered absolutely obvious that all features should be
routinely tested, no matter who was commissioning them.
(Embarrassingly, all too often I was the executive in question.)
A solid process lays the foundation for a healthy culture, one
where ideas are evaluated by merit and not by job title. Most
important, teams working in this system begin to measure their
productivity according to validated learning, not in terms of the
production of new features.
Hypothesis Testing at Grockit When Grockit made this
transition, the results were dramatic. In one case, they decided
to test one of their major features, called lazy registration, to
see if it was worth the heavy investment they were making in
ongoing support. They were confident in this feature because
lazy registration is considered one of the design best practices
for online services. In this system, customers do not have to
register for the service up front. Instead, they immediately
begin using the service and are asked to register only after they
have had a chance to experience the service’s benefit. For a
student, lazy registration works like this: when you come to the
Grockit website, you’re immediately placed in a study session
with other students working on the same test. You don’t have to
give your name, e-mail address, or credit card number. There is
nothing to prevent you from jumping in and getting started
immediately. For Grockit, this was essential to testing one of its
core assumptions: that customers would be willing to adopt this
new way of learning only if they could see proof that it was
working early on.
As a result of this hypothesis, Grockit’s design required that it
manage three classes of users: unregistered guests, registered
(trial) guests, and customers who had paid for the premium
version of the product. This design required significant extra
work to build and maintain: the more classes of users there are,
the more work is required to keep track of them, and the more
marketing effort is required to create the right incentives to
entice customers to upgrade to the next class. Grockit had
undertaken this extra effort because lazy registration was
considered an industry best practice. I encouraged the team to
try a simple split-test. They took one cohort of customers and
required that they register immediately, based on nothing more
than Grockit’s marketing materials. To their surprise, this
cohort’s behavior was exactly the same as that of the lazy
registration group: they had the same rate of registration,
activation, and subsequent retention. In other words, the extra
effort of lazy registration was a complete waste even though it
was considered an industry best practice. Even more important
than reducing waste was the insight that this test suggested:
customers were basing their decision about Grockit on
something other than their use of the product. Think about this.
Think about the cohort of customers who were required to
register for the product before entering a study session with
other students. They had very little information about the
product, nothing more than was presented on Grockit’s home
page and registration page. By contrast, the lazy registration
group had a tremendous amount of information about the
product because they had used it. Yet despite this information
disparity, customer behavior was exactly the same. This
suggested that improving Grockit’s positioning and marketing
might have a more significant impact on attracting new
customers than would adding new features. This was just the
first of many important experiments Grockit was able to run.
Since those early days, they have expanded their customer base
dramatically: they now offer test prep for numerous
standardized tests, including the GMAT, SAT, ACT, and GRE,
as well as online math and English courses for students in
grades 7 through 12. Grockit continues to evolve its process,
seeking continuous improvement at every turn. With more than
twenty employees in its San Francisco office, Grockit continues
to operate with the same deliberate, disciplined approach that
has been their hallmark all along. They have helped close to a
million students and are sure to help millions more.
Remove this instructional/explanatory text before submitting
assignment.
Use this slide (or create 1-4 additional slides) to explain LEAN
STARTUP Chapter 7 and the concept of MEASURE.
This is NOT a data dump, so do NOT fill these slides with an
overload of data. Your job is to sift through what may seem like
an infinite pool of data and facts (and opinions), and select the
most critical information to succinctly answer the question.
Think of it this way, you are summarizing this to demonstrate
that you carefully reviewed the videos assigned this week and
thought about this key question; and you are summarizing this
for someone who has very little time to read your summary.
So your summary must be succinct and you must get to the point
(IMPORTANT: you must have a point – an intended
message/insight). Your summary must be meaningful,
thoughtful, and insightful – rather than simply a bunch of
information.
Based on copyrighted materials - Michael D. Meeks - 2010
4. Describe Chapter 7 of LEAN STARTUP. What does the
author mean by MEASURE? Do you agree? Why?
Instructions
2

Contenu connexe

Similaire à Chapter 7 MEASURE At the beginning, a startup is little more than .docx

The Foundry Book Club - Lean Start Up Review
The Foundry Book Club - Lean Start Up ReviewThe Foundry Book Club - Lean Start Up Review
The Foundry Book Club - Lean Start Up ReviewEd Curley
 
The Mandate for Agile Measurement by BECKON
The Mandate for Agile Measurement by BECKONThe Mandate for Agile Measurement by BECKON
The Mandate for Agile Measurement by BECKONAmanda Roberts
 
Marketing in a new digital age
Marketing in a new digital ageMarketing in a new digital age
Marketing in a new digital ageGilang Gibranthama
 
ISMM Winning Edge - Why not experiement
ISMM Winning Edge - Why not experiementISMM Winning Edge - Why not experiement
ISMM Winning Edge - Why not experiementMark McCarthy
 
Abell's 3 dimensions critical sucess factor-kpi
Abell's 3 dimensions critical sucess factor-kpiAbell's 3 dimensions critical sucess factor-kpi
Abell's 3 dimensions critical sucess factor-kpiDr. Vardhan choubey
 
growth_vs_scaling_how_to_achieve_it.pdf
growth_vs_scaling_how_to_achieve_it.pdfgrowth_vs_scaling_how_to_achieve_it.pdf
growth_vs_scaling_how_to_achieve_it.pdfsarah david
 
Training manual - customer development
Training manual - customer developmentTraining manual - customer development
Training manual - customer developmentStartup Braga
 
Social Syndication - A Great Way To Expand Social Selling
Social Syndication - A Great Way To Expand Social SellingSocial Syndication - A Great Way To Expand Social Selling
Social Syndication - A Great Way To Expand Social SellingZINFI Technologies, Inc.
 
ROI - Taking Measure of Your Marketing Efforts
ROI - Taking Measure of Your Marketing EffortsROI - Taking Measure of Your Marketing Efforts
ROI - Taking Measure of Your Marketing EffortsSpryIdeas
 
4 ways to improve your customer performance measurement
4 ways to improve your customer performance measurement4 ways to improve your customer performance measurement
4 ways to improve your customer performance measurementObservePoint
 
Market Validation (Scale) (4).pdf
Market Validation (Scale) (4).pdfMarket Validation (Scale) (4).pdf
Market Validation (Scale) (4).pdfAneel Mitra
 
4 Customer Success Metrics to Inform Your Product-Led (Expansion) Growth Stra...
4 Customer Success Metrics to Inform Your Product-Led (Expansion) Growth Stra...4 Customer Success Metrics to Inform Your Product-Led (Expansion) Growth Stra...
4 Customer Success Metrics to Inform Your Product-Led (Expansion) Growth Stra...QuekelsBaro
 
ikano_whitepaper_ceo
ikano_whitepaper_ceoikano_whitepaper_ceo
ikano_whitepaper_ceoBarry Smith
 
Michael brunner accountability forbes com
Michael brunner accountability forbes comMichael brunner accountability forbes com
Michael brunner accountability forbes comBrunner
 
Subject Matter Experts Blue Paper
Subject Matter Experts Blue PaperSubject Matter Experts Blue Paper
Subject Matter Experts Blue Paper4imprint
 
Convincing your CEO to invest in a loyalty programme
Convincing your CEO to invest in a loyalty programmeConvincing your CEO to invest in a loyalty programme
Convincing your CEO to invest in a loyalty programmecolinjones001
 
New Business Venture Success Factors
New Business Venture Success FactorsNew Business Venture Success Factors
New Business Venture Success FactorsJoe Tawfik
 
Empowering_The_Data_Driven_Marketing_Team
Empowering_The_Data_Driven_Marketing_TeamEmpowering_The_Data_Driven_Marketing_Team
Empowering_The_Data_Driven_Marketing_TeamShelley Nguyen
 

Similaire à Chapter 7 MEASURE At the beginning, a startup is little more than .docx (20)

The Foundry Book Club - Lean Start Up Review
The Foundry Book Club - Lean Start Up ReviewThe Foundry Book Club - Lean Start Up Review
The Foundry Book Club - Lean Start Up Review
 
The Mandate for Agile Measurement by BECKON
The Mandate for Agile Measurement by BECKONThe Mandate for Agile Measurement by BECKON
The Mandate for Agile Measurement by BECKON
 
Marketing in a new digital age
Marketing in a new digital ageMarketing in a new digital age
Marketing in a new digital age
 
growth-vs-scaling-how-to-achieve-it
growth-vs-scaling-how-to-achieve-itgrowth-vs-scaling-how-to-achieve-it
growth-vs-scaling-how-to-achieve-it
 
ISMM Winning Edge - Why not experiement
ISMM Winning Edge - Why not experiementISMM Winning Edge - Why not experiement
ISMM Winning Edge - Why not experiement
 
Abell's 3 dimensions critical sucess factor-kpi
Abell's 3 dimensions critical sucess factor-kpiAbell's 3 dimensions critical sucess factor-kpi
Abell's 3 dimensions critical sucess factor-kpi
 
growth_vs_scaling_how_to_achieve_it.pdf
growth_vs_scaling_how_to_achieve_it.pdfgrowth_vs_scaling_how_to_achieve_it.pdf
growth_vs_scaling_how_to_achieve_it.pdf
 
Training manual - customer development
Training manual - customer developmentTraining manual - customer development
Training manual - customer development
 
Social Syndication - A Great Way To Expand Social Selling
Social Syndication - A Great Way To Expand Social SellingSocial Syndication - A Great Way To Expand Social Selling
Social Syndication - A Great Way To Expand Social Selling
 
ROI - Taking Measure of Your Marketing Efforts
ROI - Taking Measure of Your Marketing EffortsROI - Taking Measure of Your Marketing Efforts
ROI - Taking Measure of Your Marketing Efforts
 
4 ways to improve your customer performance measurement
4 ways to improve your customer performance measurement4 ways to improve your customer performance measurement
4 ways to improve your customer performance measurement
 
Market Validation (Scale) (4).pdf
Market Validation (Scale) (4).pdfMarket Validation (Scale) (4).pdf
Market Validation (Scale) (4).pdf
 
4 Customer Success Metrics to Inform Your Product-Led (Expansion) Growth Stra...
4 Customer Success Metrics to Inform Your Product-Led (Expansion) Growth Stra...4 Customer Success Metrics to Inform Your Product-Led (Expansion) Growth Stra...
4 Customer Success Metrics to Inform Your Product-Led (Expansion) Growth Stra...
 
ikano_whitepaper_ceo
ikano_whitepaper_ceoikano_whitepaper_ceo
ikano_whitepaper_ceo
 
Michael brunner accountability forbes com
Michael brunner accountability forbes comMichael brunner accountability forbes com
Michael brunner accountability forbes com
 
Subject Matter Experts Blue Paper
Subject Matter Experts Blue PaperSubject Matter Experts Blue Paper
Subject Matter Experts Blue Paper
 
ebook-Differentiate
ebook-Differentiateebook-Differentiate
ebook-Differentiate
 
Convincing your CEO to invest in a loyalty programme
Convincing your CEO to invest in a loyalty programmeConvincing your CEO to invest in a loyalty programme
Convincing your CEO to invest in a loyalty programme
 
New Business Venture Success Factors
New Business Venture Success FactorsNew Business Venture Success Factors
New Business Venture Success Factors
 
Empowering_The_Data_Driven_Marketing_Team
Empowering_The_Data_Driven_Marketing_TeamEmpowering_The_Data_Driven_Marketing_Team
Empowering_The_Data_Driven_Marketing_Team
 

Plus de mccormicknadine86

Option #2Researching a Leader Complete preliminary rese.docx
Option #2Researching a Leader Complete preliminary rese.docxOption #2Researching a Leader Complete preliminary rese.docx
Option #2Researching a Leader Complete preliminary rese.docxmccormicknadine86
 
Option 1 ImperialismThe exploitation of  colonial resources.docx
Option 1 ImperialismThe exploitation of  colonial resources.docxOption 1 ImperialismThe exploitation of  colonial resources.docx
Option 1 ImperialismThe exploitation of  colonial resources.docxmccormicknadine86
 
Option Wireless LTD v. OpenPeak, Inc.Be sure to save an elec.docx
Option Wireless LTD v. OpenPeak, Inc.Be sure to save an elec.docxOption Wireless LTD v. OpenPeak, Inc.Be sure to save an elec.docx
Option Wireless LTD v. OpenPeak, Inc.Be sure to save an elec.docxmccormicknadine86
 
Option A Land SharkWhen is a shark just a shark Consider the.docx
Option A Land SharkWhen is a shark just a shark Consider the.docxOption A Land SharkWhen is a shark just a shark Consider the.docx
Option A Land SharkWhen is a shark just a shark Consider the.docxmccormicknadine86
 
Option 3 Discuss your thoughts on drugs and deviance. Do you think .docx
Option 3 Discuss your thoughts on drugs and deviance. Do you think .docxOption 3 Discuss your thoughts on drugs and deviance. Do you think .docx
Option 3 Discuss your thoughts on drugs and deviance. Do you think .docxmccormicknadine86
 
OPTION 2 Can we make the changes we need to make After the pandemi.docx
OPTION 2 Can we make the changes we need to make After the pandemi.docxOPTION 2 Can we make the changes we need to make After the pandemi.docx
OPTION 2 Can we make the changes we need to make After the pandemi.docxmccormicknadine86
 
Option 1 You will create a PowerPoint (or equivalent) of your p.docx
Option 1 You will create a PowerPoint (or equivalent) of your p.docxOption 1 You will create a PowerPoint (or equivalent) of your p.docx
Option 1 You will create a PowerPoint (or equivalent) of your p.docxmccormicknadine86
 
Option A Description of Dance StylesSelect two styles of danc.docx
Option A Description of Dance StylesSelect two styles of danc.docxOption A Description of Dance StylesSelect two styles of danc.docx
Option A Description of Dance StylesSelect two styles of danc.docxmccormicknadine86
 
Option #2Provide several slides that explain the key section.docx
Option #2Provide several slides that explain the key section.docxOption #2Provide several slides that explain the key section.docx
Option #2Provide several slides that explain the key section.docxmccormicknadine86
 
Option 2 Slavery vs. Indentured ServitudeExplain how and wh.docx
Option 2 Slavery vs. Indentured ServitudeExplain how and wh.docxOption 2 Slavery vs. Indentured ServitudeExplain how and wh.docx
Option 2 Slavery vs. Indentured ServitudeExplain how and wh.docxmccormicknadine86
 
Option 2 ArtSelect any 2 of works of art about the Holocaus.docx
Option 2 ArtSelect any 2 of works of art about the Holocaus.docxOption 2 ArtSelect any 2 of works of art about the Holocaus.docx
Option 2 ArtSelect any 2 of works of art about the Holocaus.docxmccormicknadine86
 
Option #1 Stanford University Prison Experiment Causality, C.docx
Option #1 Stanford University Prison Experiment Causality, C.docxOption #1 Stanford University Prison Experiment Causality, C.docx
Option #1 Stanford University Prison Experiment Causality, C.docxmccormicknadine86
 
Option A  Gender CrimesCriminal acts occur against individu.docx
Option A  Gender CrimesCriminal acts occur against individu.docxOption A  Gender CrimesCriminal acts occur against individu.docx
Option A  Gender CrimesCriminal acts occur against individu.docxmccormicknadine86
 
opic 4 Discussion Question 1 May students express religious bel.docx
opic 4 Discussion Question 1 May students express religious bel.docxopic 4 Discussion Question 1 May students express religious bel.docx
opic 4 Discussion Question 1 May students express religious bel.docxmccormicknadine86
 
Option 1Choose a philosopher who interests you. Research that p.docx
Option 1Choose a philosopher who interests you. Research that p.docxOption 1Choose a philosopher who interests you. Research that p.docx
Option 1Choose a philosopher who interests you. Research that p.docxmccormicknadine86
 
Option #1The Stanford University Prison Experiment Structu.docx
Option #1The Stanford University Prison Experiment Structu.docxOption #1The Stanford University Prison Experiment Structu.docx
Option #1The Stanford University Prison Experiment Structu.docxmccormicknadine86
 
Operationaland Organizational SecurityChapter 3Princ.docx
Operationaland Organizational SecurityChapter 3Princ.docxOperationaland Organizational SecurityChapter 3Princ.docx
Operationaland Organizational SecurityChapter 3Princ.docxmccormicknadine86
 
Open the file (Undergrad Reqt_Individual In-Depth Case Study) for in.docx
Open the file (Undergrad Reqt_Individual In-Depth Case Study) for in.docxOpen the file (Undergrad Reqt_Individual In-Depth Case Study) for in.docx
Open the file (Undergrad Reqt_Individual In-Depth Case Study) for in.docxmccormicknadine86
 
onsider whether you think means-tested programs, such as the Tem.docx
onsider whether you think means-tested programs, such as the Tem.docxonsider whether you think means-tested programs, such as the Tem.docx
onsider whether you think means-tested programs, such as the Tem.docxmccormicknadine86
 
Operations security - PPT should cover below questions (chapter 1 to.docx
Operations security - PPT should cover below questions (chapter 1 to.docxOperations security - PPT should cover below questions (chapter 1 to.docx
Operations security - PPT should cover below questions (chapter 1 to.docxmccormicknadine86
 

Plus de mccormicknadine86 (20)

Option #2Researching a Leader Complete preliminary rese.docx
Option #2Researching a Leader Complete preliminary rese.docxOption #2Researching a Leader Complete preliminary rese.docx
Option #2Researching a Leader Complete preliminary rese.docx
 
Option 1 ImperialismThe exploitation of  colonial resources.docx
Option 1 ImperialismThe exploitation of  colonial resources.docxOption 1 ImperialismThe exploitation of  colonial resources.docx
Option 1 ImperialismThe exploitation of  colonial resources.docx
 
Option Wireless LTD v. OpenPeak, Inc.Be sure to save an elec.docx
Option Wireless LTD v. OpenPeak, Inc.Be sure to save an elec.docxOption Wireless LTD v. OpenPeak, Inc.Be sure to save an elec.docx
Option Wireless LTD v. OpenPeak, Inc.Be sure to save an elec.docx
 
Option A Land SharkWhen is a shark just a shark Consider the.docx
Option A Land SharkWhen is a shark just a shark Consider the.docxOption A Land SharkWhen is a shark just a shark Consider the.docx
Option A Land SharkWhen is a shark just a shark Consider the.docx
 
Option 3 Discuss your thoughts on drugs and deviance. Do you think .docx
Option 3 Discuss your thoughts on drugs and deviance. Do you think .docxOption 3 Discuss your thoughts on drugs and deviance. Do you think .docx
Option 3 Discuss your thoughts on drugs and deviance. Do you think .docx
 
OPTION 2 Can we make the changes we need to make After the pandemi.docx
OPTION 2 Can we make the changes we need to make After the pandemi.docxOPTION 2 Can we make the changes we need to make After the pandemi.docx
OPTION 2 Can we make the changes we need to make After the pandemi.docx
 
Option 1 You will create a PowerPoint (or equivalent) of your p.docx
Option 1 You will create a PowerPoint (or equivalent) of your p.docxOption 1 You will create a PowerPoint (or equivalent) of your p.docx
Option 1 You will create a PowerPoint (or equivalent) of your p.docx
 
Option A Description of Dance StylesSelect two styles of danc.docx
Option A Description of Dance StylesSelect two styles of danc.docxOption A Description of Dance StylesSelect two styles of danc.docx
Option A Description of Dance StylesSelect two styles of danc.docx
 
Option #2Provide several slides that explain the key section.docx
Option #2Provide several slides that explain the key section.docxOption #2Provide several slides that explain the key section.docx
Option #2Provide several slides that explain the key section.docx
 
Option 2 Slavery vs. Indentured ServitudeExplain how and wh.docx
Option 2 Slavery vs. Indentured ServitudeExplain how and wh.docxOption 2 Slavery vs. Indentured ServitudeExplain how and wh.docx
Option 2 Slavery vs. Indentured ServitudeExplain how and wh.docx
 
Option 2 ArtSelect any 2 of works of art about the Holocaus.docx
Option 2 ArtSelect any 2 of works of art about the Holocaus.docxOption 2 ArtSelect any 2 of works of art about the Holocaus.docx
Option 2 ArtSelect any 2 of works of art about the Holocaus.docx
 
Option #1 Stanford University Prison Experiment Causality, C.docx
Option #1 Stanford University Prison Experiment Causality, C.docxOption #1 Stanford University Prison Experiment Causality, C.docx
Option #1 Stanford University Prison Experiment Causality, C.docx
 
Option A  Gender CrimesCriminal acts occur against individu.docx
Option A  Gender CrimesCriminal acts occur against individu.docxOption A  Gender CrimesCriminal acts occur against individu.docx
Option A  Gender CrimesCriminal acts occur against individu.docx
 
opic 4 Discussion Question 1 May students express religious bel.docx
opic 4 Discussion Question 1 May students express religious bel.docxopic 4 Discussion Question 1 May students express religious bel.docx
opic 4 Discussion Question 1 May students express religious bel.docx
 
Option 1Choose a philosopher who interests you. Research that p.docx
Option 1Choose a philosopher who interests you. Research that p.docxOption 1Choose a philosopher who interests you. Research that p.docx
Option 1Choose a philosopher who interests you. Research that p.docx
 
Option #1The Stanford University Prison Experiment Structu.docx
Option #1The Stanford University Prison Experiment Structu.docxOption #1The Stanford University Prison Experiment Structu.docx
Option #1The Stanford University Prison Experiment Structu.docx
 
Operationaland Organizational SecurityChapter 3Princ.docx
Operationaland Organizational SecurityChapter 3Princ.docxOperationaland Organizational SecurityChapter 3Princ.docx
Operationaland Organizational SecurityChapter 3Princ.docx
 
Open the file (Undergrad Reqt_Individual In-Depth Case Study) for in.docx
Open the file (Undergrad Reqt_Individual In-Depth Case Study) for in.docxOpen the file (Undergrad Reqt_Individual In-Depth Case Study) for in.docx
Open the file (Undergrad Reqt_Individual In-Depth Case Study) for in.docx
 
onsider whether you think means-tested programs, such as the Tem.docx
onsider whether you think means-tested programs, such as the Tem.docxonsider whether you think means-tested programs, such as the Tem.docx
onsider whether you think means-tested programs, such as the Tem.docx
 
Operations security - PPT should cover below questions (chapter 1 to.docx
Operations security - PPT should cover below questions (chapter 1 to.docxOperations security - PPT should cover below questions (chapter 1 to.docx
Operations security - PPT should cover below questions (chapter 1 to.docx
 

Dernier

Paris 2024 Olympic Geographies - an activity
Paris 2024 Olympic Geographies - an activityParis 2024 Olympic Geographies - an activity
Paris 2024 Olympic Geographies - an activityGeoBlogs
 
The basics of sentences session 2pptx copy.pptx
The basics of sentences session 2pptx copy.pptxThe basics of sentences session 2pptx copy.pptx
The basics of sentences session 2pptx copy.pptxheathfieldcps1
 
18-04-UA_REPORT_MEDIALITERAСY_INDEX-DM_23-1-final-eng.pdf
18-04-UA_REPORT_MEDIALITERAСY_INDEX-DM_23-1-final-eng.pdf18-04-UA_REPORT_MEDIALITERAСY_INDEX-DM_23-1-final-eng.pdf
18-04-UA_REPORT_MEDIALITERAСY_INDEX-DM_23-1-final-eng.pdfssuser54595a
 
POINT- BIOCHEMISTRY SEM 2 ENZYMES UNIT 5.pptx
POINT- BIOCHEMISTRY SEM 2 ENZYMES UNIT 5.pptxPOINT- BIOCHEMISTRY SEM 2 ENZYMES UNIT 5.pptx
POINT- BIOCHEMISTRY SEM 2 ENZYMES UNIT 5.pptxSayali Powar
 
Nutritional Needs Presentation - HLTH 104
Nutritional Needs Presentation - HLTH 104Nutritional Needs Presentation - HLTH 104
Nutritional Needs Presentation - HLTH 104misteraugie
 
Student login on Anyboli platform.helpin
Student login on Anyboli platform.helpinStudent login on Anyboli platform.helpin
Student login on Anyboli platform.helpinRaunakKeshri1
 
“Oh GOSH! Reflecting on Hackteria's Collaborative Practices in a Global Do-It...
“Oh GOSH! Reflecting on Hackteria's Collaborative Practices in a Global Do-It...“Oh GOSH! Reflecting on Hackteria's Collaborative Practices in a Global Do-It...
“Oh GOSH! Reflecting on Hackteria's Collaborative Practices in a Global Do-It...Marc Dusseiller Dusjagr
 
Web & Social Media Analytics Previous Year Question Paper.pdf
Web & Social Media Analytics Previous Year Question Paper.pdfWeb & Social Media Analytics Previous Year Question Paper.pdf
Web & Social Media Analytics Previous Year Question Paper.pdfJayanti Pande
 
BASLIQ CURRENT LOOKBOOK LOOKBOOK(1) (1).pdf
BASLIQ CURRENT LOOKBOOK  LOOKBOOK(1) (1).pdfBASLIQ CURRENT LOOKBOOK  LOOKBOOK(1) (1).pdf
BASLIQ CURRENT LOOKBOOK LOOKBOOK(1) (1).pdfSoniaTolstoy
 
Beyond the EU: DORA and NIS 2 Directive's Global Impact
Beyond the EU: DORA and NIS 2 Directive's Global ImpactBeyond the EU: DORA and NIS 2 Directive's Global Impact
Beyond the EU: DORA and NIS 2 Directive's Global ImpactPECB
 
Activity 01 - Artificial Culture (1).pdf
Activity 01 - Artificial Culture (1).pdfActivity 01 - Artificial Culture (1).pdf
Activity 01 - Artificial Culture (1).pdfciinovamais
 
Employee wellbeing at the workplace.pptx
Employee wellbeing at the workplace.pptxEmployee wellbeing at the workplace.pptx
Employee wellbeing at the workplace.pptxNirmalaLoungPoorunde1
 
Sanyam Choudhary Chemistry practical.pdf
Sanyam Choudhary Chemistry practical.pdfSanyam Choudhary Chemistry practical.pdf
Sanyam Choudhary Chemistry practical.pdfsanyamsingh5019
 
Hybridoma Technology ( Production , Purification , and Application )
Hybridoma Technology  ( Production , Purification , and Application  ) Hybridoma Technology  ( Production , Purification , and Application  )
Hybridoma Technology ( Production , Purification , and Application ) Sakshi Ghasle
 
Interactive Powerpoint_How to Master effective communication
Interactive Powerpoint_How to Master effective communicationInteractive Powerpoint_How to Master effective communication
Interactive Powerpoint_How to Master effective communicationnomboosow
 
Organic Name Reactions for the students and aspirants of Chemistry12th.pptx
Organic Name Reactions  for the students and aspirants of Chemistry12th.pptxOrganic Name Reactions  for the students and aspirants of Chemistry12th.pptx
Organic Name Reactions for the students and aspirants of Chemistry12th.pptxVS Mahajan Coaching Centre
 
microwave assisted reaction. General introduction
microwave assisted reaction. General introductionmicrowave assisted reaction. General introduction
microwave assisted reaction. General introductionMaksud Ahmed
 
Introduction to AI in Higher Education_draft.pptx
Introduction to AI in Higher Education_draft.pptxIntroduction to AI in Higher Education_draft.pptx
Introduction to AI in Higher Education_draft.pptxpboyjonauth
 

Dernier (20)

Paris 2024 Olympic Geographies - an activity
Paris 2024 Olympic Geographies - an activityParis 2024 Olympic Geographies - an activity
Paris 2024 Olympic Geographies - an activity
 
The basics of sentences session 2pptx copy.pptx
The basics of sentences session 2pptx copy.pptxThe basics of sentences session 2pptx copy.pptx
The basics of sentences session 2pptx copy.pptx
 
18-04-UA_REPORT_MEDIALITERAСY_INDEX-DM_23-1-final-eng.pdf
18-04-UA_REPORT_MEDIALITERAСY_INDEX-DM_23-1-final-eng.pdf18-04-UA_REPORT_MEDIALITERAСY_INDEX-DM_23-1-final-eng.pdf
18-04-UA_REPORT_MEDIALITERAСY_INDEX-DM_23-1-final-eng.pdf
 
POINT- BIOCHEMISTRY SEM 2 ENZYMES UNIT 5.pptx
POINT- BIOCHEMISTRY SEM 2 ENZYMES UNIT 5.pptxPOINT- BIOCHEMISTRY SEM 2 ENZYMES UNIT 5.pptx
POINT- BIOCHEMISTRY SEM 2 ENZYMES UNIT 5.pptx
 
Nutritional Needs Presentation - HLTH 104
Nutritional Needs Presentation - HLTH 104Nutritional Needs Presentation - HLTH 104
Nutritional Needs Presentation - HLTH 104
 
Student login on Anyboli platform.helpin
Student login on Anyboli platform.helpinStudent login on Anyboli platform.helpin
Student login on Anyboli platform.helpin
 
“Oh GOSH! Reflecting on Hackteria's Collaborative Practices in a Global Do-It...
“Oh GOSH! Reflecting on Hackteria's Collaborative Practices in a Global Do-It...“Oh GOSH! Reflecting on Hackteria's Collaborative Practices in a Global Do-It...
“Oh GOSH! Reflecting on Hackteria's Collaborative Practices in a Global Do-It...
 
INDIA QUIZ 2024 RLAC DELHI UNIVERSITY.pptx
INDIA QUIZ 2024 RLAC DELHI UNIVERSITY.pptxINDIA QUIZ 2024 RLAC DELHI UNIVERSITY.pptx
INDIA QUIZ 2024 RLAC DELHI UNIVERSITY.pptx
 
Web & Social Media Analytics Previous Year Question Paper.pdf
Web & Social Media Analytics Previous Year Question Paper.pdfWeb & Social Media Analytics Previous Year Question Paper.pdf
Web & Social Media Analytics Previous Year Question Paper.pdf
 
BASLIQ CURRENT LOOKBOOK LOOKBOOK(1) (1).pdf
BASLIQ CURRENT LOOKBOOK  LOOKBOOK(1) (1).pdfBASLIQ CURRENT LOOKBOOK  LOOKBOOK(1) (1).pdf
BASLIQ CURRENT LOOKBOOK LOOKBOOK(1) (1).pdf
 
Beyond the EU: DORA and NIS 2 Directive's Global Impact
Beyond the EU: DORA and NIS 2 Directive's Global ImpactBeyond the EU: DORA and NIS 2 Directive's Global Impact
Beyond the EU: DORA and NIS 2 Directive's Global Impact
 
Activity 01 - Artificial Culture (1).pdf
Activity 01 - Artificial Culture (1).pdfActivity 01 - Artificial Culture (1).pdf
Activity 01 - Artificial Culture (1).pdf
 
Employee wellbeing at the workplace.pptx
Employee wellbeing at the workplace.pptxEmployee wellbeing at the workplace.pptx
Employee wellbeing at the workplace.pptx
 
Sanyam Choudhary Chemistry practical.pdf
Sanyam Choudhary Chemistry practical.pdfSanyam Choudhary Chemistry practical.pdf
Sanyam Choudhary Chemistry practical.pdf
 
Hybridoma Technology ( Production , Purification , and Application )
Hybridoma Technology  ( Production , Purification , and Application  ) Hybridoma Technology  ( Production , Purification , and Application  )
Hybridoma Technology ( Production , Purification , and Application )
 
Interactive Powerpoint_How to Master effective communication
Interactive Powerpoint_How to Master effective communicationInteractive Powerpoint_How to Master effective communication
Interactive Powerpoint_How to Master effective communication
 
Mattingly "AI & Prompt Design: The Basics of Prompt Design"
Mattingly "AI & Prompt Design: The Basics of Prompt Design"Mattingly "AI & Prompt Design: The Basics of Prompt Design"
Mattingly "AI & Prompt Design: The Basics of Prompt Design"
 
Organic Name Reactions for the students and aspirants of Chemistry12th.pptx
Organic Name Reactions  for the students and aspirants of Chemistry12th.pptxOrganic Name Reactions  for the students and aspirants of Chemistry12th.pptx
Organic Name Reactions for the students and aspirants of Chemistry12th.pptx
 
microwave assisted reaction. General introduction
microwave assisted reaction. General introductionmicrowave assisted reaction. General introduction
microwave assisted reaction. General introduction
 
Introduction to AI in Higher Education_draft.pptx
Introduction to AI in Higher Education_draft.pptxIntroduction to AI in Higher Education_draft.pptx
Introduction to AI in Higher Education_draft.pptx
 

Chapter 7 MEASURE At the beginning, a startup is little more than .docx

  • 1. Chapter 7 MEASURE At the beginning, a startup is little more than a model on a piece of paper. The financials in the business plan include projections of how many customers the company expects to attract, how much it will spend, and how much revenue and profit that will lead to. It’s an ideal that’s usually far from where the startup is in its early days. A startup’s job is to (1) rigorously measure where it is right now, confronting the hard truths that assessment reveals, and then (2) devise experiments to learn how to move the real numbers closer to the ideal reflected in the business plan. Most products—even the ones that fail—do not have zero traction. Most products have some customers, some growth, and some positive results. One of the most dangerous outcomes for a startup is to bumble along in the land of the living dead. Employees and entrepreneurs tend to be optimistic by nature. We want to keep believing in our ideas even when the writing is on the wall. This is why the myth of perseverance is so dangerous. We all know stories of epic entrepreneurs who managed to pull out a victory when things seemed incredibly bleak. Unfortunately, we don’t hear stories about the countless nameless others who persevered too long, leading their companies to failure. WHY SOMETHING AS SEEMINGLY DULL AS ACCOUNTING WILL CHANGE YOUR LIFE People are accustomed to thinking of accounting as dry and boring, a necessary evil used primarily to prepare financial reports and survive audits, but that is because accounting is something that has become taken for granted. Historically, under the leadership of people such as Alfred Sloan at General Motors, accounting became an essential part of the method of exerting centralized control over far-flung divisions. Accounting allowed GM to set clear milestones for each of its divisions and then hold each manager accountable for his or her division’s success in reaching those goals. All modern corporations use some
  • 2. variation of that approach. Accounting is the key to their success. Unfortunately, standard accounting is not helpful in evaluating entrepreneurs. Startups are too unpredictable for forecasts and milestones to be accurate. I recently met with a phenomenal startup team. They are well financed, have significant customer traction, and are growing rapidly. Their product is a leader in an emerging category of enterprise software that uses consumer marketing techniques to sell into large companies. For example, they rely on employee-to- employee viral adoption rather than a traditional sales process, which might target the chief information officer or the head of information technology (IT). As a result, they have the opportunity to use cutting-edge experimental techniques as they constantly revise their product. During the meeting, I asked the team a simple question that I make a habit of asking startups whenever we meet: are you making your product better? They always say yes. Then I ask: how do you know? I invariably get this answer: well, we are in engineering and we made a number of changes last month, and our customers seem to like them, and our overall numbers are higher this month. We must be on the right track. This is the kind of storytelling that takes place at most startup board meetings. Most milestones are built the same way: hit a certain product milestone, maybe talk to a few customers, and see if the numbers go up. Unfortunately, this is not a good indicator of whether a startup is making progress. How do we know that the changes we’ve made are related to the results we’re seeing? More important, how do we know that we are drawing the right lessons from those changes? To answer these kinds of questions, startups have a strong need for a new kind of accounting geared specifically to disruptive innovation. That’s what innovation accounting is. An Accountability Framework That Works Across Industries Innovation accounting enables startups to prove objectively that they are learning how to grow a sustainable business. Innovation accounting begins by turning the leap-of-faith
  • 3. assumptions discussed in Chapter 5 into a quantitative financial model. Every business plan has some kind of model associated with it, even if it’s written on the back of a napkin. That model provides assumptions about what the business will look like at a successful point in the future. For example, the business plan for an established manufacturing company would show it growing in proportion to its sales volume. As the profits from the sales of goods are reinvested in marketing and promotions, the company gains new customers. The rate of growth depends primarily on three things: the profitability of each customer, the cost of acquiring new customers, and the repeat purchase rate of existing customers. The higher these values are, the faster the company will grow and the more profitable it will be. These are the drivers of the company’s growth model. By contrast, a marketplace company that matches buyers and sellers such as eBay will have a different growth model. Its success depends primarily on the network effects that make it the premier destination for both buyers and sellers to transact business. Sellers want the marketplace with the highest number of potential customers. Buyers want the marketplace with the most competition among sellers, which leads to the greatest availability of products and the lowest prices. (In economics, this sometimes is called supply-side increasing returns and demand-side increasing returns.) For this kind of startup, the important thing to measure is that the network effects are working, as evidenced by the high retention rate of new buyers and sellers. If people stick with the product with very little attrition, the marketplace will grow no matter how the company acquires new customers. The growth curve will look like a compounding interest table, with the rate of growth depending on the “interest rate” of new customers coming to the product. Though these two businesses have very different drivers of growth, we can still use a common framework to hold their leaders accountable. This framework supports accountability even when the model changes. HOW INNOVATION ACCOUNTING WORKS—THREE
  • 4. LEARNING MILESTONES Innovation accounting works in three steps: first, use a minimum viable product to establish real data on where the company is right now. Without a clear-eyed picture of your current status—no matter how far from the goal you may be—you cannot begin to track your progress. Second, startups must attempt to tune the engine from the baseline toward the ideal. This may take many attempts. After the startup has made all the micro changes and product optimizations it can to move its baseline toward the ideal, the company reaches a decision point. That is the third step: pivot or persevere. If the company is making good progress toward the ideal, that means it’s learning appropriately and using that learning effectively, in which case it makes sense to continue. If not, the management team eventually must conclude that its current product strategy is flawed and needs a serious change. When a company pivots, it starts the process all over again, reestablishing a new baseline and then tuning the engine from there. The sign of a successful pivot is that these engine-tuning activities are more productive after the pivot than before. Establish the Baseline For example, a startup might create a complete prototype of its product and offer to sell it to real customers through its main marketing channel. This single MVP would test most of the startup’s assumptions and establish baseline metrics for each assumption simultaneously. Alternatively, a startup might prefer to build separate MVPs that are aimed at getting feedback on one assumption at a time. Before building the prototype, the company might perform a smoke test with its marketing materials. This is an old direct marketing technique in which customers are given the opportunity to preorder a product that has not yet been built. A smoke test measures only one thing: whether customers are interested in trying a product. By itself, this is insufficient to validate an entire growth model. Nonetheless, it can be very useful to get feedback on this assumption before committing more money and other resources to the product. These MVPs
  • 5. provide the first example of a learning milestone. An MVP allows a startup to fill in real baseline data in its growth model—conversion rates, sign-up and trial rates, customer lifetime value, and so on—and this is valuable as the foundation for learning about customers and their reactions to a product even if that foundation begins with extremely bad news. When one is choosing among the many assumptions in a business plan, it makes sense to test the riskiest assumptions first. If you can’t find a way to mitigate these risks toward the ideal that is required for a sustainable business, there is no point in testing the others. For example, a media business that is selling advertising has two basic assumptions that take the form of questions: Can it capture the attention of a defined customer segment on an ongoing basis? and can it sell that attention to advertisers? In a business in which the advertising rates for a particular customer segment are well known, the far riskier assumption is the ability to capture attention. Therefore, the first experiments should involve content production rather than advertising sales. Perhaps the company will produce a pilot episode or issue to see how customers engage. Tuning the Engine Once the baseline has been established, the startup can work toward the second learning milestone: tuning the engine. Every product development, marketing, or other initiative that a startup undertakes should be targeted at improving one of the drivers of its growth model. For example, a company might spend time improving the design of its product to make it easier for new customers to use. This presupposes that the activation rate of new customers is a driver of growth and that its baseline is lower than the company would like. To demonstrate validated learning, the design changes must improve the activation rate of new customers. If they do not, the new design should be judged a failure. This is an important rule: a good design is one that changes customer behavior for the better. Compare two startups. The first company sets out with a clear baseline metric, a hypothesis about what will improve that metric, and a set of experiments designed to test
  • 6. that hypothesis. The second team sits around debating what would improve the product, implements several of those changes at once, and celebrates if there is any positive increase in any of the numbers. Which startup is more likely to be doing effective work and achieving lasting results? Pivot or Persevere Over time, a team that is learning its way toward a sustainable business will see the numbers in its model rise from the horrible baseline established by the MVP and converge to something like the ideal one established in the business plan. A startup that fails to do so will see that ideal recede ever farther into the distance. When this is done right, even the most powerful reality distortion field won’t be able to cover up this simple fact: if we’re not moving the drivers of our business model, we’re not making progress. That becomes a sure sign that it’s time to pivot. INNOVATION ACCOUNTING AT IMVU Here’s what innovation accounting looked like for us in the early days of IMVU. Our minimum viable product had many defects and, when we first released it, extremely low sales. We naturally assumed that the lack of sales was related to the low quality of the product, so week after week we worked on improving the quality of the product, trusting that our efforts were worthwhile. At the end of each month, we would have a board meeting at which we would present the results. The night before the board meeting, we’d run our standard analytics, measuring conversion rates, customer counts, and revenue to show what a good job we had done. For several meetings in a row, this caused a last- minute panic because the quality improvements were not yielding any change in customer behavior. This led to some frustrating board meetings at which we could show great product “progress” but not much in the way of business results. After a while, rather than leave it to the last minute, we began to track our metrics more frequently, tightening the feedback loop with product development. This was even more depressing. Week in, week out, our product changes were having no effect. Improving a Product on Five Dollars a Day We tracked the
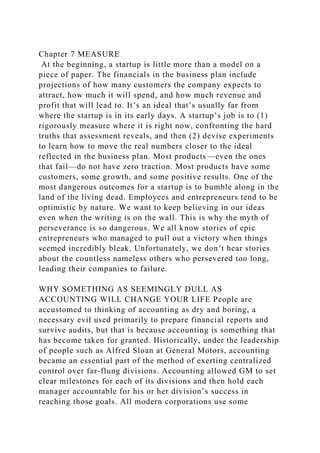
  • 7. “funnel metrics” behaviors that were critical to our engine of growth: customer registration, the download of our application, trial, repeat usage, and purchase. To have enough data to learn, we needed just enough customers using our product to get real numbers for each behavior. We allocated a budget of five dollars per day: enough to buy clicks on the then-new Google AdWords system. In those days, the minimum you could bid for a click was 5 cents, but there was no overall minimum to your spending. Thus, we could afford to open an account and get started even though we had very little money.1 Five dollars bought us a hundred clicks—every day. From a marketing point of view this was not very significant, but for learning it was priceless. Every single day we were able to measure our product’s performance with a brand new set of customers. Also, each time we revised the product, we got a brand new report card on how we were doing the very next day. For example, one day we would debut a new marketing message aimed at first- time customers. The next day we might change the way new customers were initiated into the product. Other days, we would add new features, fix bugs, roll out a new visual design, or try a new layout for our website. Every time, we told ourselves we were making the product better, but that subjective confidence was put to the acid test of real numbers. Day in and day out we were performing random trials. Each day was a new experiment. Each day’s customers were independent of those of the day before. Most important, even though our gross numbers were growing, it became clear that our funnel metrics were not changing. Here is a graph from one of IMVU’s early board meetings: This graph represents approximately seven months of work. Over that period, we were making constant improvements to the IMVU product, releasing new features on a daily basis. We were conducting a lot of in-person customer interviews, and our product development team was working extremely hard. Cohort Analysis To read the graph, you need to understand
  • 8. something called cohort analysis. This is one of the most important tools of startup analytics. Although it sounds complex, it is based on a simple premise. Instead of looking at cumulative totals or gross numbers such as total revenue and total number of customers, one looks at the performance of each group of customers that comes into contact with the product independently. Each group is called a cohort. The graph shows the conversion rates to IMVU of new customers who joined in each indicated month. Each conversion rate shows the percentage of customer who registered in that month who subsequently went on to take the indicated action. Thus, among all the customers who joined IMVU in February 2005, about 60 percent of them logged in to our product at least one time. Managers with an enterprise sales background will recognize this funnel analysis as the traditional sales funnel that is used to manage prospects on their way to becoming customers. Lean Startups use it in product development, too. This technique is useful in many types of business, because every company depends for its survival on sequences of customer behavior called flows. Customer flows govern the interaction of customers with a company’s products. They allow us to understand a business quantitatively and have much more predictive power than do traditional gross metrics. If you look closely, you’ll see that the graph shows some clear trends. Some product improvements are helping—a little. The percentage of new customers who go on to use the product at least five times has grown from less than 5 percent to almost 20 percent. Yet despite this fourfold increase, the percentage of new customers who pay money for IMVU is stuck at around 1 percent. Think about that for a moment. After months and months of work, thousands of individual improvements, focus groups, design sessions, and usability tests, the percentage of new customers who subsequently pay money is exactly the same as it was at the onset even though many more customers are getting a chance to try the product. Thanks to the power of cohort analysis, we could not blame this failure on the legacy of previous customers
  • 9. who were resistant to change, external market conditions, or any other excuse. Each cohort represented an independent report card, and try as we might, we were getting straight C’s. This helped us realize we had a problem. I was in charge of the product development team, small though it was in those days, and shared with my cofounders the sense that the problem had to be with my team’s efforts. I worked harder, tried to focus on higher- and higher-quality features, and lost a lot of sleep. Our frustration grew. When I could think of nothing else to do, I was finally ready to turn to the last resort: talking to customers. Armed with our failure to make progress tuning our engine of growth, I was ready to ask the right questions. Before this failure, in the company’s earliest days, it was easy to talk to potential customers and come away convinced we were on the right track. In fact, when we would invite customers into the office for in-person interviews and usability tests, it was easy to dismiss negative feedback. If they didn’t want to use the product, I assumed they were not in our target market. “Fire that customer,” I’d say to the person responsible for recruiting for our tests. “Find me someone in our target demographic.” If the next customer was more positive, I would take it as confirmation that I was right in my targeting. If not, I’d fire another customer and try again. By contrast, once I had data in hand, my interactions with customers changed. Suddenly I had urgent questions that needed answering: Why aren’t customers responding to our product “improvements”? Why isn’t our hard work paying off? For example, we kept making it easier and easier for customers to use IMVU with their existing friends. Unfortunately, customers didn’t want to engage in that behavior. Making it easier to use was totally beside the point. Once we knew what to look for, genuine understanding came much faster. As was described in Chapter 3, this eventually led to a critically important pivot: away from an IM add-on used with existing friends and toward a stand-alone network one can use to make new friends. Suddenly, our worries about productivity vanished. Once our efforts were aligned with what
  • 10. customers really wanted, our experiments were much more likely to change their behavior for the better. This pattern would repeat time and again, from the days when we were making less than a thousand dollars in revenue per month all the way up to the time we were making millions. In fact, this is the sign of a successful pivot: the new experiments you run are overall more productive than the experiments you were running before. This is the pattern: poor quantitative results force us to declare failure and create the motivation, context, and space for more qualitative research. These investigations produce new ideas— new hypotheses—to be tested, leading to a possible pivot. Each pivot unlocks new opportunities for further experimentation, and the cycle repeats. Each time we repeat this simple rhythm: establish the baseline, tune the engine, and make a decision to pivot or persevere. OPTIMIZATION VERSUS LEARNING Engineers, designers, and marketers are all skilled at optimization. For example, direct marketers are experienced at split testing value propositions by sending a different offer to two similar groups of customers so that they can measure differences in the response rates of the two groups. Engineers, of course, are skilled at improving a product’s performance, just as designers are talented at making products easier to use. All these activities in a well-run traditional organization offer incremental benefit for incremental effort. As long as we are executing the plan well, hard work yields results. However, these tools for product improvement do not work the same way for startups. If you are building the wrong thing, optimizing the product or its marketing will not yield significant results. A startup has to measure progress against a high bar: evidence that a sustainable business can be built around its products or services. That’s a standard that can be assessed only if a startup has made clear, tangible predictions ahead of time. In the absence of those predictions, product and strategy decisions are far more difficult and time-consuming. I often see this in my consulting practice.
  • 11. I’ve been called in many times to help a startup that feels that its engineering team “isn’t working hard enough.” When I meet with those teams, there are always improvements to be made and I recommend them, but invariably the real problem is not a lack of development talent, energy, or effort. Cycle after cycle, the team is working hard, but the business is not seeing results. Managers trained in a traditional model draw the logical conclusion: our team is not working hard, not working effectively, or not working efficiently. Thus the downward cycle begins: the product development team valiantly tries to build a product according to the specifications it is receiving from the creative or business leadership. When good results are not forthcoming, business leaders assume that any discrepancy between what was planned and what was built is the cause and try to specify the next iteration in greater detail. As the specifications get more detailed, the planning process slows down, batch size increases, and feedback is delayed. If a board of directors or CFO is involved as a stakeholder, it doesn’t take long for personnel changes to follow. A few years ago, a team that sells products to large media companies invited me to help them as a consultant because they were concerned that their engineers were not working hard enough. However, the fault was not in the engineers; it was in the process the whole company was using to make decisions. They had customers but did not know them very well. They were deluged with feature requests from customers, the internal sales team, and the business leadership. Every new insight became an emergency that had to be addressed immediately. As a result, long-term projects were hampered by constant interruptions. Even worse, the team had no clear sense of whether any of the changes they were making mattered to customers. Despite the constant tuning and tweaking, the business results were consistently mediocre. Learning milestones prevent this negative spiral by emphasizing a more likely possibility: the company is executing—with discipline!—a plan that does not make sense. The innovation accounting framework makes it clear when the company is stuck
  • 12. and needs to change direction. In the example above, early in the company’s life, the product development team was incredibly productive because the company’s founders had identified a large unmet need in the target market. The initial product, while flawed, was popular with early adopters. Adding the major features that customers asked for seemed to work wonders, as the early adopters spread the word about the innovation far and wide. But unasked and unanswered were other lurking questions: Did the company have a working engine of growth? Was this early success related to the daily work of the product development team? In most cases, the answer was no; success was driven by decisions the team had made in the past. None of its current initiatives were having any impact. But this was obscured because the company’s gross metrics were all “up and to the right.” As we’ll see in a moment, this is a common danger. Companies of any size that have a working engine of growth can come to rely on the wrong kind of metrics to guide their actions. This is what tempts managers to resort to the usual bag of success theater tricks: last-minute ad buys, channel stuffing, and whiz- bang demos, in a desperate attempt to make the gross numbers look better. Energy invested in success theater is energy that could have been used to help build a sustainable business. I call the traditional numbers used to judge startups “vanity metrics,” and innovation accounting requires us to avoid the temptation to use them. VANITY METRICS: A WORD OF CAUTION To see the danger of vanity metrics clearly, let’s return once more to the early days of IMVU. Take a look at the following graph, which is from the same era in IMVU’s history as that shown earlier in this chapter. It covers the same time period as the cohort-style graph on this page; in fact, it is from the same board presentation. This graph shows the traditional gross metrics for IMVU so far: total registered users and total paying customers (the gross revenue graph looks almost the same). From this viewpoint, things look much more exciting. That’s why I call
  • 13. these vanity metrics: they give the rosiest possible picture. You’ll see a traditional hockey stick graph (the ideal in a rapid- growth company). As long as you focus on the top-line numbers (signing up more customers, an increase in overall revenue), you’ll be forgiven for thinking this product development team is making great progress. The company’s growth engine is working. Each month it is able to acquire customers and has a positive return on investment. The excess revenue from those customers is reinvested the next month in acquiring more. That’s where the growth is coming from. But think back to the same data presented in a cohort style. IMVU is adding new customers, but it is not improving the yield on each new group. The engine is turning, but the efforts to tune the engine are not bearing much fruit. From the traditional graph alone, you cannot tell whether IMVU is on pace to build a sustainable business; you certainly can’t tell anything about the efficacy of the entrepreneurial team behind it. Innovation accounting will not work if a startup is being misled by these kinds of vanity metrics: gross number of customers and so on. The alternative is the kind of metrics we use to judge our business and our learning milestones, what I call actionable metrics. ACTIONABLE METRICS VERSUS VANITY METRICS To get a better sense of the importance of good metrics, let’s look at a company called Grockit. Its founder, Farbood Nivi, spent a decade working as a teacher at two large for-profit education companies, Princeton Review and Kaplan, helping students prepare for standardized tests such as the GMAT, LSAT, and SAT. His engaging classroom style won accolades from his students and promotions from his superiors; he was honored with Princeton Review’s National Teacher of the Year award. But Farb was frustrated with the traditional teaching methods used by those companies. Teaching six to nine hours per day to thousands of students, he had many opportunities to experiment with new approaches.2 Over time, Farb concluded that the
  • 14. traditional lecture model of education, with its one-to-many instructional approach, was inadequate for his students. He set out to develop a superior approach, using a combination of teacher-led lectures, individual homework, and group study. In particular, Farb was fascinated by how effective the student-to- student peer-driven learning method was for his students. When students could help each other, they benefited in two ways. First, they could get customized instruction from a peer who was much less intimidating than a teacher. Second, they could reinforce their learning by teaching it to others. Over time, Farb’s classes became increasingly social—and successful. As this unfolded, Farb felt more and more that his physical presence in the classroom was less important. He made an important connection: “I have this social learning model in my classroom. There’s all this social stuff going on on the web.” His idea was to bring social peer-to-peer learning to people who could not afford an expensive class from Kaplan or Princeton Review or an even more expensive private tutor. From this insight Grockit was born. Farb explains, “Whether you’re studying for the SAT or you’re studying for algebra, you study in one of three ways. You spend some time with experts, you spend some time on your own, and you spend some time with your peers. Grockit offers these three same formats of studying. What we do is we apply technology and algorithms to optimize those three forms.” Farb is the classic entrepreneurial visionary. He recounts his original insight this way: “Let’s forget educational design up until now, let’s forget what’s possible and just redesign learning with today’s students and today’s technology in mind. There were plenty of multi-billion-dollar organizations in the education space, and I don’t think they were innovating in the way that we needed them to and I didn’t think we needed them anymore. To me, it’s really all about the students and I didn’t feel like the students were being served as well as they could.” Today Grockit offers many different educational products, but in the beginning Farb followed a lean approach. Grockit built a minimum viable product, which was
  • 15. simply Farb teaching test prep via the popular online web conferencing tool WebEx. He built no custom software, no new technology. He simply attempted to bring his new teaching approach to students via the Internet. News about a new kind of private tutoring spread quickly, and within a few months Farb was making a decent living teaching online, with monthly revenues of $10,000 to $15,000. But like many entrepreneurs with ambition, Farb didn’t build his MVP just to make a living. He had a vision of a more collaborative, more effective kind of teaching for students everywhere. With his initial traction, he was able to raise money from some of the most prestigious investors in Silicon Valley. When I first met Farb, his company was already on the fast track to success. They had raised venture capital from well-regarded investors, had built an awesome team, and were fresh off an impressive debut at one of Silicon Valley’s famous startup competitions. They were extremely process-oriented and disciplined. Their product development followed a rigorous version of the agile development methodology known as Extreme Programming (described below), thanks to their partnership with a San Francisco–based company called Pivotal Labs. Their early product was hailed by the press as a breakthrough. There was only one problem: they were not seeing sufficient growth in the use of the product by customers. Grockit is an excellent case study because its problems were not a matter of failure of execution or discipline. Following standard agile practice, Grockit’s work proceeded in a series of sprints, or one-month iteration cycles. For each sprint, Farb would prioritize the work to be done that month by writing a series of user stories, a technique taken from agile development. Instead of writing a specification for a new feature that described it in technical terms, Farb would write a story that described the feature from the point of view of the customer. That story helped keep the engineers focused on the customer’s perspective throughout the development process. Each feature was expressed in plain language in terms everyone could understand whether they had
  • 16. a technical background or not. Again following standard agile practice, Farb was free to reprioritize these stories at any time. As he learned more about what customers wanted, he could move things around in the product backlog, the queue of stories yet to be built. The only limit on this ability to change directions was that he could not interrupt any task that was in progress. Fortunately, the stories were written in such a way that the batch size of work (which I’ll discuss in more detail in Chapter 9) was only a day or two. This system is called agile development for a good reason: teams that employ it are able to change direction quickly, stay light on their feet, and be highly responsive to changes in the business requirements of the product owner (the manager of the process—in this case Farb— who is responsible for prioritizing the stories). How did the team feel at the end of each sprint? They consistently delivered new product features. They would collect feedback from customers in the form of anecdotes and interviews that indicated that at least some customers liked the new features. There was always a certain amount of data that showed improvement: perhaps the total number of customers was increasing, the total number of questions answered by students was going up, or the number of returning customers was increasing. However, I sensed that Farb and his team were left with lingering doubts about the company’s overall progress. Was the increase in their numbers actually caused by their development efforts? Or could it be due to other factors, such as mentions of Grockit in the press? When I met the team, I asked them this simple question: How do you know that the prioritization decisions that Farb is making actually make sense? Their answer: “That’s not our department. Farb makes the decisions; we execute them.” At that time Grockit was focused on just one customer segment: prospective business school students who were studying for the GMAT. The product allowed students to engage in online study sessions with fellow students who were studying for the same exam. The product was working: the students who completed their studying via Grockit achieved significantly higher scores
  • 17. than they had before. But the Grockit team was struggling with the age-old startup problems: How do we know which features to prioritize? How can we get more customers to sign up and pay? How can we get out the word about our product? I put this question to Farb: “How confident are you that you are making the right decisions in terms of establishing priorities?” Like most startup founders, he was looking at the available data and making the best educated guesses he could. But this left a lot of room for ambiguity and doubt. Farb believed in his vision thoroughly and completely, yet he was starting to question whether his company was on pace to realize that vision. The product improved every day, but Farb wanted to make sure those improvements mattered to customers. I believe he deserves a lot of credit for realizing this. Unlike many visionaries, who cling to their original vision no matter what, Farb was willing to put his vision to the test. Farb worked hard to sustain his team’s belief that Grockit was destined for success. He was worried that morale would suffer if anyone thought that the person steering the ship was uncertain about which direction to go. Farb himself wasn’t sure if his team would embrace a true learning culture. After all, this was part of the grand bargain of agile development: engineers agree to adapt the product to the business’s constantly changing requirements but are not responsible for the quality of those business decisions. Agile is an efficient system of development from the point of view of the developers. It allows them to stay focused on creating features and technical designs. An attempt to introduce the need to learn into that process could undermine productivity. (Lean manufacturing faced similar problems when it was introduced in factories. Managers were used to focusing on the utilization rate of each machine. Factories were designed to keep machines running at full capacity as much of the time as possible. Viewed from the perspective of the machine, that is efficient, but from the point of view of the productivity of the entire factory, it is wildly inefficient at times. As they say in systems theory, that which optimizes one part of the system
  • 18. necessarily undermines the system as a whole.) What Farb and his team didn’t realize was that Grockit’s progress was being measured by vanity metrics: the total number of customers and the total number of questions answered. That was what was causing his team to spin its wheels; those metrics gave the team the sensation of forward motion even though the company was making little progress. What’s interesting is how closely Farb’s method followed superficial aspects of the Lean Startup learning milestones: they shipped an early product and established some baseline metrics. They had relatively short iterations, each of which was judged by its ability to improve customer metrics. However, because Grockit was using the wrong kinds of metrics, the startup was not genuinely improving. Farb was frustrated in his efforts to learn from customer feedback. In every cycle, the type of metrics his team was focused on would change: one month they would look at gross usage numbers, another month registration numbers, and so on. Those metrics would go up and down seemingly on their own. He couldn’t draw clear cause-and-effect inferences. Prioritizing work correctly in such an environment is extremely challenging. Farb could have asked his data analyst to investigate a particular question. For example, when we shipped feature X, did it affect customer behavior? But that would have required tremendous time and effort. When, exactly, did feature X ship? Which customers were exposed to it? Was anything else launched around that same time? Were there seasonal factors that might be skewing the data? Finding these answers would have required parsing reams and reams of data. The answer often would come weeks after the question had been asked. In the meantime, the team would have moved on to new priorities and new questions that needed urgent attention. Compared to a lot of startups, the Grockit team had a huge advantage: they were tremendously disciplined. A disciplined team may apply the wrong methodology but can shift gears quickly once it discovers its error. Most important, a disciplined team can experiment with its own working style and draw meaningful
  • 19. conclusions. Cohorts and Split-tests Grockit changed the metrics they used to evaluate success in two ways. Instead of looking at gross metrics, Grockit switched to cohort-based metrics, and instead of looking for cause-and-effect relationships after the fact, Grockit would launch each new feature as a true split-test experiment. A split-test experiment is one in which different versions of a product are offered to customers at the same time. By observing the changes in behavior between the two groups, one can make inferences about the impact of the different variations. This technique was pioneered by direct mail advertisers. For example, consider a company that sends customers a catalog of products to buy, such as Lands’ End or Crate & Barrel. If you wanted to test a catalog design, you could send a new version of it to 50 percent of the customers and send the old standard catalog to the other 50 percent. To assure a scientific result, both catalogs would contain identical products; the only difference would be the changes to the design. To figure out if the new design was effective, all you would have to do was keep track of the sales figures for both groups of customers. (This technique is sometimes called A/B testing after the practice of assigning letter names to each variation.) Although split testing often is thought of as a marketing-specific (or even a direct marketing–specific) practice, Lean Startups incorporate it directly into product development. These changes led to an immediate change in Farb’s understanding of the business. Split testing often uncovers surprising things. For example, many features that make the product better in the eyes of engineers and designers have no impact on customer behavior. This was the case at Grockit, as it has been in every company I have seen adopt this technique. Although working with split tests seems to be more difficult because it requires extra accounting and metrics to keep track of each variation, it almost always saves tremendous amounts of time in the long run by eliminating work that doesn’t matter to customers. Split testing also helps teams
  • 20. refine their understanding of what customers want and don’t want. Grockit’s team constantly added new ways for their customers to interact with each other in the hope that those social communication tools would increase the product’s value. Inherent in those efforts was the belief that customers desired more communication during their studying. When split testing revealed that the extra features did not change customer behavior, it called that belief into question. The questioning inspired the team to seek a deeper understanding of what customers really wanted. They brainstormed new ideas for product experiments that might have more impact. In fact, many of these ideas were not new. They had simply been overlooked because the company was focused on building social tools. As a result, Grockit tested an intensive solo-studying mode, complete with quests and gamelike levels, so that students could have the choice of studying by themselves or with others. Just as in Farb’s original classroom, this proved extremely effective. Without the discipline of split testing, the company might not have had this realization. In fact, over time, through dozens of tests, it became clear that the key to student engagement was to offer them a combination of social and solo features. Students preferred having a choice of how to study. Kanban Following the lean manufacturing principle of kanban, or capacity constraint, Grockit changed the product prioritization process. Under the new system, user stories were not considered complete until they led to validated learning. Thus, stories could be cataloged as being in one of four states of development: in the product backlog, actively being built, done (feature complete from a technical point of view), or in the process of being validated. Validated was defined as “knowing whether the story was a good idea to have been done in the first place.” This validation usually would come in the form of a split test showing a change in customer behavior but also might include customer interviews or surveys. The kanban rule permitted only so many stories in each of the four states. As stories flow from one state to the other, the buckets fill up.
  • 21. Once a bucket becomes full, it cannot accept more stories. Only when a story has been validated can it be removed from the kanban board. If the validation fails and it turns out the story is a bad idea, the relevant feature is removed from the product (see the chart on this page). B and C have been built, but under kanban, cannot be moved to the next bucket for validation until A, D, E have been validated. Work cannot begin on H and I until space opens up in the buckets ahead. I have implemented this system with several teams, and the initial result is always frustrating: each bucket fills up, starting with the “validated” bucket and moving on to the “done” bucket, until it’s not possible to start any more work. Teams that are used to measuring their productivity narrowly, by the number of stories they are delivering, feel stuck. The only way to start work on new features is to investigate some of the stories that are done but haven’t been validated. That often requires nonengineering efforts: talking to customers, looking at split-test data, and the like. Pretty soon everyone gets the hang of it. This progress occurs in fits and starts at first. Engineering may finish a big batch of work, followed by extensive testing and validation. As engineers look for ways to increase their productivity, they start to realize that if they include the validation exercise from the beginning, the whole team can be more productive. For example, why build a new feature that is not part of a split-test experiment? It may save you time in the short run, but it will take more time later to test, during the validation phase. The same logic applies to a story that an engineer doesn’t understand. Under the old system, he or she would just build it and find out later what it was for. In the new system, that behavior is clearly counterproductive: without a clear hypothesis, how can a story ever be validated? We saw this behavior at IMVU, too. I once saw a junior
  • 22. engineer face down a senior executive over a relatively minor change. The engineer insisted that the new feature be split- tested, just like any other. His peers backed him up; it was considered absolutely obvious that all features should be routinely tested, no matter who was commissioning them. (Embarrassingly, all too often I was the executive in question.) A solid process lays the foundation for a healthy culture, one where ideas are evaluated by merit and not by job title. Most important, teams working in this system begin to measure their productivity according to validated learning, not in terms of the production of new features. Hypothesis Testing at Grockit When Grockit made this transition, the results were dramatic. In one case, they decided to test one of their major features, called lazy registration, to see if it was worth the heavy investment they were making in ongoing support. They were confident in this feature because lazy registration is considered one of the design best practices for online services. In this system, customers do not have to register for the service up front. Instead, they immediately begin using the service and are asked to register only after they have had a chance to experience the service’s benefit. For a student, lazy registration works like this: when you come to the Grockit website, you’re immediately placed in a study session with other students working on the same test. You don’t have to give your name, e-mail address, or credit card number. There is nothing to prevent you from jumping in and getting started immediately. For Grockit, this was essential to testing one of its core assumptions: that customers would be willing to adopt this new way of learning only if they could see proof that it was working early on. As a result of this hypothesis, Grockit’s design required that it manage three classes of users: unregistered guests, registered (trial) guests, and customers who had paid for the premium version of the product. This design required significant extra work to build and maintain: the more classes of users there are, the more work is required to keep track of them, and the more
  • 23. marketing effort is required to create the right incentives to entice customers to upgrade to the next class. Grockit had undertaken this extra effort because lazy registration was considered an industry best practice. I encouraged the team to try a simple split-test. They took one cohort of customers and required that they register immediately, based on nothing more than Grockit’s marketing materials. To their surprise, this cohort’s behavior was exactly the same as that of the lazy registration group: they had the same rate of registration, activation, and subsequent retention. In other words, the extra effort of lazy registration was a complete waste even though it was considered an industry best practice. Even more important than reducing waste was the insight that this test suggested: customers were basing their decision about Grockit on something other than their use of the product. Think about this. Think about the cohort of customers who were required to register for the product before entering a study session with other students. They had very little information about the product, nothing more than was presented on Grockit’s home page and registration page. By contrast, the lazy registration group had a tremendous amount of information about the product because they had used it. Yet despite this information disparity, customer behavior was exactly the same. This suggested that improving Grockit’s positioning and marketing might have a more significant impact on attracting new customers than would adding new features. This was just the first of many important experiments Grockit was able to run. Since those early days, they have expanded their customer base dramatically: they now offer test prep for numerous standardized tests, including the GMAT, SAT, ACT, and GRE, as well as online math and English courses for students in grades 7 through 12. Grockit continues to evolve its process, seeking continuous improvement at every turn. With more than twenty employees in its San Francisco office, Grockit continues to operate with the same deliberate, disciplined approach that has been their hallmark all along. They have helped close to a
  • 24. million students and are sure to help millions more. Remove this instructional/explanatory text before submitting assignment. Use this slide (or create 1-4 additional slides) to explain LEAN STARTUP Chapter 7 and the concept of MEASURE. This is NOT a data dump, so do NOT fill these slides with an
  • 25. overload of data. Your job is to sift through what may seem like an infinite pool of data and facts (and opinions), and select the most critical information to succinctly answer the question. Think of it this way, you are summarizing this to demonstrate that you carefully reviewed the videos assigned this week and thought about this key question; and you are summarizing this for someone who has very little time to read your summary. So your summary must be succinct and you must get to the point (IMPORTANT: you must have a point – an intended message/insight). Your summary must be meaningful, thoughtful, and insightful – rather than simply a bunch of information. Based on copyrighted materials - Michael D. Meeks - 2010 4. Describe Chapter 7 of LEAN STARTUP. What does the author mean by MEASURE? Do you agree? Why? Instructions 2