Power Plant Performance Monitoring and Trend Analysis

This is a specially designed software for Power Station Performance Monitoring and Trend Analysis. It not only tracks and draws trends of overall plant performance but also capable of monitoring individual generating units performance. In this brochure we have customized this software for an engine based power station but it can be customized for other types of production facilities where continuous monitoring of Key Performance Indicators are required. It can be an ideal tool for any manufacturing industries where multiple generating units are engaged on common task. From overall performance analysis report we know the overall productivity but we cannot detect the defective generating units or those units which are less productive for a long period. By trending individual units productivity we can segregate those units and take necessary measures to improve their performance. This software would be the best solution to manage your operational data. Web based accessibility will let you access the software and monitor the performance more closely even while you are abroad.

Recommandé
Recommandé
Contenu connexe
Tendances
Tendances (20)
En vedette
En vedette (20)
Similaire à Power Plant Performance Monitoring and Trend Analysis
Similaire à Power Plant Performance Monitoring and Trend Analysis (20)
Dernier
Dernier (20)
Power Plant Performance Monitoring and Trend Analysis
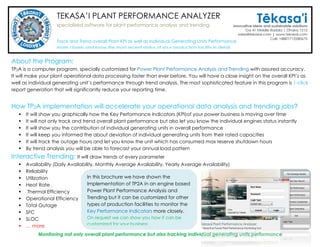
- 1. TEKASA’I PLANT PERFORMANCE ANALYZER specialized software for plant performance analysis and trending About the Program: TP2A is a computer program, specially customized for Power Plant Performance Analysis and Trending with assured accuracy. We believe, it will assist you to manage/process your plant operational data faster than ever before. You will have a close insight not only on the overall plant KPI’s but also on individual generating unit’s performance. Through its interactive trending system you will be able to visualize the performance of overall plant as well as existing performance of individual gen-sets graphically. The sophisticated report generator will let you generate all reports almost instantaneously with progressive trends. How TP2A implementation will accelerate your operational data analysis and trending jobs? You will be able to see in which directions the Overall Key Performance Indicators (KPI) are moving over time You will not only be able to track overall plant performance but also will be able visualize individual engines performance You will be able to determine the contribution of individual generating units on overall plant performance From Trend Analysis you will be able to determine the deviation of generating units from their rated capacities It will track the outage hours and let you know the unit which has consumed max reserve shutdown hours From Trend Analysis you will be able to forecast your annual load pattern and schedule outage periods accordingly Interactive Trending: It will draw trends of every parameter Availability (Daily Availability, Monthly Average Availability, Yearly Average Availability) Reliability Utilization Heat Rate Thermal Efficiency Operational Efficiency Total Outage SFC SLOC … more Monitoring not only overall plant performance but also tracking individual generating units performance In this brochure we have shown the Implementation of TP2A in an engine based Power Plant Performance Analysis and Trending but it can be customized for other types of production facilities to monitor the Key Performance Indicators more closely. On request we can show you how it can be customized for your business Tracks and draws Trends of overall Plant KPI as well as individual engines KPI’s more accurately and keeps you informed about the up-to-date performance of your production facility in detail
- 2. What TP2A Will Do? Noon to Noon Input Parameters Equipments Running Hours Energy Meter Readings Scheduled Outage Hours Forced Outage Hours Fuel Consumption Lube Oil Consumption Net Calorific Value of Fuel Main Billing Meter Readings TP2A Program Output Parameters Plant Load Factor Gross Generation Net Generation Net Electrical Output Station Load Average Plant Load Availability Reliability Utilization Heat Rate Thermal Efficiency Operational Efficiency Total Outage SFC SLOC CO2 Emission
- 3. TP2A WORKING PROCEDURE Noon 2 Noon Data Entry by Shift Charge Engineer / OM UPLOAD DOWNLOAD Managing DirectorPlant Manager TP2A REPORT GENERATION MODULE Generate Yearly Report Generate Monthly Report Generate Daily Report Other Reports TP2A PLANT PERFORMANCE MONITORINGTP2A PROGRAM INSTALLED AT PLANT PC MAIN DATABASE AT PLANT PC Saving calculated data TP2A ENGINE PERFORMANCE MONITORING TP2A ENGINE PERFORMANCE COMPARISON TP2A FILE EXCHANGE MODULE For overall plant and Individual Engines Plant Load Factor Gross & Net Generation Net Electrical Output Station Load Average Plant Load Availability Reliability Utilization Heat Rate Thermal Efficiency Operational Efficiency Total Outage SFC SLOC CO2 Emission Engine to Engine Performance Comparison and Analysis DATABASE IN WEB SERVER Operation Manager Results Engineer DOWNLOAD TP2A AT REMOTE PC-1 Database in Remote PC TP2A AT REMOTE PC-2 Database in Remote PC TP2A AT REMOTE PC-3 Database in Remote PC TP2A AT REMOTE PC-4 Database in Remote PC ALL USERS WILL SEE THE MOST UPDATED STATUS OF THE OVERALL PLANT AS WELL AS INDIVIDUAL ENGINES Noon to Noon Input Parameters Equipments Running Hours Energy Meter Readings Scheduled Outage Hours Forced Outage Hours Fuel Consumption Lube Oil Consumption Net Calorific Value of Fuel Main Billing Meter Readings PLANT and more
- 4. TP2A FOR ENGINE TO ENGINE PERFORMANCE COMPARISON Compare Engine to Engine performance data and identify their individual contribution to overall plant performance
- 5. Trending System lets you review the plant performance graphically from the beginning…. Just click and See! Similarly the program will automatically generate trends with Monthly Average and Yearly Average data. You will only need to click on the buttons to explore your overall plant as well as your individual engines performance TP2A FOR AUTOMATIC SCROLLABLE TRENDING
- 6. The program will also track the performance of your individual engine performance in detail. You will be able to review your engines performance one by one simply clicking on designated buttons TP2A FOR ANALYZING ENGINE BY ENGINE PERFORMANCE TP2A FOR TRENDING ENGINE BY ENGINE PERFORMANCE
- 7. TP2A WILL GENERATE DAILY, WEEKLY, MONTHLY AND YEARLY REPORTS INSTANTANEOUSLY The report generation module will unbelievably simplify your reporting activities. Just Select the date range and generate your desired report without any time delay!
- 8. Sample: Generated Monthly Report with Trends (Reports will be generated in pdf format)