6. 27
Switzerland
EUROPE
$3.2B
$1.96B $1B
$3.5B
NORTH AMERICA
$12B Valuation
$1.8B
$3.1B$3.2B
$1B
$1B
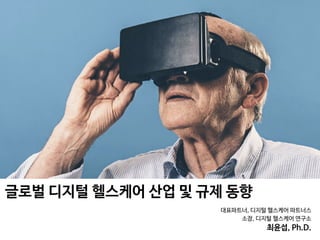
38 healthcare unicorns valued at $90.7B
Global VC-backed digital health companies with a private market valuation of $1B+ (7/26/19)
UNITED KINGDOM
$1.5B
MIDDLE EAST
$1B Valuation
ISRAEL
$7B
$1B$1.2B
$1B
$1.65B
$1.8B
$1.25B
$2.8B
$1B $1B
$2B Valuation
$1.5B
UNITED STATES
GERMANY
$1.7B
$2.5B
CHINA
ASIA
$3B
$5.5B Valuation
$5B
$2.4B
$2.4B
France
$1.1B $3.5B
$1.6B
$1B
$1B
$1B
$1B
CB Insights, Global Healthcare Reports 2019 2Q
•전 세계적으로 38개의 디지털 헬스케어 유니콘 스타트업 (=기업가치 $1B 이상) 이 있으나,
•국내에는 하나도 없음
7. 헬스케어
넓은 의미의 건강 관리에는 해당되지만,
디지털 기술이 적용되지 않고, 전문 의료 영역도 아닌 것
예) 운동, 영양, 수면
디지털 헬스케어
건강 관리 중에 디지털 기술이 사용되는 것
예) 사물인터넷, 인공지능, 3D 프린터, VR/AR
모바일 헬스케어
디지털 헬스케어 중
모바일 기술이 사용되는 것
예) 스마트폰, 사물인터넷, SNS
개인 유전정보분석
암유전체, 질병위험도,
보인자, 약물 민감도
예) 웰니스, 조상 분석
헬스케어 관련 분야 구성도(ver 0.6)
의료
질병 예방, 치료, 처방, 관리
등 전문 의료 영역
원격의료
원격 환자 모니터링
원격진료
전화, 화상, 판독
디지털 치료제
당뇨 예방 앱
중독 치료 앱
ADHD 치료게임
14. •복잡한 의료 데이터의 분석 및 insight 도출
•영상 의료/병리 데이터의 분석/판독
•연속 데이터의 모니터링 및 예방/예측
의료 인공지능의 세 유형
15. •복잡한 의료 데이터의 분석 및 insight 도출
•영상 의료/병리 데이터의 분석/판독
•연속 데이터의 모니터링 및 예방/예측
의료 인공지능의 세 유형
16.
17. ARTICLE OPEN
Scalable and accurate deep learning with electronic health
records
Alvin Rajkomar 1,2
, Eyal Oren1
, Kai Chen1
, Andrew M. Dai1
, Nissan Hajaj1
, Michaela Hardt1
, Peter J. Liu1
, Xiaobing Liu1
, Jake Marcus1
,
Mimi Sun1
, Patrik Sundberg1
, Hector Yee1
, Kun Zhang1
, Yi Zhang1
, Gerardo Flores1
, Gavin E. Duggan1
, Jamie Irvine1
, Quoc Le1
,
Kurt Litsch1
, Alexander Mossin1
, Justin Tansuwan1
, De Wang1
, James Wexler1
, Jimbo Wilson1
, Dana Ludwig2
, Samuel L. Volchenboum3
,
Katherine Chou1
, Michael Pearson1
, Srinivasan Madabushi1
, Nigam H. Shah4
, Atul J. Butte2
, Michael D. Howell1
, Claire Cui1
,
Greg S. Corrado1
and Jeffrey Dean1
Predictive modeling with electronic health record (EHR) data is anticipated to drive personalized medicine and improve healthcare
quality. Constructing predictive statistical models typically requires extraction of curated predictor variables from normalized EHR
data, a labor-intensive process that discards the vast majority of information in each patient’s record. We propose a representation
of patients’ entire raw EHR records based on the Fast Healthcare Interoperability Resources (FHIR) format. We demonstrate that
deep learning methods using this representation are capable of accurately predicting multiple medical events from multiple
centers without site-specific data harmonization. We validated our approach using de-identified EHR data from two US academic
medical centers with 216,221 adult patients hospitalized for at least 24 h. In the sequential format we propose, this volume of EHR
data unrolled into a total of 46,864,534,945 data points, including clinical notes. Deep learning models achieved high accuracy for
tasks such as predicting: in-hospital mortality (area under the receiver operator curve [AUROC] across sites 0.93–0.94), 30-day
unplanned readmission (AUROC 0.75–0.76), prolonged length of stay (AUROC 0.85–0.86), and all of a patient’s final discharge
diagnoses (frequency-weighted AUROC 0.90). These models outperformed traditional, clinically-used predictive models in all cases.
We believe that this approach can be used to create accurate and scalable predictions for a variety of clinical scenarios. In a case
study of a particular prediction, we demonstrate that neural networks can be used to identify relevant information from the
patient’s chart.
npj Digital Medicine (2018)1:18 ; doi:10.1038/s41746-018-0029-1
INTRODUCTION
The promise of digital medicine stems in part from the hope that,
by digitizing health data, we might more easily leverage computer
information systems to understand and improve care. In fact,
routinely collected patient healthcare data are now approaching
the genomic scale in volume and complexity.1
Unfortunately,
most of this information is not yet used in the sorts of predictive
statistical models clinicians might use to improve care delivery. It
is widely suspected that use of such efforts, if successful, could
provide major benefits not only for patient safety and quality but
also in reducing healthcare costs.2–6
In spite of the richness and potential of available data, scaling
the development of predictive models is difficult because, for
traditional predictive modeling techniques, each outcome to be
predicted requires the creation of a custom dataset with specific
variables.7
It is widely held that 80% of the effort in an analytic
model is preprocessing, merging, customizing, and cleaning
nurses, and other providers are included. Traditional modeling
approaches have dealt with this complexity simply by choosing a
very limited number of commonly collected variables to consider.7
This is problematic because the resulting models may produce
imprecise predictions: false-positive predictions can overwhelm
physicians, nurses, and other providers with false alarms and
concomitant alert fatigue,10
which the Joint Commission identified
as a national patient safety priority in 2014.11
False-negative
predictions can miss significant numbers of clinically important
events, leading to poor clinical outcomes.11,12
Incorporating the
entire EHR, including clinicians’ free-text notes, offers some hope
of overcoming these shortcomings but is unwieldy for most
predictive modeling techniques.
Recent developments in deep learning and artificial neural
networks may allow us to address many of these challenges and
unlock the information in the EHR. Deep learning emerged as the
preferred machine learning approach in machine perception
www.nature.com/npjdigitalmed
•2018년 1월 구글이 전자의무기록(EMR)을 분석하여, 환자 치료 결과를 예측하는 인공지능 발표
•환자가 입원 중에 사망할 것인지
•장기간 입원할 것인지
•퇴원 후에 30일 내에 재입원할 것인지
•퇴원 시의 진단명
•이번 연구의 특징: 확장성
•과거 다른 연구와 달리 EMR의 일부 데이터를 pre-processing 하지 않고,
•전체 EMR 를 통채로 모두 분석하였음: UCSF, UCM (시카고 대학병원)
•특히, 비정형 데이터인 의사의 진료 노트도 분석
18. LETTERS
https://doi.org/10.1038/s41591-018-0335-9
1
Guangzhou Women and Children’s Medical Center, Guangzhou Medical University, Guangzhou, China. 2
Institute for Genomic Medicine, Institute of
Engineering in Medicine, and Shiley Eye Institute, University of California, San Diego, La Jolla, CA, USA. 3
Hangzhou YITU Healthcare Technology Co. Ltd,
Hangzhou, China. 4
Department of Thoracic Surgery/Oncology, First Affiliated Hospital of Guangzhou Medical University, China State Key Laboratory and
National Clinical Research Center for Respiratory Disease, Guangzhou, China. 5
Guangzhou Kangrui Co. Ltd, Guangzhou, China. 6
Guangzhou Regenerative
Medicine and Health Guangdong Laboratory, Guangzhou, China. 7
Veterans Administration Healthcare System, San Diego, CA, USA. 8
These authors contributed
equally: Huiying Liang, Brian Tsui, Hao Ni, Carolina C. S. Valentim, Sally L. Baxter, Guangjian Liu. *e-mail: kang.zhang@gmail.com; xiahumin@hotmail.com
Artificial intelligence (AI)-based methods have emerged as
powerful tools to transform medical care. Although machine
learning classifiers (MLCs) have already demonstrated strong
performance in image-based diagnoses, analysis of diverse
and massive electronic health record (EHR) data remains chal-
lenging. Here, we show that MLCs can query EHRs in a manner
similar to the hypothetico-deductive reasoning used by physi-
cians and unearth associations that previous statistical meth-
ods have not found. Our model applies an automated natural
language processing system using deep learning techniques
to extract clinically relevant information from EHRs. In total,
101.6 million data points from 1,362,559 pediatric patient
visits presenting to a major referral center were analyzed to
train and validate the framework. Our model demonstrates
high diagnostic accuracy across multiple organ systems and is
comparable to experienced pediatricians in diagnosing com-
mon childhood diseases. Our study provides a proof of con-
cept for implementing an AI-based system as a means to aid
physiciansintacklinglargeamountsofdata,augmentingdiag-
nostic evaluations, and to provide clinical decision support in
cases of diagnostic uncertainty or complexity. Although this
impact may be most evident in areas where healthcare provid-
ers are in relative shortage, the benefits of such an AI system
are likely to be universal.
Medical information has become increasingly complex over
time. The range of disease entities, diagnostic testing and biomark-
ers, and treatment modalities has increased exponentially in recent
years. Subsequently, clinical decision-making has also become more
complex and demands the synthesis of decisions from assessment
of large volumes of data representing clinical information. In the
current digital age, the electronic health record (EHR) represents a
massive repository of electronic data points representing a diverse
array of clinical information1–3
. Artificial intelligence (AI) methods
have emerged as potentially powerful tools to mine EHR data to aid
in disease diagnosis and management, mimicking and perhaps even
augmenting the clinical decision-making of human physicians1
.
To formulate a diagnosis for any given patient, physicians fre-
quently use hypotheticodeductive reasoning. Starting with the chief
complaint, the physician then asks appropriately targeted questions
relating to that complaint. From this initial small feature set, the
physician forms a differential diagnosis and decides what features
(historical questions, physical exam findings, laboratory testing,
and/or imaging studies) to obtain next in order to rule in or rule
out the diagnoses in the differential diagnosis set. The most use-
ful features are identified, such that when the probability of one of
the diagnoses reaches a predetermined level of acceptability, the
process is stopped, and the diagnosis is accepted. It may be pos-
sible to achieve an acceptable level of certainty of the diagnosis with
only a few features without having to process the entire feature set.
Therefore, the physician can be considered a classifier of sorts.
In this study, we designed an AI-based system using machine
learning to extract clinically relevant features from EHR notes to
mimic the clinical reasoning of human physicians. In medicine,
machine learning methods have already demonstrated strong per-
formance in image-based diagnoses, notably in radiology2
, derma-
tology4
, and ophthalmology5–8
, but analysis of EHR data presents
a number of difficult challenges. These challenges include the vast
quantity of data, high dimensionality, data sparsity, and deviations
Evaluation and accurate diagnoses of pediatric
diseases using artificial intelligence
Huiying Liang1,8
, Brian Y. Tsui 2,8
, Hao Ni3,8
, Carolina C. S. Valentim4,8
, Sally L. Baxter 2,8
,
Guangjian Liu1,8
, Wenjia Cai 2
, Daniel S. Kermany1,2
, Xin Sun1
, Jiancong Chen2
, Liya He1
, Jie Zhu1
,
Pin Tian2
, Hua Shao2
, Lianghong Zheng5,6
, Rui Hou5,6
, Sierra Hewett1,2
, Gen Li1,2
, Ping Liang3
,
Xuan Zang3
, Zhiqi Zhang3
, Liyan Pan1
, Huimin Cai5,6
, Rujuan Ling1
, Shuhua Li1
, Yongwang Cui1
,
Shusheng Tang1
, Hong Ye1
, Xiaoyan Huang1
, Waner He1
, Wenqing Liang1
, Qing Zhang1
, Jianmin Jiang1
,
Wei Yu1
, Jianqun Gao1
, Wanxing Ou1
, Yingmin Deng1
, Qiaozhen Hou1
, Bei Wang1
, Cuichan Yao1
,
Yan Liang1
, Shu Zhang1
, Yaou Duan2
, Runze Zhang2
, Sarah Gibson2
, Charlotte L. Zhang2
, Oulan Li2
,
Edward D. Zhang2
, Gabriel Karin2
, Nathan Nguyen2
, Xiaokang Wu1,2
, Cindy Wen2
, Jie Xu2
, Wenqin Xu2
,
Bochu Wang2
, Winston Wang2
, Jing Li1,2
, Bianca Pizzato2
, Caroline Bao2
, Daoman Xiang1
, Wanting He1,2
,
Suiqin He2
, Yugui Zhou1,2
, Weldon Haw2,7
, Michael Goldbaum2
, Adriana Tremoulet2
, Chun-Nan Hsu 2
,
Hannah Carter2
, Long Zhu3
, Kang Zhang 1,2,7
* and Huimin Xia 1
*
NATURE MEDICINE | www.nature.com/naturemedicine
LETTERSNATURE MEDICINE
examination, laboratory testing, and PACS (picture archiving and
communication systems) reports), the F1 scores exceeded 90%
except in one instance, which was for categorical variables detected
tree, similar to how a human physician might evaluate a patient’s
features to achieve a diagnosis based on the same clinical data
incorporated into the information model. Encounters labeled by
Systemic generalized diseases
Varicella without complication
Influenza
Infectious mononucleosis
Sepsis
Exanthema subitum
Neuropsychiatric diseases
Tic disorder
Attention-deficit hyperactivity disorders
Bacterial meningitis
Encephalitis
Convulsions
Genitourinary diseases
Respiratory diseases
Upper respiratory
diseases
Acute upper respiratory infection
Sinusitis
Acute sinusitis
Acute recurrent sinusitis
Acute laryngitis
Acute pharyngitis
Lower respiratory
diseases
Bronchitis
Acute bronchitis
Bronchiolitis
Acute bronchitis due to Mycoplasma pneumoniae
Pneumonia
Bacterial pneumonia
Bronchopneumonia
Bacterial pneumonia elsewhere
Mycoplasma infection
Asthma
Asthma uncomplicated
Cough variant asthma
Asthma with acute exacerbation
Acute tracheitis
Gastrointestinal diseases
Diarrhea
Mouth-related diseases
Enteroviral vesicular stomatitis
with exanthem
Fig. 2 | Hierarchy of the diagnostic framework in a large pediatric cohort. A hierarchical logistic regression classifier was used to establish a diagnostic
system based on anatomic divisions. An organ-based approach was used, wherein diagnoses were first separated into broad organ systems, then
subsequently divided into organ subsystems and/or into more specific diagnosis groups.
•소아 환자 130만 명의 EMR 데이터 101.6 million 개 분석
•딥러닝 기반의 자연어 처리 기술
•의사의 hypothetico-deductive reasoning 모방
•소아 환자의 common disease를 진단하는 인공지능
Nat Med 2019 Feb
19. GP at Hand
•영국 바빌론헬스의 GP at Hand
•챗봇 기반의 질병 진단 + 원격 진료
•영국 NHS 에서 활용 중
22. Digital Phenotype:
Your smartphone knows if you are depressed
J Med Internet Res. 2015 Jul 15;17(7):e175.
The correlation analysis between the features and the PHQ-9 scores revealed that 6 of the 10
features were significantly correlated to the scores:
• strong correlation: circadian movement, normalized entropy, location variance
• correlation: phone usage features, usage duration and usage frequency
23. Mindstrong Health
• 스마트폰 사용 패턴을 바탕으로
• 인지능력, 우울증, 조현병, 양극성 장애, PTSD 등을 측정
• 미국 국립정신건강연구소 소장인 Tomas Insel 이 공동 설립
• 아마존의 제프 베조스 투자
24. BRIEF COMMUNICATION OPEN
Digital biomarkers of cognitive function
Paul Dagum1
To identify digital biomarkers associated with cognitive function, we analyzed human–computer interaction from 7 days of
smartphone use in 27 subjects (ages 18–34) who received a gold standard neuropsychological assessment. For several
neuropsychological constructs (working memory, memory, executive function, language, and intelligence), we found a family of
digital biomarkers that predicted test scores with high correlations (p 10−4
). These preliminary results suggest that passive
measures from smartphone use could be a continuous ecological surrogate for laboratory-based neuropsychological assessment.
npj Digital Medicine (2018)1:10 ; doi:10.1038/s41746-018-0018-4
INTRODUCTION
By comparison to the functional metrics available in other
disciplines, conventional measures of neuropsychiatric disorders
have several challenges. First, they are obtrusive, requiring a
subject to break from their normal routine, dedicating time and
often travel. Second, they are not ecological and require subjects
to perform a task outside of the context of everyday behavior.
Third, they are episodic and provide sparse snapshots of a patient
only at the time of the assessment. Lastly, they are poorly scalable,
taxing limited resources including space and trained staff.
In seeking objective and ecological measures of cognition, we
attempted to develop a method to measure memory and
executive function not in the laboratory but in the moment,
day-to-day. We used human–computer interaction on smart-
phones to identify digital biomarkers that were correlated with
neuropsychological performance.
RESULTS
In 2014, 27 participants (ages 27.1 ± 4.4 years, education
14.1 ± 2.3 years, M:F 8:19) volunteered for neuropsychological
assessment and a test of the smartphone app. Smartphone
human–computer interaction data from the 7 days following
the neuropsychological assessment showed a range of correla-
tions with the cognitive scores. Table 1 shows the correlation
between each neurocognitive test and the cross-validated
predictions of the supervised kernel PCA constructed from
the biomarkers for that test. Figure 1 shows each participant
test score and the digital biomarker prediction for (a) digits
backward, (b) symbol digit modality, (c) animal fluency,
(d) Wechsler Memory Scale-3rd Edition (WMS-III) logical
memory (delayed free recall), (e) brief visuospatial memory test
(delayed free recall), and (f) Wechsler Adult Intelligence Scale-
4th Edition (WAIS-IV) block design. Construct validity of the
predictions was determined using pattern matching that
computed a correlation of 0.87 with p 10−59
between the
covariance matrix of the predictions and the covariance matrix
of the tests.
Table 1. Fourteen neurocognitive assessments covering five cognitive
domains and dexterity were performed by a neuropsychologist.
Shown are the group mean and standard deviation, range of score,
and the correlation between each test and the cross-validated
prediction constructed from the digital biomarkers for that test
Cognitive predictions
Mean (SD) Range R (predicted),
p-value
Working memory
Digits forward 10.9 (2.7) 7–15 0.71 ± 0.10, 10−4
Digits backward 8.3 (2.7) 4–14 0.75 ± 0.08, 10−5
Executive function
Trail A 23.0 (7.6) 12–39 0.70 ± 0.10, 10−4
Trail B 53.3 (13.1) 37–88 0.82 ± 0.06, 10−6
Symbol digit modality 55.8 (7.7) 43–67 0.70 ± 0.10, 10−4
Language
Animal fluency 22.5 (3.8) 15–30 0.67 ± 0.11, 10−4
FAS phonemic fluency 42 (7.1) 27–52 0.63 ± 0.12, 10−3
Dexterity
Grooved pegboard test
(dominant hand)
62.7 (6.7) 51–75 0.73 ± 0.09, 10−4
Memory
California verbal learning test
(delayed free recall)
14.1 (1.9) 9–16 0.62 ± 0.12, 10−3
WMS-III logical memory
(delayed free recall)
29.4 (6.2) 18–42 0.81 ± 0.07, 10−6
Brief visuospatial memory test
(delayed free recall)
10.2 (1.8) 5–12 0.77 ± 0.08, 10−5
Intelligence scale
WAIS-IV block design 46.1(12.8) 12–61 0.83 ± 0.06, 10−6
WAIS-IV matrix reasoning 22.1(3.3) 12–26 0.80 ± 0.07, 10−6
WAIS-IV vocabulary 40.6(4.0) 31–50 0.67 ± 0.11, 10−4
Received: 5 October 2017 Revised: 3 February 2018 Accepted: 7 February 2018
1
Mindstrong Health, 248 Homer Street, Palo Alto, CA 94301, USA
Correspondence: Paul Dagum (paul@mindstronghealth.com)
www.nature.com/npjdigitalmed
Published in partnership with the Scripps Translational Science Institute
• 총 45가지 스마트폰 사용 패턴: 타이핑, 스크롤, 화면 터치
• 스페이스바 누른 후, 다음 문자 타이핑하는 행동
• 백스페이스를 누른 후, 그 다음 백스페이스
• 주소록에서 사람을 찾는 행동 양식
• 스마트폰 사용 패턴과 인지 능력의 상관 관계
• 20-30대 피험자 27명
• Working Memory, Language, Dexterity etc
25. BRIEF COMMUNICATION OPEN
Digital biomarkers of cognitive function
Paul Dagum1
To identify digital biomarkers associated with cognitive function, we analyzed human–computer interaction from 7 days of
smartphone use in 27 subjects (ages 18–34) who received a gold standard neuropsychological assessment. For several
neuropsychological constructs (working memory, memory, executive function, language, and intelligence), we found a family of
digital biomarkers that predicted test scores with high correlations (p 10−4
). These preliminary results suggest that passive
measures from smartphone use could be a continuous ecological surrogate for laboratory-based neuropsychological assessment.
npj Digital Medicine (2018)1:10 ; doi:10.1038/s41746-018-0018-4
INTRODUCTION
By comparison to the functional metrics available in other
disciplines, conventional measures of neuropsychiatric disorders
have several challenges. First, they are obtrusive, requiring a
subject to break from their normal routine, dedicating time and
often travel. Second, they are not ecological and require subjects
to perform a task outside of the context of everyday behavior.
Third, they are episodic and provide sparse snapshots of a patient
only at the time of the assessment. Lastly, they are poorly scalable,
taxing limited resources including space and trained staff.
In seeking objective and ecological measures of cognition, we
attempted to develop a method to measure memory and
executive function not in the laboratory but in the moment,
day-to-day. We used human–computer interaction on smart-
phones to identify digital biomarkers that were correlated with
neuropsychological performance.
RESULTS
In 2014, 27 participants (ages 27.1 ± 4.4 years, education
14.1 ± 2.3 years, M:F 8:19) volunteered for neuropsychological
assessment and a test of the smartphone app. Smartphone
human–computer interaction data from the 7 days following
the neuropsychological assessment showed a range of correla-
tions with the cognitive scores. Table 1 shows the correlation
between each neurocognitive test and the cross-validated
predictions of the supervised kernel PCA constructed from
the biomarkers for that test. Figure 1 shows each participant
test score and the digital biomarker prediction for (a) digits
backward, (b) symbol digit modality, (c) animal fluency,
(d) Wechsler Memory Scale-3rd Edition (WMS-III) logical
memory (delayed free recall), (e) brief visuospatial memory test
(delayed free recall), and (f) Wechsler Adult Intelligence Scale-
4th Edition (WAIS-IV) block design. Construct validity of the
predictions was determined using pattern matching that
computed a correlation of 0.87 with p 10−59
between the
covariance matrix of the predictions and the covariance matrix
of the tests.
Table 1. Fourteen neurocognitive assessments covering five cognitive
domains and dexterity were performed by a neuropsychologist.
Shown are the group mean and standard deviation, range of score,
and the correlation between each test and the cross-validated
prediction constructed from the digital biomarkers for that test
Cognitive predictions
Mean (SD) Range R (predicted),
p-value
Working memory
Digits forward 10.9 (2.7) 7–15 0.71 ± 0.10, 10−4
Digits backward 8.3 (2.7) 4–14 0.75 ± 0.08, 10−5
Executive function
Trail A 23.0 (7.6) 12–39 0.70 ± 0.10, 10−4
Trail B 53.3 (13.1) 37–88 0.82 ± 0.06, 10−6
Symbol digit modality 55.8 (7.7) 43–67 0.70 ± 0.10, 10−4
Language
Animal fluency 22.5 (3.8) 15–30 0.67 ± 0.11, 10−4
FAS phonemic fluency 42 (7.1) 27–52 0.63 ± 0.12, 10−3
Dexterity
Grooved pegboard test
(dominant hand)
62.7 (6.7) 51–75 0.73 ± 0.09, 10−4
Memory
California verbal learning test
(delayed free recall)
14.1 (1.9) 9–16 0.62 ± 0.12, 10−3
WMS-III logical memory
(delayed free recall)
29.4 (6.2) 18–42 0.81 ± 0.07, 10−6
Brief visuospatial memory test
(delayed free recall)
10.2 (1.8) 5–12 0.77 ± 0.08, 10−5
Intelligence scale
WAIS-IV block design 46.1(12.8) 12–61 0.83 ± 0.06, 10−6
WAIS-IV matrix reasoning 22.1(3.3) 12–26 0.80 ± 0.07, 10−6
WAIS-IV vocabulary 40.6(4.0) 31–50 0.67 ± 0.11, 10−4
Received: 5 October 2017 Revised: 3 February 2018 Accepted: 7 February 2018
1
Mindstrong Health, 248 Homer Street, Palo Alto, CA 94301, USA
Correspondence: Paul Dagum (paul@mindstronghealth.com)
www.nature.com/npjdigitalmed
Published in partnership with the Scripps Translational Science Institute
Fig. 1 A blue square represents a participant test Z-score normed to the 27 participant scores and a red circle represents the digital biomarker
prediction Z-score normed to the 27 predictions. Test scores and predictions shown are a digits backward, b symbol digit modality, c animal
fluency, d Wechsler memory Scale-3rd Edition (WMS-III) logical memory (delayed free recall), e brief visuospatial memory test (delayed free
recall), and f Wechsler adult intelligence scale-4th Edition (WAIS-IV) block design
Digital biomarkers of cognitive function
P Dagum
2
1234567890():,;
• 스마트폰 사용 패턴과 인지 능력의 높은 상관 관계
• 파란색: 표준 인지 능력 테스트 결과
• 붉은색: 마인드 스트롱의 스마트폰 사용 패턴
26. •복잡한 의료 데이터의 분석 및 insight 도출
•영상 의료/병리 데이터의 분석/판독
•연속 데이터의 모니터링 및 예방/예측
의료 인공지능의 세 유형
27.
28. NATURE MEDICINE
and the algorithm led to the best accuracy, and the algorithm mark-
edly sped up the review of slides35
. This study is particularly notable,
41
Table 2 | FDA AI approvals are accelerating
Company FDA Approval Indication
Apple September 2018 Atrial fibrillation detection
Aidoc August 2018 CT brain bleed diagnosis
iCAD August 2018 Breast density via
mammography
Zebra Medical July 2018 Coronary calcium scoring
Bay Labs June 2018 Echocardiogram EF
determination
Neural Analytics May 2018 Device for paramedic stroke
diagnosis
IDx April 2018 Diabetic retinopathy diagnosis
Icometrix April 2018 MRI brain interpretation
Imagen March 2018 X-ray wrist fracture diagnosis
Viz.ai February 2018 CT stroke diagnosis
Arterys February 2018 Liver and lung cancer (MRI, CT)
diagnosis
MaxQ-AI January 2018 CT brain bleed diagnosis
Alivecor November 2017 Atrial fibrillation detection via
Apple Watch
Arterys January 2017 MRI heart interpretation
NATURE MEDICINE
인공지능 기반 의료기기
FDA 인허가 현황
Nature Medicine 2019
• Zebra Medical Vision
• 2019년 5월: 흉부 엑스레이에서 기흉 판독
• 2019년 6월: head CT 에서 뇌출혈 판독
• Aidoc
• 2019년 5월: CT에서 폐색전증 판독
• 2019년 6월: CT에서 경추골절 판독
+
34. •Some polyps were detected with only partial appearance.
•detected in both normal and insufficient light condition.
•detected under both qualified and suboptimal bowel preparations.
ARTICLESNATURE BIOMEDICAL ENGINEERING
from patients who underwent colonoscopy examinations up to 2
years later.
Also, we demonstrated high per-image-sensitivity (94.38%
and 91.64%) in both the image (datasetA) and video (datasetC)
analyses. DatasetsA and C included large variations of polyp mor-
phology and image quality (Fig. 3, Supplementary Figs. 2–5 and
Supplementary Videos 3 and 4). For images with only flat and iso-
datasets are often small and do not represent the full range of colon
conditions encountered in the clinical setting, and there are often
discrepancies in the reporting of clinical metrics of success such as
sensitivity and specificity19,20,26
. Compared with other metrics such
as precision, we believe that sensitivity and specificity are the most
appropriate metrics for the evaluation of algorithm performance
because of their independence on the ratio of positive to negative
Fig. 3 | Examples of polyp detection for datasetsA and C. Polyps of different morphology, including flat isochromatic polyps (left), dome-shaped polyps
(second from left, middle), pedunculated polyps (second from right) and sessile serrated adenomatous polyps (right), were detected by the algorithm
(as indicated by the green tags in the bottom set of images) in both normal and insufficient light conditions, under both qualified and suboptimal bowel
preparations. Some polyps were detected with only partial appearance (middle, second from right). See Supplementary Figs 2–6 for additional examples.
flat isochromatic polyps dome-shaped polyps sessile serrated adenomatous polypspedunculated polyps
대장내시경에서의 용종 발견 보조 인공지능