SlideShare une entreprise Scribd logo
1  sur  19
DEMOGRAPHY
DEFINITION: It is a science, which deals with the size, distribution, structure and change of
population. It is also related with other factors like race, mother tongue, marital status, women’s
status, employment status, literacy, occupation, income etc.
POPULATION PYRAMID.
It is a graphical structure showing the age sex distribution of the population of an area.
• Conventionally males are to the left and females to the right.
• Young population is shown at the bottom and old at the top.
• Age interval is to the left and yearly interval to the right.
• X-axis shows the population in percentage & Y- axis shows the age intervals
• Population pyramid of developing countries is conical shaped while that of
developed countries is cylindrical
• There’s narrowing of the pyramid at any point at which there is sudden decrease in population
due to any cause
DEMOGRAPHIC TRANSITION.
The shift of population from high fertility and high mortality to low fertility and
low mortality is called demographic transition. It consists of the following stages
Old balance -Increased fertility, increased mortality
Transition -Increased fertility, declining mortality
Unbalance -Increased fertility & decreased mortality
Transition -Declining fertility, decreased mortality
New balance -Decreased fertility, decreased mortality.
MOMENTUM OF POPULATION.
The increase in growth rate for coming few years despite slight decrease in
fertility level is called momentum of population.
REPLACEMENT LEVEL FERTILITY.
The production of only two children by each couple who will replace their
parents and hence there will be zero growth rate.
FERTILITY
Fertility is the number of live births, a women actually had.
FECUNDITY
It is the ability of a woman to conceive. Fecundity cannot be known unless
fertility is proved. A women may remain fecund throughout her life, but fertility may be
low.
ELIGIBLE COUPLES
An eligible couples refer to a currently married couple where in the wife is in
reproductive age that is between 15 – 45 years.
TARGET COUPLES
The term target couples is applied to those couples who have 2 – 3 children.
Now the definition has been enlarged to include families with even one child or even
newly married couples.
CAUSES OF HIGH FERTILITY
•Early age of marriage & Increase period of fecundity
•Polygamy
•Increased Infant Mortality Rate
•Religious misconceptions
•Desire for more sons
•Pressure of in laws, husband, relatives in joint family system
•Social prestige for a large family
•Economic factors-children are a source of earning in old age
•Lack of education leading to unawareness of the uses of Family Planning.
•Inaccessibility to Family Planning centers
•Unavailability of contraceptive devices
•Fear of side effects of contraceptive devices
CAUSES OF DECLINE IN MORTALITY.
 Improved medical techniques and surgical procedures
 Improved agricultural techniques leading to increased availability of food at affordable
rate which in turn leads to increase in host resistance and tolerance.
 Better hygiene leading to prevention of infections.
 Increased education leading to health awareness and early health seeking behavior.
 Better economic condition of the people leading to affordability of treatment
 Better means of communication
REASONS FOR INCREASED MORTALITY IN THE PAST
Food shortage leading to lack of immunity and malnutrition
Spread of infections
Poor hygiene
Poor medical and surgical techniques
Economic problems leading to inability to buy good food and medicine
Lack of education and awareness about health
Lack of health outlets
FERTILITY DIFFERENTIALS
Fertility differentials means the difference in fertility rate in urban and rural areas. Increased practice
of Family Planning is seen in urban areas because:-
 Increase education level of the community-particularly females
 Correction of differential sex behavior
 Forward looking society in which people don’t feel prestige in large family size, rather
prefer a small family
 Nuclear family system in which couples live independently and are not pressurized by
in-laws
 Economic and social empowerment in relation to decision making
 Proper religious guidance of the public
 Improved socioeconomic conditions of the masses so that they don’t rely on their
children
 Better economic conditions of the public so that they can afford contraceptives
 Late marriage.
 Child spacing
 Better mass media campaign
 Better and easy availability of F.P services
 Decrease in Infant Mortality Rate
ADVANTAGES OF POPULATION CONTROL
 Decreased Maternal Mortality Rate (MMR)
Decrease Infant Mortality Rate (IMR)
 Economic benefit
 Social uplift-improved standard of living.
IMPLICATIONS OF HIGH POPULATION GROWTH
 Overcrowding
 Housing problem
Transport problem
 Jobs problem
 Health problems
 Education problem
 Sanitation problem
 Decreased standard of living
 Environmental deterioration
POPULATION EXPLOSION
Population explosion means a sudden increase in the population beyond 2.0% growth
rate.
The increase in world population has been as under
1st
billion upto 1800
2nd
billion in next 130 years
3rd
billion in next 30 year
4th
billion in next 15 years
5th
billion in 8 years.
Year Population Growth rate
2000 years ago 250 million
1800 978 million 0.5
1900 1650 million 0.6
1950 2526 million 1.0
1970 3696 million 1.92
1989 5000 million 1.63
2011 6,928,198,253 1.09%
2050 10 billion
Relationship of population explosion with growth rate and doubling time of
population as under:-
Doubling time = 70 / growth rate
Growth Rate Doubling time of population
 Slow < 0.5% 140 years
 Moderate 0.5% - 1% 70-140 years
 Rapid 1 - 1.5% 47-70 years
 Very rapid 1.5 - 2% 35-47 years
 Explosive > 2% 28-35 years
(population explosion) -
GROWTH RATE =
Crude birth rate – crude death rate + net migration.
Growth rate of Pakistan – 1.6%
Growth rate of the world – 1.09%
CBR = Total Live births during the year x 1000 {24.8/1000}
mid year population
CDR= Total deaths during the year x 1000 {6.9/1000}
mid year population
Growth rate of the world was at it’s peak around 1970 when it was 1.92 %. In 1996 it fell
to 1.7 %.
CBR of the world = 19.15/1000 population
CDR of the world = 8.12/1000 population
Births/min = 252 worldwide
Births/ sec = 4.2 worldwide
95% of the world’s growth is occurring in developing countries.
DEPENDENCY Ratio = Dependent population
Independent population
Population below 15 + above 65 x 100
Population 15 – 64
D.R . of Pakistan = 86 %
SEX Ratio = No. of male = 1.07/1.00
No. of females
LIFE EXPECTANCY AT BIRTH
Average No., of years a person can expect to live if he experiences through out his live
the age specific death rates currently prevailing.
Total = 65.99
Male = 64.2
Female = 67.9
Target for 2025 = 74.1 years
LITERACY RATE : The WHO definition is “A person who can write his name and a
simple paragraph about himself”
Total = 49.9%
Male = 63%
Female = 36%
GENERAL FERTILITY RATE= No. of Live births in a year x 1000
No. of females between 15 – 49
AGE SPECIFIC FERTILITY RATE
No. of live births in a year to a women of particular age group x 1000
Total No. of women of that age group
Age specific fertility rate between 15 – 19 year = 0.082
Age specific fertility rate between 20 – 29 year = 0.245
Age specific fertility rate between 25 – 29 year = 0.275
Age specific fertility rate between 30 – 34 year = 0.212
Age specific fertility rate between 35 – 39 year = 0.145
Age specific fertility rate between 40 – 44 year = 0.071
Age specific fertility rate between 45 – 49 year = 0.023
Total 1.053
Total fertility rate = sum of ASFR x 5
1.053 x 5 = 5.26
Current = 3.17 children born/woman
Age specific death rate =
No. of deaths of people in a specific age group x 1000
Total population of that age
Infant Mortality Rate (IMR) =
No. of deaths of children below 1 year x 1000
Total live birth in a year
Pakistan IMR = 63.26/1000 {male 66.5 female 59.8} Target for 2025 = 20/1000
Under 5 mortality - 86.5/1000 {WB 2011} Target for 2025 = 50/1000
Probability that a child will die before reaching 5 using the current age specific mortality
rates
Neonatal mortality rate =
No. of deaths during 1 month after birth x 1000
Total live births in a year
Pakistan NMR = 54/1000
Perinatal mortality rate =
No. of deaths after 28 weeks of pregnancy + 1 week after birth x 1000
Total deaths after 28 weeks + total live births in a year
Maternal Mortality Rate =
Deaths of women due to pregnancy related causes during pregnancy + 40 days after birth X 1000
Total Live birth in a year
Pakistan MMR = 260 / 100,000 Target for 2025 = 110/1000
Case fatality rate
This helps to know the virulence of the disease and the need for its primary prevention
No. of deaths due to a specific cause
Total cases( alive or dead) of that cause
Proportionate mortality rate
This helps to know the contribution of a particular disease in the overall mortality of an
area and hence it’s significance and the need for primary prevention
No. of deaths due to a specific cause
Total deaths due to all causes
Human development index = 0.504 ranking145 among 185 countries
Developed in 1990 Pakistani economist Dr. Mehboob ul Haq
{life expectancy at birth + adult literacy + GDP/capita}
Physical Quality of life index = IMR + L.E at 1 year + literacy rate
Gross National Product (GNP) = Total income of the country generated from internal
sources as well as in the form of foreign exchange. In Pakistan it is 550 L
Gross Domestic Product (GDP) = Income generated from within the country or income
per family per year
Poverty Line = Income required to earn 2400 cal/ person / day in urban areas and 2100
cal / day / person in rural areas 24% (2005)
Human Development report of UNDP 2009 = 60% of Pakistanis live on less than 2
USD/day
In Pakistan 1/3rd
of the population is living below the poverty line
Contraceptive prevalence rate = 30 %
% of GDP spent on education = 2.7% (2009)
% of GDP spent on health = 2.6% (2009)
Under 5 children under weight for age = 31.3%
Countries in decreasing order of population =
China, India, USA, Indonesia, Brazil, Pakistan,Bangladesh,Nigeria, Russia, Japan.
Pakistan’s population 187,343,000
With an area equal to 0.6 % of the world, Pakistan has 2.3 % of the world
population.
Age structure of Pakistani population
Under 15 = 35.4% 15-64 years = 60.4% Above 65 years = 4.2%
Population having access to clean drinking water
96% urban and 89% rural (WHO& UNICEF Joint Monitoring programme 2004)
But house connections to 49% & 15% respectively
Population having access to improved methods of sanitation
92% urban and 41% rural (WHO& UNICEF Joint Monitoring programme 2004) but
sewerage system is available only to 40% & 6% respectively
HEALTH SECTOR TARGETS
2000-01 Target for 2025
•Percentage of children 51 100
below 1 year fully immunized
•Percentage of expectant mothers 40 100
fully immunized against tetanus
•Trained personnel attending 30 100
pregnancy & child health
•Population with access to Health
Services 65 100
•Hospital beds per 1,000 people 0.645 1
•Doctors per 1000 population 0.8 10
•Dental Surgeons per 10,000 people 0.33 1
•Nurses per 10,000 population 2.09 4.5
Source: CIA World Fact book July 12 2011

Contenu connexe

Tendances (20)

Demography uph
Demography uphDemography uph
Demography uph
 
Measures of fertility
Measures of fertility Measures of fertility
Measures of fertility
 
Demography
DemographyDemography
Demography
 
Lecture demography
Lecture demographyLecture demography
Lecture demography
 
Fertility and its indicators
Fertility and its indicatorsFertility and its indicators
Fertility and its indicators
 
DEMOGRAPHY
DEMOGRAPHYDEMOGRAPHY
DEMOGRAPHY
 
FERTILITY
FERTILITYFERTILITY
FERTILITY
 
DEMOGRAPHY
DEMOGRAPHYDEMOGRAPHY
DEMOGRAPHY
 
Population Studies / Demography Introduction
Population Studies / Demography IntroductionPopulation Studies / Demography Introduction
Population Studies / Demography Introduction
 
Introduction to population pyramids
Introduction to population pyramidsIntroduction to population pyramids
Introduction to population pyramids
 
Demography
DemographyDemography
Demography
 
Demography population dynamics
Demography population dynamicsDemography population dynamics
Demography population dynamics
 
Population Composition & Structure
Population Composition & StructurePopulation Composition & Structure
Population Composition & Structure
 
Measures of fertility
Measures of fertilityMeasures of fertility
Measures of fertility
 
Demography
DemographyDemography
Demography
 
Population growth, demographic transition model and overpopulated places
Population growth, demographic transition model and overpopulated placesPopulation growth, demographic transition model and overpopulated places
Population growth, demographic transition model and overpopulated places
 
Demography
DemographyDemography
Demography
 
Population Growth
Population GrowthPopulation Growth
Population Growth
 
Population pyramid
Population pyramidPopulation pyramid
Population pyramid
 
POPULATION DYNAMICS
POPULATION DYNAMICSPOPULATION DYNAMICS
POPULATION DYNAMICS
 

En vedette

Population Policies Lesson Outline
Population Policies Lesson OutlinePopulation Policies Lesson Outline
Population Policies Lesson OutlineTom McLean
 
Demography and its indicators
Demography and its indicatorsDemography and its indicators
Demography and its indicatorsDeepak Upadhyay
 
Egypt some Demographic indicators
Egypt some Demographic indicatorsEgypt some Demographic indicators
Egypt some Demographic indicatorsTarek Tawfik Amin
 
Population stabilization in india 13.02.2014
Population stabilization in india 13.02.2014Population stabilization in india 13.02.2014
Population stabilization in india 13.02.2014Dr. Dharmendra Gahwai
 
Chapter 16
Chapter 16Chapter 16
Chapter 16MEEvans
 
Population policy of the 21st century
Population policy of the 21st centuryPopulation policy of the 21st century
Population policy of the 21st centuryShahid Imran Khan
 
Demographic transition and challenge Bangladesh is facing
Demographic transition and challenge Bangladesh is facingDemographic transition and challenge Bangladesh is facing
Demographic transition and challenge Bangladesh is facingMoinul Ahsan
 
Population policy in bd
Population policy in bdPopulation policy in bd
Population policy in bdPintu Sheel
 
Maternal Mortality Survey Bangladesh 2011
Maternal Mortality Survey Bangladesh 2011Maternal Mortality Survey Bangladesh 2011
Maternal Mortality Survey Bangladesh 2011MEASURE Evaluation
 
Chapter 2 - Singapore's Population Policy
Chapter 2 - Singapore's Population PolicyChapter 2 - Singapore's Population Policy
Chapter 2 - Singapore's Population PolicyGoh Bang Rui
 
Ch 2 Governance: Population Policy
Ch 2 Governance: Population PolicyCh 2 Governance: Population Policy
Ch 2 Governance: Population Policyang_mei_feng_karen
 
Population Policies
Population PoliciesPopulation Policies
Population PoliciesSeth Dixon
 
Vital statisitics in india
Vital statisitics in indiaVital statisitics in india
Vital statisitics in indiaPrabhu Ponnusamy
 
Population growth & major environmental problems in bangladesh
Population growth & major environmental problems in bangladeshPopulation growth & major environmental problems in bangladesh
Population growth & major environmental problems in bangladeshnorth south university
 

En vedette (20)

Population Policies Lesson Outline
Population Policies Lesson OutlinePopulation Policies Lesson Outline
Population Policies Lesson Outline
 
Demography and its indicators
Demography and its indicatorsDemography and its indicators
Demography and its indicators
 
Environmental Science slides
Environmental Science slidesEnvironmental Science slides
Environmental Science slides
 
Egypt some Demographic indicators
Egypt some Demographic indicatorsEgypt some Demographic indicators
Egypt some Demographic indicators
 
Population stabilization in india 13.02.2014
Population stabilization in india 13.02.2014Population stabilization in india 13.02.2014
Population stabilization in india 13.02.2014
 
Pop geog 1
Pop geog 1Pop geog 1
Pop geog 1
 
Chapter 16
Chapter 16Chapter 16
Chapter 16
 
Population policy of the 21st century
Population policy of the 21st centuryPopulation policy of the 21st century
Population policy of the 21st century
 
Demographic transition and challenge Bangladesh is facing
Demographic transition and challenge Bangladesh is facingDemographic transition and challenge Bangladesh is facing
Demographic transition and challenge Bangladesh is facing
 
Population policy in bd
Population policy in bdPopulation policy in bd
Population policy in bd
 
Maternal Mortality Survey Bangladesh 2011
Maternal Mortality Survey Bangladesh 2011Maternal Mortality Survey Bangladesh 2011
Maternal Mortality Survey Bangladesh 2011
 
Chapter 2 - Singapore's Population Policy
Chapter 2 - Singapore's Population PolicyChapter 2 - Singapore's Population Policy
Chapter 2 - Singapore's Population Policy
 
Ch 2 Governance: Population Policy
Ch 2 Governance: Population PolicyCh 2 Governance: Population Policy
Ch 2 Governance: Population Policy
 
Demography
Demography Demography
Demography
 
SociologyExchange.co.uk Shared Resource
SociologyExchange.co.uk Shared ResourceSociologyExchange.co.uk Shared Resource
SociologyExchange.co.uk Shared Resource
 
Population Policies
Population PoliciesPopulation Policies
Population Policies
 
Vital statisitics in india
Vital statisitics in indiaVital statisitics in india
Vital statisitics in india
 
Population growth & major environmental problems in bangladesh
Population growth & major environmental problems in bangladeshPopulation growth & major environmental problems in bangladesh
Population growth & major environmental problems in bangladesh
 
Ppt demograph dr sajid hameedy
Ppt demograph dr sajid hameedyPpt demograph dr sajid hameedy
Ppt demograph dr sajid hameedy
 
SociologyExchange.co.uk Shared Resource
SociologyExchange.co.uk Shared ResourceSociologyExchange.co.uk Shared Resource
SociologyExchange.co.uk Shared Resource
 

Similaire à Demography slides

An brief introduction to the
An brief introduction to theAn brief introduction to the
An brief introduction to theAPSARA Nishshanka
 
Population growth lesson3
Population growth lesson3Population growth lesson3
Population growth lesson3Ms Geoflake
 
Global classrooms dossier
Global classrooms dossierGlobal classrooms dossier
Global classrooms dossierGema
 
DEMOGRAPHY and family health census.pptx
DEMOGRAPHY and family health census.pptxDEMOGRAPHY and family health census.pptx
DEMOGRAPHY and family health census.pptxriyazameer
 
Demography and Family Plannining Lecture
Demography   and Family Plannining Lecture Demography   and Family Plannining Lecture
Demography and Family Plannining Lecture Dr.Farhana Yasmin
 
Presentation on natality by amin
Presentation on natality by aminPresentation on natality by amin
Presentation on natality by aminAminul Islam
 
Population introduction notes
Population introduction notesPopulation introduction notes
Population introduction notesMoses Lutta
 
factors_affecting_population_growth.ppt
factors_affecting_population_growth.pptfactors_affecting_population_growth.ppt
factors_affecting_population_growth.pptWmuia
 
AS GEOGRAPHY REVISION - MIGRATION - 5.1 MIGRATION AS POPULATION CHANGE
AS GEOGRAPHY REVISION - MIGRATION - 5.1 MIGRATION AS POPULATION CHANGEAS GEOGRAPHY REVISION - MIGRATION - 5.1 MIGRATION AS POPULATION CHANGE
AS GEOGRAPHY REVISION - MIGRATION - 5.1 MIGRATION AS POPULATION CHANGEGeorge Dumitrache
 
CAMBRIDGE AS GEOGRAPHY REVISION: POPULATION - 4.1 NATURAL INCREASE
CAMBRIDGE AS GEOGRAPHY REVISION: POPULATION - 4.1 NATURAL INCREASECAMBRIDGE AS GEOGRAPHY REVISION: POPULATION - 4.1 NATURAL INCREASE
CAMBRIDGE AS GEOGRAPHY REVISION: POPULATION - 4.1 NATURAL INCREASEGeorge Dumitrache
 
Demographic transition in India and its effects
Demographic transition in India and its effectsDemographic transition in India and its effects
Demographic transition in India and its effectsSarinkumar P S
 
Causes of over population
Causes of over populationCauses of over population
Causes of over populationFayaz Ahmad
 
Human population
Human populationHuman population
Human populationElisa
 
MORTALITY IN INFANCY AND CHILDHOOD (2).docx
MORTALITY IN INFANCY AND CHILDHOOD (2).docxMORTALITY IN INFANCY AND CHILDHOOD (2).docx
MORTALITY IN INFANCY AND CHILDHOOD (2).docxSambaSukanya
 
1.1 Population Change
1.1 Population Change1.1 Population Change
1.1 Population Changejodiecmills
 

Similaire à Demography slides (20)

Demography
DemographyDemography
Demography
 
Demography,unit 5
Demography,unit 5Demography,unit 5
Demography,unit 5
 
An brief introduction to the
An brief introduction to theAn brief introduction to the
An brief introduction to the
 
Population growth lesson3
Population growth lesson3Population growth lesson3
Population growth lesson3
 
Global classrooms dossier
Global classrooms dossierGlobal classrooms dossier
Global classrooms dossier
 
DEMOGRAPHY and family health census.pptx
DEMOGRAPHY and family health census.pptxDEMOGRAPHY and family health census.pptx
DEMOGRAPHY and family health census.pptx
 
Demography lecture ppt
Demography lecture pptDemography lecture ppt
Demography lecture ppt
 
Demography and Family Plannining Lecture
Demography   and Family Plannining Lecture Demography   and Family Plannining Lecture
Demography and Family Plannining Lecture
 
Demographic indicators
Demographic indicatorsDemographic indicators
Demographic indicators
 
Presentation on natality by amin
Presentation on natality by aminPresentation on natality by amin
Presentation on natality by amin
 
Population introduction notes
Population introduction notesPopulation introduction notes
Population introduction notes
 
factors_affecting_population_growth.ppt
factors_affecting_population_growth.pptfactors_affecting_population_growth.ppt
factors_affecting_population_growth.ppt
 
AS GEOGRAPHY REVISION - MIGRATION - 5.1 MIGRATION AS POPULATION CHANGE
AS GEOGRAPHY REVISION - MIGRATION - 5.1 MIGRATION AS POPULATION CHANGEAS GEOGRAPHY REVISION - MIGRATION - 5.1 MIGRATION AS POPULATION CHANGE
AS GEOGRAPHY REVISION - MIGRATION - 5.1 MIGRATION AS POPULATION CHANGE
 
CAMBRIDGE AS GEOGRAPHY REVISION: POPULATION - 4.1 NATURAL INCREASE
CAMBRIDGE AS GEOGRAPHY REVISION: POPULATION - 4.1 NATURAL INCREASECAMBRIDGE AS GEOGRAPHY REVISION: POPULATION - 4.1 NATURAL INCREASE
CAMBRIDGE AS GEOGRAPHY REVISION: POPULATION - 4.1 NATURAL INCREASE
 
Demographic transition in India and its effects
Demographic transition in India and its effectsDemographic transition in India and its effects
Demographic transition in India and its effects
 
Causes of over population
Causes of over populationCauses of over population
Causes of over population
 
Demography & health
Demography & healthDemography & health
Demography & health
 
Human population
Human populationHuman population
Human population
 
MORTALITY IN INFANCY AND CHILDHOOD (2).docx
MORTALITY IN INFANCY AND CHILDHOOD (2).docxMORTALITY IN INFANCY AND CHILDHOOD (2).docx
MORTALITY IN INFANCY AND CHILDHOOD (2).docx
 
1.1 Population Change
1.1 Population Change1.1 Population Change
1.1 Population Change
 

Dernier

Disha NEET Physics Guide for classes 11 and 12.pdf
Disha NEET Physics Guide for classes 11 and 12.pdfDisha NEET Physics Guide for classes 11 and 12.pdf
Disha NEET Physics Guide for classes 11 and 12.pdfchloefrazer622
 
Measures of Dispersion and Variability: Range, QD, AD and SD
Measures of Dispersion and Variability: Range, QD, AD and SDMeasures of Dispersion and Variability: Range, QD, AD and SD
Measures of Dispersion and Variability: Range, QD, AD and SDThiyagu K
 
microwave assisted reaction. General introduction
microwave assisted reaction. General introductionmicrowave assisted reaction. General introduction
microwave assisted reaction. General introductionMaksud Ahmed
 
fourth grading exam for kindergarten in writing
fourth grading exam for kindergarten in writingfourth grading exam for kindergarten in writing
fourth grading exam for kindergarten in writingTeacherCyreneCayanan
 
Q4-W6-Restating Informational Text Grade 3
Q4-W6-Restating Informational Text Grade 3Q4-W6-Restating Informational Text Grade 3
Q4-W6-Restating Informational Text Grade 3JemimahLaneBuaron
 
Accessible design: Minimum effort, maximum impact
Accessible design: Minimum effort, maximum impactAccessible design: Minimum effort, maximum impact
Accessible design: Minimum effort, maximum impactdawncurless
 
Beyond the EU: DORA and NIS 2 Directive's Global Impact
Beyond the EU: DORA and NIS 2 Directive's Global ImpactBeyond the EU: DORA and NIS 2 Directive's Global Impact
Beyond the EU: DORA and NIS 2 Directive's Global ImpactPECB
 
Paris 2024 Olympic Geographies - an activity
Paris 2024 Olympic Geographies - an activityParis 2024 Olympic Geographies - an activity
Paris 2024 Olympic Geographies - an activityGeoBlogs
 
Z Score,T Score, Percential Rank and Box Plot Graph
Z Score,T Score, Percential Rank and Box Plot GraphZ Score,T Score, Percential Rank and Box Plot Graph
Z Score,T Score, Percential Rank and Box Plot GraphThiyagu K
 
IGNOU MSCCFT and PGDCFT Exam Question Pattern: MCFT003 Counselling and Family...
IGNOU MSCCFT and PGDCFT Exam Question Pattern: MCFT003 Counselling and Family...IGNOU MSCCFT and PGDCFT Exam Question Pattern: MCFT003 Counselling and Family...
IGNOU MSCCFT and PGDCFT Exam Question Pattern: MCFT003 Counselling and Family...PsychoTech Services
 
Interactive Powerpoint_How to Master effective communication
Interactive Powerpoint_How to Master effective communicationInteractive Powerpoint_How to Master effective communication
Interactive Powerpoint_How to Master effective communicationnomboosow
 
Activity 01 - Artificial Culture (1).pdf
Activity 01 - Artificial Culture (1).pdfActivity 01 - Artificial Culture (1).pdf
Activity 01 - Artificial Culture (1).pdfciinovamais
 
A Critique of the Proposed National Education Policy Reform
A Critique of the Proposed National Education Policy ReformA Critique of the Proposed National Education Policy Reform
A Critique of the Proposed National Education Policy ReformChameera Dedduwage
 
Software Engineering Methodologies (overview)
Software Engineering Methodologies (overview)Software Engineering Methodologies (overview)
Software Engineering Methodologies (overview)eniolaolutunde
 
SOCIAL AND HISTORICAL CONTEXT - LFTVD.pptx
SOCIAL AND HISTORICAL CONTEXT - LFTVD.pptxSOCIAL AND HISTORICAL CONTEXT - LFTVD.pptx
SOCIAL AND HISTORICAL CONTEXT - LFTVD.pptxiammrhaywood
 
Presentation by Andreas Schleicher Tackling the School Absenteeism Crisis 30 ...
Presentation by Andreas Schleicher Tackling the School Absenteeism Crisis 30 ...Presentation by Andreas Schleicher Tackling the School Absenteeism Crisis 30 ...
Presentation by Andreas Schleicher Tackling the School Absenteeism Crisis 30 ...EduSkills OECD
 
Sports & Fitness Value Added Course FY..
Sports & Fitness Value Added Course FY..Sports & Fitness Value Added Course FY..
Sports & Fitness Value Added Course FY..Disha Kariya
 
Ecosystem Interactions Class Discussion Presentation in Blue Green Lined Styl...
Ecosystem Interactions Class Discussion Presentation in Blue Green Lined Styl...Ecosystem Interactions Class Discussion Presentation in Blue Green Lined Styl...
Ecosystem Interactions Class Discussion Presentation in Blue Green Lined Styl...fonyou31
 

Dernier (20)

Disha NEET Physics Guide for classes 11 and 12.pdf
Disha NEET Physics Guide for classes 11 and 12.pdfDisha NEET Physics Guide for classes 11 and 12.pdf
Disha NEET Physics Guide for classes 11 and 12.pdf
 
Measures of Dispersion and Variability: Range, QD, AD and SD
Measures of Dispersion and Variability: Range, QD, AD and SDMeasures of Dispersion and Variability: Range, QD, AD and SD
Measures of Dispersion and Variability: Range, QD, AD and SD
 
microwave assisted reaction. General introduction
microwave assisted reaction. General introductionmicrowave assisted reaction. General introduction
microwave assisted reaction. General introduction
 
fourth grading exam for kindergarten in writing
fourth grading exam for kindergarten in writingfourth grading exam for kindergarten in writing
fourth grading exam for kindergarten in writing
 
Q4-W6-Restating Informational Text Grade 3
Q4-W6-Restating Informational Text Grade 3Q4-W6-Restating Informational Text Grade 3
Q4-W6-Restating Informational Text Grade 3
 
Accessible design: Minimum effort, maximum impact
Accessible design: Minimum effort, maximum impactAccessible design: Minimum effort, maximum impact
Accessible design: Minimum effort, maximum impact
 
Beyond the EU: DORA and NIS 2 Directive's Global Impact
Beyond the EU: DORA and NIS 2 Directive's Global ImpactBeyond the EU: DORA and NIS 2 Directive's Global Impact
Beyond the EU: DORA and NIS 2 Directive's Global Impact
 
Paris 2024 Olympic Geographies - an activity
Paris 2024 Olympic Geographies - an activityParis 2024 Olympic Geographies - an activity
Paris 2024 Olympic Geographies - an activity
 
Z Score,T Score, Percential Rank and Box Plot Graph
Z Score,T Score, Percential Rank and Box Plot GraphZ Score,T Score, Percential Rank and Box Plot Graph
Z Score,T Score, Percential Rank and Box Plot Graph
 
IGNOU MSCCFT and PGDCFT Exam Question Pattern: MCFT003 Counselling and Family...
IGNOU MSCCFT and PGDCFT Exam Question Pattern: MCFT003 Counselling and Family...IGNOU MSCCFT and PGDCFT Exam Question Pattern: MCFT003 Counselling and Family...
IGNOU MSCCFT and PGDCFT Exam Question Pattern: MCFT003 Counselling and Family...
 
Interactive Powerpoint_How to Master effective communication
Interactive Powerpoint_How to Master effective communicationInteractive Powerpoint_How to Master effective communication
Interactive Powerpoint_How to Master effective communication
 
Activity 01 - Artificial Culture (1).pdf
Activity 01 - Artificial Culture (1).pdfActivity 01 - Artificial Culture (1).pdf
Activity 01 - Artificial Culture (1).pdf
 
Mattingly "AI & Prompt Design: Structured Data, Assistants, & RAG"
Mattingly "AI & Prompt Design: Structured Data, Assistants, & RAG"Mattingly "AI & Prompt Design: Structured Data, Assistants, & RAG"
Mattingly "AI & Prompt Design: Structured Data, Assistants, & RAG"
 
A Critique of the Proposed National Education Policy Reform
A Critique of the Proposed National Education Policy ReformA Critique of the Proposed National Education Policy Reform
A Critique of the Proposed National Education Policy Reform
 
Software Engineering Methodologies (overview)
Software Engineering Methodologies (overview)Software Engineering Methodologies (overview)
Software Engineering Methodologies (overview)
 
SOCIAL AND HISTORICAL CONTEXT - LFTVD.pptx
SOCIAL AND HISTORICAL CONTEXT - LFTVD.pptxSOCIAL AND HISTORICAL CONTEXT - LFTVD.pptx
SOCIAL AND HISTORICAL CONTEXT - LFTVD.pptx
 
Código Creativo y Arte de Software | Unidad 1
Código Creativo y Arte de Software | Unidad 1Código Creativo y Arte de Software | Unidad 1
Código Creativo y Arte de Software | Unidad 1
 
Presentation by Andreas Schleicher Tackling the School Absenteeism Crisis 30 ...
Presentation by Andreas Schleicher Tackling the School Absenteeism Crisis 30 ...Presentation by Andreas Schleicher Tackling the School Absenteeism Crisis 30 ...
Presentation by Andreas Schleicher Tackling the School Absenteeism Crisis 30 ...
 
Sports & Fitness Value Added Course FY..
Sports & Fitness Value Added Course FY..Sports & Fitness Value Added Course FY..
Sports & Fitness Value Added Course FY..
 
Ecosystem Interactions Class Discussion Presentation in Blue Green Lined Styl...
Ecosystem Interactions Class Discussion Presentation in Blue Green Lined Styl...Ecosystem Interactions Class Discussion Presentation in Blue Green Lined Styl...
Ecosystem Interactions Class Discussion Presentation in Blue Green Lined Styl...
 

Demography slides

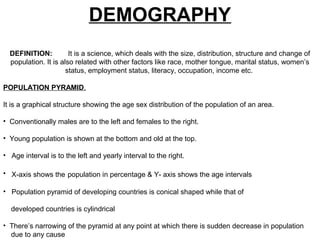
  • 1. DEMOGRAPHY DEFINITION: It is a science, which deals with the size, distribution, structure and change of population. It is also related with other factors like race, mother tongue, marital status, women’s status, employment status, literacy, occupation, income etc. POPULATION PYRAMID. It is a graphical structure showing the age sex distribution of the population of an area. • Conventionally males are to the left and females to the right. • Young population is shown at the bottom and old at the top. • Age interval is to the left and yearly interval to the right. • X-axis shows the population in percentage & Y- axis shows the age intervals • Population pyramid of developing countries is conical shaped while that of developed countries is cylindrical • There’s narrowing of the pyramid at any point at which there is sudden decrease in population due to any cause
  • 2. DEMOGRAPHIC TRANSITION. The shift of population from high fertility and high mortality to low fertility and low mortality is called demographic transition. It consists of the following stages Old balance -Increased fertility, increased mortality Transition -Increased fertility, declining mortality Unbalance -Increased fertility & decreased mortality Transition -Declining fertility, decreased mortality New balance -Decreased fertility, decreased mortality.
  • 3. MOMENTUM OF POPULATION. The increase in growth rate for coming few years despite slight decrease in fertility level is called momentum of population. REPLACEMENT LEVEL FERTILITY. The production of only two children by each couple who will replace their parents and hence there will be zero growth rate. FERTILITY Fertility is the number of live births, a women actually had. FECUNDITY It is the ability of a woman to conceive. Fecundity cannot be known unless fertility is proved. A women may remain fecund throughout her life, but fertility may be low. ELIGIBLE COUPLES An eligible couples refer to a currently married couple where in the wife is in reproductive age that is between 15 – 45 years. TARGET COUPLES The term target couples is applied to those couples who have 2 – 3 children. Now the definition has been enlarged to include families with even one child or even newly married couples.
  • 4. CAUSES OF HIGH FERTILITY •Early age of marriage & Increase period of fecundity •Polygamy •Increased Infant Mortality Rate •Religious misconceptions •Desire for more sons •Pressure of in laws, husband, relatives in joint family system •Social prestige for a large family •Economic factors-children are a source of earning in old age •Lack of education leading to unawareness of the uses of Family Planning. •Inaccessibility to Family Planning centers •Unavailability of contraceptive devices •Fear of side effects of contraceptive devices
  • 5. CAUSES OF DECLINE IN MORTALITY.  Improved medical techniques and surgical procedures  Improved agricultural techniques leading to increased availability of food at affordable rate which in turn leads to increase in host resistance and tolerance.  Better hygiene leading to prevention of infections.  Increased education leading to health awareness and early health seeking behavior.  Better economic condition of the people leading to affordability of treatment  Better means of communication
  • 6. REASONS FOR INCREASED MORTALITY IN THE PAST Food shortage leading to lack of immunity and malnutrition Spread of infections Poor hygiene Poor medical and surgical techniques Economic problems leading to inability to buy good food and medicine Lack of education and awareness about health Lack of health outlets
  • 7. FERTILITY DIFFERENTIALS Fertility differentials means the difference in fertility rate in urban and rural areas. Increased practice of Family Planning is seen in urban areas because:-  Increase education level of the community-particularly females  Correction of differential sex behavior  Forward looking society in which people don’t feel prestige in large family size, rather prefer a small family  Nuclear family system in which couples live independently and are not pressurized by in-laws  Economic and social empowerment in relation to decision making  Proper religious guidance of the public  Improved socioeconomic conditions of the masses so that they don’t rely on their children  Better economic conditions of the public so that they can afford contraceptives  Late marriage.  Child spacing  Better mass media campaign  Better and easy availability of F.P services  Decrease in Infant Mortality Rate
  • 8. ADVANTAGES OF POPULATION CONTROL  Decreased Maternal Mortality Rate (MMR) Decrease Infant Mortality Rate (IMR)  Economic benefit  Social uplift-improved standard of living. IMPLICATIONS OF HIGH POPULATION GROWTH  Overcrowding  Housing problem Transport problem  Jobs problem  Health problems  Education problem  Sanitation problem  Decreased standard of living  Environmental deterioration
  • 9. POPULATION EXPLOSION Population explosion means a sudden increase in the population beyond 2.0% growth rate. The increase in world population has been as under 1st billion upto 1800 2nd billion in next 130 years 3rd billion in next 30 year 4th billion in next 15 years 5th billion in 8 years. Year Population Growth rate 2000 years ago 250 million 1800 978 million 0.5 1900 1650 million 0.6 1950 2526 million 1.0 1970 3696 million 1.92 1989 5000 million 1.63 2011 6,928,198,253 1.09% 2050 10 billion
  • 10. Relationship of population explosion with growth rate and doubling time of population as under:- Doubling time = 70 / growth rate Growth Rate Doubling time of population  Slow < 0.5% 140 years  Moderate 0.5% - 1% 70-140 years  Rapid 1 - 1.5% 47-70 years  Very rapid 1.5 - 2% 35-47 years  Explosive > 2% 28-35 years (population explosion) -
  • 11. GROWTH RATE = Crude birth rate – crude death rate + net migration. Growth rate of Pakistan – 1.6% Growth rate of the world – 1.09% CBR = Total Live births during the year x 1000 {24.8/1000} mid year population CDR= Total deaths during the year x 1000 {6.9/1000} mid year population Growth rate of the world was at it’s peak around 1970 when it was 1.92 %. In 1996 it fell to 1.7 %. CBR of the world = 19.15/1000 population CDR of the world = 8.12/1000 population Births/min = 252 worldwide Births/ sec = 4.2 worldwide 95% of the world’s growth is occurring in developing countries.
  • 12. DEPENDENCY Ratio = Dependent population Independent population Population below 15 + above 65 x 100 Population 15 – 64 D.R . of Pakistan = 86 % SEX Ratio = No. of male = 1.07/1.00 No. of females LIFE EXPECTANCY AT BIRTH Average No., of years a person can expect to live if he experiences through out his live the age specific death rates currently prevailing. Total = 65.99 Male = 64.2 Female = 67.9 Target for 2025 = 74.1 years LITERACY RATE : The WHO definition is “A person who can write his name and a simple paragraph about himself” Total = 49.9% Male = 63% Female = 36%
  • 13. GENERAL FERTILITY RATE= No. of Live births in a year x 1000 No. of females between 15 – 49 AGE SPECIFIC FERTILITY RATE No. of live births in a year to a women of particular age group x 1000 Total No. of women of that age group Age specific fertility rate between 15 – 19 year = 0.082 Age specific fertility rate between 20 – 29 year = 0.245 Age specific fertility rate between 25 – 29 year = 0.275 Age specific fertility rate between 30 – 34 year = 0.212 Age specific fertility rate between 35 – 39 year = 0.145 Age specific fertility rate between 40 – 44 year = 0.071 Age specific fertility rate between 45 – 49 year = 0.023 Total 1.053 Total fertility rate = sum of ASFR x 5 1.053 x 5 = 5.26 Current = 3.17 children born/woman
  • 14. Age specific death rate = No. of deaths of people in a specific age group x 1000 Total population of that age Infant Mortality Rate (IMR) = No. of deaths of children below 1 year x 1000 Total live birth in a year Pakistan IMR = 63.26/1000 {male 66.5 female 59.8} Target for 2025 = 20/1000 Under 5 mortality - 86.5/1000 {WB 2011} Target for 2025 = 50/1000 Probability that a child will die before reaching 5 using the current age specific mortality rates Neonatal mortality rate = No. of deaths during 1 month after birth x 1000 Total live births in a year Pakistan NMR = 54/1000
  • 15. Perinatal mortality rate = No. of deaths after 28 weeks of pregnancy + 1 week after birth x 1000 Total deaths after 28 weeks + total live births in a year Maternal Mortality Rate = Deaths of women due to pregnancy related causes during pregnancy + 40 days after birth X 1000 Total Live birth in a year Pakistan MMR = 260 / 100,000 Target for 2025 = 110/1000 Case fatality rate This helps to know the virulence of the disease and the need for its primary prevention No. of deaths due to a specific cause Total cases( alive or dead) of that cause Proportionate mortality rate This helps to know the contribution of a particular disease in the overall mortality of an area and hence it’s significance and the need for primary prevention No. of deaths due to a specific cause Total deaths due to all causes
  • 16. Human development index = 0.504 ranking145 among 185 countries Developed in 1990 Pakistani economist Dr. Mehboob ul Haq {life expectancy at birth + adult literacy + GDP/capita} Physical Quality of life index = IMR + L.E at 1 year + literacy rate Gross National Product (GNP) = Total income of the country generated from internal sources as well as in the form of foreign exchange. In Pakistan it is 550 L Gross Domestic Product (GDP) = Income generated from within the country or income per family per year Poverty Line = Income required to earn 2400 cal/ person / day in urban areas and 2100 cal / day / person in rural areas 24% (2005) Human Development report of UNDP 2009 = 60% of Pakistanis live on less than 2 USD/day In Pakistan 1/3rd of the population is living below the poverty line Contraceptive prevalence rate = 30 % % of GDP spent on education = 2.7% (2009) % of GDP spent on health = 2.6% (2009) Under 5 children under weight for age = 31.3%
  • 17. Countries in decreasing order of population = China, India, USA, Indonesia, Brazil, Pakistan,Bangladesh,Nigeria, Russia, Japan. Pakistan’s population 187,343,000 With an area equal to 0.6 % of the world, Pakistan has 2.3 % of the world population. Age structure of Pakistani population Under 15 = 35.4% 15-64 years = 60.4% Above 65 years = 4.2% Population having access to clean drinking water 96% urban and 89% rural (WHO& UNICEF Joint Monitoring programme 2004) But house connections to 49% & 15% respectively Population having access to improved methods of sanitation 92% urban and 41% rural (WHO& UNICEF Joint Monitoring programme 2004) but sewerage system is available only to 40% & 6% respectively
  • 18. HEALTH SECTOR TARGETS 2000-01 Target for 2025 •Percentage of children 51 100 below 1 year fully immunized •Percentage of expectant mothers 40 100 fully immunized against tetanus •Trained personnel attending 30 100 pregnancy & child health •Population with access to Health Services 65 100 •Hospital beds per 1,000 people 0.645 1 •Doctors per 1000 population 0.8 10 •Dental Surgeons per 10,000 people 0.33 1 •Nurses per 10,000 population 2.09 4.5
  • 19. Source: CIA World Fact book July 12 2011