Libro1
•Télécharger en tant que XLSX, PDF•
0 j'aime•80 vues

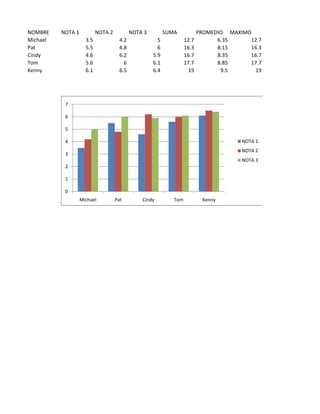
This document contains a table listing the names of 5 students (Michael, Pat, Cindy, Tom, Kenny), their grades on 3 tests (Nota 1, Nota 2, Nota 3), the sum and average of their grades, and the highest and lowest grades. The bar graph below the table visually compares the students' grades on the first test.