Financial Analysis - Barrick Gold Corporation is an international gold company with operating mines and development projects in the United States, Canada, South America, Australia, and Africa
•
1 j'aime•782 vues

- Barrick Gold Corporation is an international gold mining company headquartered in Toronto, Canada. It operates mines in the United States, Canada, South America, Australia, and Africa. - The company's largest shareholders are BlackRock (8.77% ownership) and Capital Group Companies (5.82% ownership). Most of Barrick's shares are owned by institutional investors based in the United States and Canada. - Barrick reported revenues of $12.56 billion in 2012 from its gold and copper mining operations. It had over 18,000 employees as of the end of 2012.

Recommandé
Recommandé
Contenu connexe
Tendances
Tendances (20)
En vedette
Similaire à Financial Analysis - Barrick Gold Corporation is an international gold company with operating mines and development projects in the United States, Canada, South America, Australia, and Africa
Similaire à Financial Analysis - Barrick Gold Corporation is an international gold company with operating mines and development projects in the United States, Canada, South America, Australia, and Africa (20)
Plus de BCV
Plus de BCV (20)
Dernier
Dernier (20)
Financial Analysis - Barrick Gold Corporation is an international gold company with operating mines and development projects in the United States, Canada, South America, Australia, and Africa
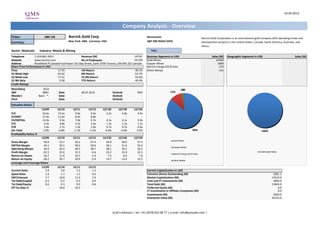
- 1. 24.04.2013 Ticker: Barrick Gold Corp Benchmark: Currency: New York: ABX, Currency: USD S&P 500 INDEX (SPX) Sector: Materials Industry: Metals & Mining Year: Telephone 1-416-861-9911 Revenue (M) Business Segments in USD Sales (M) Geographic Segments in USD Sales (M) Website www.barrick.com No of Employees Gold Mines 12564 Unallocated Sales 1 Address Brookfield Pl,CanadaTrustTower 161 Bay Street, Suite 3700 Toronto, ON M5J 2S1 Canada Copper Mines 1689 Share Price Performance in USD Barrick Energy (Oil & Gas) 153 Price 17.59 1M Return -40.1% Other Metals 141 52 Week High 42.62 6M Return -53.7% 52 Week Low 17.51 52 Wk Return -54.6% 52 Wk Beta 0.58 YTD Return -49.4% Credit Ratings Bloomberg IG10 S&P BBB+ Date 30.07.2012 Outlook NEG Moody's Baa1 *- Date - Outlook - Fitch - Date - Outlook - Valuation Ratios 12/09 12/10 12/11 12/12 12/13E 12/14E 12/15E P/E 16.6x 15.6x 9.8x 9.4x 5.2x 4.8x 4.9x EV/EBIT 17.0x 11.6x 8.4x 8.8x - - - EV/EBITDA 12.0x 9.3x 7.0x 6.7x 4.5x 4.1x 3.9x P/S 4.4x 4.8x 3.2x 2.4x 1.2x 1.2x 1.1x P/B 2.6x 2.7x 1.9x 1.6x 0.7x 0.7x 0.6x Div Yield 1.0% 0.8% 1.1% 2.1% 4.6% 4.6% 4.5% Profitability Ratios % 12/09 12/10 12/11 12/12 12/13E 12/14E 12/15E Gross Margin 40.0 53.1 56.2 47.4 56.8 58.9 57.3 EBITDA Margin 44.1 56.5 58.5 50.6 50.1 51.6 53.4 Operating Margin 30.9 45.4 48.5 38.7 38.1 39.2 36.5 Profit Margin -52.5 32.6 31.5 -4.6 23.2 23.9 22.3 Return on Assets -16.7 11.6 10.7 -1.4 7.5 8.2 7.6 Return on Equity -28.2 20.7 20.9 -2.9 14.7 13.6 12.5 Leverage and Coverage Ratios 12/09 12/10 12/11 12/12 Current Ratio 2.8 2.8 2.2 1.3 Current Capitalization in USD Quick Ratio 1.6 1.7 1.1 0.6 Common Shares Outstanding (M) 1001.1 EBIT/Interest 7.7 10.8 11.4 7.6 Market Capitalization (M) 17610.0 Tot Debt/Capital 0.3 0.2 0.3 0.4 Cash and ST Investments (M) 2093.0 Tot Debt/Equity 0.4 0.3 0.5 0.6 Total Debt (M) 13943.0 Eff Tax Rate % - 30.8 33.5 - Preferred Equity (M) 0.0 LT Investments in Affiliate Companies (M) 0.0 Investments (M) 2663.0 Enterprise Value (M) 32123.0 Barrick Gold Corporation is an international gold company with operating mines and development projects in the United States, Canada, South America, Australia, and Africa. ABX UN 14'547 26'140 Company Analysis - Overview 86% 12% 1%1% Gold Mines Copper Mines Barrick Energy (Oil & Gas) Other Metals 100% Unallocated Sales Q.M.S Advisors | tel: +41 (0)78 922 08 77 | e-mail: info@qmsadv.com |
- 2. Barrick Gold Corp Target price in USD Date Buy Hold Sell Date Price Target Price Broker Analyst Recommendation Target Date 29-Mar-13 55% 42% 3% 24-Apr-13 17.59 35.12 Sterne, Agee & Leach MICHAEL S DUDAS neutral 24-Apr-13 28-Feb-13 55% 42% 3% 23-Apr-13 17.59 35.12 HSBC PATRICK CHIDLEY overweight 43.00 23-Apr-13 31-Jan-13 52% 45% 3% 22-Apr-13 18.01 35.40 Salman Partners DAVID WEST buy 44.82 23-Apr-13 31-Dec-12 50% 47% 3% 19-Apr-13 18.17 37.87 Barclays FAROOQ HAMED equalweight 24.00 23-Apr-13 30-Nov-12 52% 45% 3% 18-Apr-13 17.98 38.16 Deutsche Bank JORGE M BERISTAIN hold 22.50 22-Apr-13 31-Oct-12 63% 34% 3% 17-Apr-13 17.65 38.18 RBC Capital Markets STEPHEN D WALKER sector perform 25.00 22-Apr-13 28-Sep-12 68% 29% 3% 16-Apr-13 18.86 38.18 Credit Suisse ANITA SONI outperform 38.00 22-Apr-13 31-Aug-12 71% 26% 3% 15-Apr-13 19.78 38.79 Stifel GEORGE J TOPPING buy 34.00 22-Apr-13 31-Jul-12 71% 26% 3% 12-Apr-13 22.62 39.45 Davenport & Co LLOYD T O'CARROLL buy 26.00 22-Apr-13 29-Jun-12 77% 23% 0% 11-Apr-13 24.73 39.84 Cormark Securities Inc. RICHARD GRAY market perform 25.32 22-Apr-13 31-May-12 77% 23% 0% 10-Apr-13 24.46 41.91 JPMorgan JOHN BRIDGES neutral 34.00 19-Apr-13 30-Apr-12 79% 21% 0% 9-Apr-13 26.69 41.99 Haywood Securities Inc. KERRY SMITH buy 42.56 16-Apr-13 8-Apr-13 26.33 41.99 TD Securities GREG BARNES hold 31.00 16-Apr-13 5-Apr-13 26.69 42.39 BMO Capital Markets DAVID HAUGHTON market perform 32.50 15-Apr-13 4-Apr-13 27.01 42.82 Canaccord Genuity Corp STEVEN BUTLER hold 31.00 15-Apr-13 3-Apr-13 26.70 42.91 Mackie Research Capital Corp. BARRY D ALLAN buy 33.56 12-Apr-13 2-Apr-13 28.29 43.27 CIBC World Markets ALEC KODATSKY sector perform 43.00 11-Apr-13 1-Apr-13 29.02 43.27 Macquarie TONY LESIAK neutral 33.16 11-Apr-13 29-Mar-13 29.40 43.27 GMP GEORGE V ALBINO buy 49.49 11-Apr-13 28-Mar-13 29.40 43.27 Veritas Investment Research Co PAWEL RAJSZEL buy 38.00 11-Apr-13 27-Mar-13 29.37 43.27 Cowen Securities LLC ADAM P GRAF hold 11-Apr-13 26-Mar-13 28.82 43.25 Jefferies PETER D WARD buy 45.00 21-Mar-13 25-Mar-13 29.01 43.25 Scotia Capital TANYA M JAKUSCONEK sector perform 39.00 21-Mar-13 22-Mar-13 29.38 43.25 EVA Dimensions CRAIG STERLING sell 26-Feb-13 21-Mar-13 29.61 43.25 Argus Research Corp WILLIAM V SELESKY hold 20-Feb-13 20-Mar-13 28.81 43.25 Hamburger Sparkasse INGO SCHMIDT buy 15-Feb-13 19-Mar-13 28.84 43.25 S&P Capital IQ LEO LARKIN buy 38.00 15-Feb-13 18-Mar-13 28.87 43.27 Morgan Stanley PARETOSH MISRA Equalwt/In-Line 20-Nov-12 15-Mar-13 28.62 43.27 Investec PIETER MARAIS hold 48.28 18-Mar-11 14-Mar-13 28.59 43.28 Company Analysis - Analysts Ratings Buy and Sell Recommendations vs Price and Target Price 79% 77% 77% 71% 71% 68% 63% 52% 50% 52% 55% 55% 21% 23% 23% 26% 26% 29% 34% 45% 47% 45% 42% 42% 0% 0% 0% 3% 3% 3% 3% 3% 3% 3% 3% 3% 0% 20% 40% 60% 80% 100% avr.12 mai.12 juin.12 juil.12 août.12 sept.12 oct.12 nov.12 déc.12 janv.13 févr.13 mars.13 BrokerRecommendation 0 10 20 30 40 50 60 70 80 Price Buy Hold Sell Price Target Price Brokers' Target Price 0 10 20 30 40 50 60 Sterne,Agee&Leach HSBC SalmanPartners Barclays DeutscheBank RBCCapitalMarkets CreditSuisse Stifel Davenport&Co CormarkSecuritiesInc. JPMorgan HaywoodSecuritiesInc. TDSecurities BMOCapitalMarkets CanaccordGenuityCorp MackieResearchCapitalCorp. CIBCWorldMarkets Macquarie GMP VeritasInvestmentResearch Co CowenSecuritiesLLC Jefferies ScotiaCapital EVADimensions ArgusResearchCorp HamburgerSparkasse S&PCapitalIQ MorganStanley Investec Q.M.S Advisors | tel: +41 (0)78 922 08 77 | e-mail: info@qmsadv.com |
- 3. 24.04.2013 Barrick Gold Corp Ownership Statistics Geographic Ownership Distribution Shares Outstanding (M) 1001.1 United States 62.11% Float 99.7% Canada 27.13% Short Interest (M) 6.4 Britain 3.51% Short Interest as % of Float 0.65% Germany 1.44% Days to Cover Shorts 0.84 Luxembourg 1.04% Institutional Ownership 80.49% Japan 0.86% Retail Ownership 19.25% Netherlands 0.84% Insider Ownership 0.26% Others 3.07% Institutional Ownership Distribution Investment Advisor 90.86% Hedge Fund Manager 3.79% Insurance Company 1.66% Bank 1.54% Pricing data is in USD Others 2.16% Top 20 Owners: Holder Name Position Position Change Market Value % of Ownership Report Date Source Country BLACKROCK 87'777'710 0 1'544'009'919 8.77% 31.03.2013 ULT-AGG UNITED STATES CAPITAL GROUP COMPAN 58'280'637 -23'472'640 1'025'156'405 5.82% 31.03.2013 ULT-AGG UNITED STATES VAN ECK ASSOCIATES C 33'799'228 -1'012'978 594'528'421 3.38% 23.04.2013 ULT-AGG UNITED STATES ROYAL BANK OF CANADA 30'078'073 3'795'193 529'073'304 3.00% 31.12.2012 ULT-AGG CANADA FMR LLC 20'600'402 -3'418'885 362'361'071 2.06% 28.02.2013 ULT-AGG UNITED STATES CI INVESTMENTS INC 17'663'919 771'337 310'708'335 1.76% 31.12.2012 MF-AGG CANADA BMO FINANCIAL CORP 17'095'925 -4'625'429 300'717'321 1.71% 31.03.2013 13F UNITED STATES ALLIANZ ASSET MANAGE 16'861'844 3'198'995 296'599'836 1.68% 31.03.2013 ULT-AGG GERMANY CIBC WORLD MARKETS I 14'810'763 38'951 260'521'321 1.48% 31.12.2012 13F CANADA BANK OF NEW YORK MEL 13'797'555 -4'803'846 242'698'992 1.38% 31.03.2013 13F UNITED STATES TORONTO DOMINION BAN 13'586'744 1'359'379 238'990'827 1.36% 31.12.2012 13F CANADA TD ASSET MANAGEMENT 13'422'922 866'236 236'109'198 1.34% 31.12.2012 13F CANADA INSTITUTIONAL CAPITA 12'729'638 -401'738 223'914'332 1.27% 31.12.2012 13F UNITED STATES FRANKLIN RESOURCES 10'867'001 372'180 191'150'548 1.09% 31.01.2013 ULT-AGG UNITED STATES WELLINGTON MANAGEMEN 10'758'391 353'171 189'240'098 1.07% 31.12.2012 13F UNITED STATES IA CLARINGTON INVEST 10'376'354 -2'442'600 182'520'067 1.04% 31.12.2012 MF-AGG CANADA CIBC GLOBAL ASSET MA 10'027'723 1'562'724 176'387'648 1.00% 31.12.2012 13F CANADA HARTFORD INVESTMENT 9'553'806 6'763'418 168'051'448 0.95% 28.02.2013 MF-AGG UNITED STATES MACKENZIE FINANCIAL 9'250'600 -491'846 162'718'054 0.92% 31.12.2012 13F CANADA OLDFIELD PARTNERS LL 8'964'554 1'678'488 157'686'505 0.90% 31.03.2013 13F BRITAIN Top 5 Insiders: Holder Name Position Position Change Market Value % of Ownership Report Date Source MUNK PETER 1'990'100 301'600 35'005'859 0.20% 19.11.2012 SEDI DAVID BIRCH CHARLES WILLIA 285'220 5'017'020 0.03% 01.08.2012 SEDI BECK HOWARD L 169'144 2'975'243 0.02% 01.03.2013 Proxy REGENT AARON W 60'000 35'000 1'055'400 0.01% 28.02.2012 SEDI SOKALSKY JAMIE C 52'728 688 927'486 0.01% 15.01.2013 SEDI Company Analysis - Ownership Ownership Type 81% 19% 0% Institutional Ownership Retail Ownership Insider Ownership Geographic Ownership 62% 3% 4% 1% 1% 1% 1% 27% United States Canada Britain Germany Luxembourg Japan Netherlands Others Institutional Ownership 90% 2% 2%2% 4% Investment Advisor Hedge Fund Manager Insurance Company Bank Others TOP 20 ALL Q.M.S Advisors | tel: +41 (0)78 922 08 77 | e-mail: info@qmsadv.com |
- 4. Barrick Gold Corp Financial information is in USD (M) Periodicity: 12/02 12/03 12/04 12/05 12/06 12/07 12/08 12/09 12/10 12/11 12/12 12/13E 12/14E 12/15E Income Statement Revenue 1'967 2'035 1'932 2'350 5'630 6'332 7'613 8'136 11'001 14'236 14'547 14'143 15'194 15'344 - Cost of Goods Sold 1'590 1'594 1'499 1'641 3'476 4'198 4'663 4'880 5'162 6'240 7'654 Gross Income 377 441 433 709 2'154 2'134 2'950 3'256 5'839 7'996 6'893 8'028 8'953 8'792 - Selling, General & Admin Expenses 168 210 212 212 648 727 897 740 840 1'088 1'257 (Research & Dev Costs) 104 137 119 188 242 85 0 0 0 Operating Income 209 231 221 497 1'506 1'407 2'053 2'516 4'999 6'908 5'636 5'383 5'962 5'595 - Interest Expense 57 44 19 7 126 113 21 57 180 199 177 - Foreign Exchange Losses (Gains) 0 0 0 0 0 0 0 0 0 0 0 - Net Non-Operating Losses (Gains) -25 -35 157 35 -176 -143 537 6'176 -248 -115 6'372 Pretax Income 177 222 45 455 1'556 1'437 1'495 -3'717 5'067 6'824 -913 4'931 5'468 5'089 - Income Tax Expense -16 5 -203 60 348 341 594 648 1'561 2'287 -236 Income Before XO Items 193 217 248 395 1'208 1'096 901 -4'365 3'506 4'537 -677 - Extraordinary Loss Net of Tax 0 17 0 -6 -297 -9 104 -97 -124 0 0 - Minority Interests 0 0 0 0 -1 -14 12 6 48 53 -12 Diluted EPS Before XO Items 0.36 0.40 0.46 0.73 1.42 1.27 1.01 (4.84) 3.47 4.48 (0.66) Net Income Adjusted* 235 162 87 296 1'419 1'786 1'739 1'810 3'279 4'670 3'830 3'283 3'631 3'425 EPS Adjusted 0.42 0.40 0.46 0.56 1.67 2.04 1.59 2.00 3.32 4.67 3.82 3.40 3.68 3.60 Dividends Per Share 0.22 0.22 0.22 0.22 0.22 0.30 0.40 0.40 0.44 0.51 0.75 0.80 0.81 0.79 Payout Ratio % 61.7 54.4 47.6 29.9 15.8 23.5 39.3 12.6 11.4 0.24 0.22 0.22 Total Shares Outstanding 542 535 534 538 864 870 873 984 999 1'000 1'001 Diluted Shares Outstanding 541 539 534 538 855 879 885 903 997 1'001 1'001 EBITDA 728 753 673 924 2'241 2'461 3'010 3'589 6'211 8'327 7'358 7'081 7'838 8'189 *Net income excludes extraordinary gains and losses and one-time charges. Equivalent Estimates Company Analysis - Financials I/IV Fiscal Year Q.M.S Advisors | tel: +41 (0)78 922 08 77 | e-mail: info@qmsadv.com |
- 5. Periodicity: 12/02 12/03 12/04 12/05 12/06 12/07 12/08 12/09 12/10 12/11 12/12 12/13E 12/14E 12/15E Balance Sheet Total Current Assets 1352 1368 1959 1748 4796 4299 4112 4938 7071 6545 5863 + Cash & Near Cash Items 1'044 970 1'398 1'037 3'043 2'207 1'437 2'564 3'968 2'745 2'093 + Short Term Investments 30 0 0 0 0 0 0 0 0 0 0 + Accounts & Notes Receivable 72 56 58 54 234 256 197 251 370 426 449 + Inventories 206 164 215 402 931 1'129 1'278 1'540 1'798 2'498 2'695 + Other Current Assets 0 178 288 255 588 707 1'200 583 935 876 626 Total Long-Term Assets 3'909 3'990 4'328 5'114 16'714 17'652 20'049 22'137 27'566 42'339 41'419 + Long Term Investments 0 0 0 0 646 1'227 60 92 171 161 78 Gross Fixed Assets 7'045 7'073 7'778 8'916 15'309 16'488 20'170 22'802 29'417 42'050 48'988 Accumulated Depreciation 3'723 3'945 4'387 4'770 6'919 7'903 8'665 9'677 11'527 13'071 20'271 + Net Fixed Assets 3'322 3'128 3'391 4'146 8'390 8'585 11'505 13'125 17'890 28'979 28'717 + Other Long Term Assets 587 862 937 968 7'678 7'840 8'484 8'920 9'505 13'199 12'624 Total Current Liabilities 483 364 420 560 1'852 1'296 1'844 1'773 2'491 2'911 4'415 + Accounts Payable 164 245 335 386 686 808 953 1'221 1'511 2'083 2'265 + Short Term Borrowings 0 0 31 80 863 233 206 54 14 196 1'848 + Other Short Term Liabilities 319 119 54 94 303 255 685 498 966 632 302 Total Long Term Liabilities 1'444 1'500 2'293 2'452 5'403 5'317 6'858 9'755 10'929 20'419 18'359 + Long Term Borrowings 761 719 1'655 1'721 3'244 3'153 4'350 6'281 6'624 13'173 12'095 + Other Long Term Borrowings 683 781 638 731 2'159 2'164 2'508 3'474 4'305 7'246 6'264 Total Liabilities 1'927 1'864 2'713 3'012 7'255 6'613 8'702 11'528 13'420 23'330 22'774 + Long Preferred Equity 0 0 0 0 0 0 0 0 0 0 0 + Minority Interest 0 0 0 0 56 82 182 484 1'745 2'191 2'663 + Share Capital & APIC 4'148 4'115 4'129 4'222 13'106 13'273 13'372 17'390 17'820 17'892 17'926 + Retained Earnings & Other Equity -814 -621 -555 -372 1'093 1'983 1'905 -2'327 1'652 5'471 3'919 Total Shareholders Equity 3'334 3'494 3'574 3'850 14'255 15'338 15'459 15'547 21'217 25'554 24'508 Total Liabilities & Equity 5'261 5'358 6'287 6'862 21'510 21'951 24'161 27'075 34'637 48'884 47'282 Book Value Per Share 6.15 6.53 6.70 7.16 16.43 17.54 17.50 15.30 19.50 23.35 21.82 23.82 26.15 29.00 Tangible Book Value Per Share 9.57 10.74 11.37 9.96 12.92 13.16 12.54 Company Analysis - Financials II/IV Q.M.S Advisors | tel: +41 (0)78 922 08 77 | e-mail: info@qmsadv.com |
- 6. Periodicity: 12/02 12/03 12/04 12/05 12/06 12/07 12/08 12/09 12/10 12/11 12/12 12/13E 12/14E 12/15E Cash Flows Net Income 193 200 248 401 1'506 1'119 785 -4'274 3'582 4'484 -665 3'328 3'775 3'709 + Depreciation & Amortization 519 522 452 427 735 1'054 957 1'073 1'212 1'419 1'722 + Other Non-Cash Adjustments -182 -101 -75 -19 -131 -168 882 1'251 172 120 4'998 + Changes in Non-Cash Capital 59 -102 -116 -83 41 -252 -370 -372 -381 -708 -616 Cash From Operating Activities 589 519 509 726 2'151 1'753 2'254 -2'322 4'585 5'315 5'439 + Disposal of Fixed Assets 0 40 43 8 8 100 185 10 61 48 18 + Capital Expenditures -228 -322 -824 -1'104 -1'087 -1'046 -1'749 -2'351 -3'778 -4'973 -6'369 -5'935 -4'128 -2'524 + Increase in Investments 0 0 0 0 -245 0 0 0 0 0 0 + Decrease in Investments 0 0 0 0 46 0 0 0 0 0 0 + Other Investing Activities 170 -52 -40 -84 2'473 -616 -2'356 -74 -913 -7'902 -170 Cash From Investing Activities -58 -334 -821 -1'180 1'195 -1'562 -3'920 -2'415 -4'630 -12'827 -6'521 + Dividends Paid -119 -118 -118 -118 -191 -261 -349 -369 -436 -509 -750 + Change in Short Term Borrowings 0 0 0 0 0 0 0 0 0 0 0 + Increase in Long Term Borrowings 0 0 973 179 2'189 408 2'717 2'154 782 6'648 2'000 + Decrease in Long Term Borrowings -25 -23 -41 -59 -1'581 -1'128 -1'603 -397 -149 -380 -1'462 + Increase in Capital Stocks 83 29 49 92 74 142 74 3'950 1'011 57 18 + Decrease in Capital Stocks 0 -154 -95 0 0 0 0 0 0 0 0 + Other Financing Activities 0 7 -28 -1 -1'831 -188 57 526 241 473 624 Cash From Financing Activities -61 -259 740 93 -1'340 -1'027 896 5'864 1'449 6'289 430 Net Changes in Cash 470 -74 428 -361 2'006 -836 -770 1'127 1'404 -1'223 -652 Free Cash Flow (CFO-CAPEX) 361 197 -315 -378 1'064 707 505 -4'673 807 342 -930 -941 1'348 3'437 Free Cash Flow To Firm 240 -372 1'162 793 518 932 474 Free Cash Flow To Equity 336 214 660 -250 1'680 87 1'804 -2'906 1'501 6'658 -374 Free Cash Flow per Share 0.67 0.37 -0.59 -0.71 1.26 0.82 0.58 -5.17 0.82 0.34 -0.93 Company Analysis - Financials III/IV Q.M.S Advisors | tel: +41 (0)78 922 08 77 | e-mail: info@qmsadv.com |
- 7. Periodicity: 12/02 12/03 12/04 12/05 12/06 12/07 12/08 12/09 12/10 12/11 12/12 12/13E 12/14E 12/15E Ratio Analysis Valuation Ratios Price Earnings 41.8x 102.8x 150.8x 50.7x 22.0x 33.2x 20.2x 16.6x 15.6x 9.8x 9.4x 5.2x 4.8x 4.9x EV to EBIT 38.6x 51.3x 59.6x 31.7x 18.4x 27.0x 17.2x 17.0x 11.6x 8.4x 8.8x EV to EBITDA 11.1x 15.7x 19.6x 17.1x 12.4x 15.4x 11.7x 12.0x 9.3x 7.0x 6.7x 4.5x 4.1x 3.9x Price to Sales 4.2x 6.0x 6.7x 6.4x 4.6x 5.8x 4.2x 4.4x 4.8x 3.2x 2.4x 1.2x 1.2x 1.1x Price to Book 2.5x 3.5x 3.6x 3.9x 1.9x 2.4x 2.1x 2.6x 2.7x 1.9x 1.6x 0.7x 0.7x 0.6x Dividend Yield 1.4% 1.0% 0.9% 0.8% 0.7% 0.7% 1.1% 1.0% 0.8% 1.1% 2.1% 4.6% 4.6% 4.5% Profitability Ratios Gross Margin 19.2% 21.7% 22.4% 30.2% 38.3% 33.7% 38.7% 40.0% 53.1% 56.2% 47.4% 56.8% 58.9% 57.3% EBITDA Margin 37.0% 37.0% 34.8% 39.3% 39.8% 38.9% 39.5% 44.1% 56.5% 58.5% 50.6% 50.1% 51.6% 53.4% Operating Margin 10.6% 11.4% 11.4% 21.1% 26.7% 22.2% 27.0% 30.9% 45.4% 48.5% 38.7% 38.1% 39.2% 36.5% Profit Margin 9.8% 9.8% 12.8% 17.1% 26.7% 17.7% 10.3% -52.5% 32.6% 31.5% -4.6% 23.2% 23.9% 22.3% Return on Assets 3.7% 3.8% 4.3% 6.1% 10.6% 5.1% 3.4% -16.7% 11.6% 10.7% -1.4% 7.5% 8.2% 7.6% Return on Equity 5.9% 5.9% 7.0% 10.8% 16.7% 7.6% 5.1% -28.2% 20.7% 20.9% -2.9% 14.7% 13.6% 12.5% Leverage & Coverage Ratios Current Ratio 2.80 3.76 4.66 3.12 2.59 3.32 2.23 2.79 2.84 2.25 1.33 Quick Ratio 2.37 2.82 3.47 1.95 1.77 1.90 0.89 1.59 1.74 1.09 0.58 Interest Coverage Ratio (EBIT/I) 3.67 5.25 3.68 3.98 6.61 5.94 8.45 7.72 10.75 11.38 7.58 Tot Debt/Capital 0.19 0.17 0.32 0.32 0.22 0.18 0.23 0.29 0.24 0.34 0.36 Tot Debt/Equity 0.23 0.21 0.47 0.47 0.29 0.22 0.29 0.41 0.31 0.52 0.57 Others Asset Turnover 0.38 0.38 0.33 0.36 0.40 0.29 0.33 0.32 0.36 0.34 0.30 Accounts Receivable Turnover 30.26 31.80 33.89 41.96 39.10 25.84 33.61 36.32 35.43 35.77 33.25 Accounts Payable Turnover 4.59 7.59 5.34 5.07 7.47 5.88 5.47 4.73 3.97 3.86 3.61 Inventory Turnover 7.41 8.62 7.91 5.32 5.22 4.08 3.87 3.46 3.09 2.91 2.95 Effective Tax Rate 2.3% 13.2% 22.4% 23.7% 39.7% 30.8% 33.5% Company Analysis - Financials IV/IV Q.M.S Advisors | tel: +41 (0)78 922 08 77 | e-mail: info@qmsadv.com |
- 8. BARRICK GOLD CRP NEWMONT MINING GOLDCORP INC KINROSS GOLD ANGLOGOLD ASHANT TECK RESOURCES- B IAMGOLD CORP FREEPORT- MCMORAN BHP BILLITON LTD VALE SA-PF RIO TINTO LTD AGNICO-EAGLE MIN BRIGUS GOLD CORP DRDGOLD LTD HARMONY GOLD MNG 12/2011 12/2012 12/2012 12/2012 12/2012 12/2012 12/2012 12/2012 06/2012 12/2012 12/2012 12/2012 12/2012 06/2012 06/2012 43.30 57.93 46.31 10.98 31'979.00 39.90 16.45 43.65 39.34 43.09 72.30 57.00 1.06 755.00 8'951.00 06.06.2012 21.09.2012 21.09.2012 04.10.2012 04.06.2012 10.01.2013 05.10.2012 14.09.2012 20.02.2013 02.01.2013 14.02.2013 31.10.2012 21.09.2012 12.02.2013 06.06.2012 17.51 31.77 27.74 5.11 16'133.00 24.10 4.72 27.24 30.09 29.68 48.37 31.55 0.55 449.00 4'201.00 17.04.2013 23.04.2013 15.04.2013 17.04.2013 18.04.2013 23.04.2013 18.04.2013 18.04.2013 12.07.2012 17.04.2013 30.08.2012 18.04.2013 17.04.2013 31.08.2012 18.04.2013 3'915'086 10'160'819 4'271'089 8'162'503 1'494'238 9'034'012 5'331'897 19'287'262 16'783'219 25'425'100 6'203'716 1'115'004 357'616 220'282 994'151 17.59 32.43 28.44 5.55 16'769.00 25.60 5.09 28.52 31.70 31.87 54.68 32.83 0.61 611.00 4'296.00 -59.4% -44.0% -38.6% -49.5% -47.6% -35.8% -69.1% -34.7% -19.4% -26.0% -24.4% -42.4% -42.5% -19.1% -52.0% 0.5% 2.1% 2.5% 8.6% 3.9% 6.2% 7.8% 4.7% 5.4% 7.4% 13.0% 4.1% 10.9% 36.1% 2.3% 1'001.1 496.7 811.5 1'140.1 384.9 582.3 376.5 949.0 5'297.6 5'153.4 1'847.0 172.1 231.4 385.4 431.6 17'610 16'155 23'086 6'335 64'610 14'926 1'917 27'081 158'638 175'975 86'882 5'663 141 2'355 18'699 13'943.0 6'298.0 783.0 2'632.6 30'376.0 7'195.0 641.4 3'527.0 28'330.0 61'855.9 26'819.0 843.0 93.2 30.7 1'844.0 - - - - - - - - - - - - - - - 2'663.0 3'175.0 213.0 75.5 186.5 176.0 76.7 3'768.0 1'215.0 3'245.0 11'156.0 - - 136.7 - 2'093.0 1'647.0 918.0 1'982.7 7'562.2 3'267.0 813.5 3'705.0 4'781.0 11'918.2 7'320.0 351.3 29.8 298.5 1'773.0 32'123 23'981 22'586 6'901 87'610 19'514 1'773 31'487 194'666 229'158 119'939 6'013 201 2'397 18'561 LFY 14'547.0 9'868.0 5'435.0 4'311.4 52'160.3 10'343.0 1'670.0 18'010.0 72'226.0 93'511.5 50'967.0 1'917.7 117.7 1'764.2 15'169.0 LTM 14'340.0 9'868.0 5'435.0 4'311.4 52'152.1 10'126.0 1'670.0 17'988.0 66'950.0 93'511.5 50'967.0 1'917.7 117.7 1'959.2 16'047.0 CY+1 14'142.9 9'805.7 5'611.5 4'181.4 63'271.7 9'828.8 1'649.1 21'856.1 67'569.0 97'241.9 55'585.9 1'819.7 156.5 2'178.3 17'078.8 CY+2 15'194.3 11'369.3 6'971.6 4'446.4 73'396.4 10'752.2 1'820.9 23'601.6 73'914.3 101'462.8 61'445.4 2'105.1 168.0 2'479.2 20'966.1 LFY 3.4x 3.1x 5.5x 2.7x 2.4x 2.1x 2.5x 2.0x 3.3x 2.9x 3.1x 5.0x 2.4x 1.5x 2.1x LTM 3.4x 3.1x 5.5x 2.7x 2.3x 2.1x 2.5x 2.0x 3.5x 2.9x 3.1x 5.0x 2.4x 1.3x 2.0x CY+1 2.3x 2.5x 4.2x 1.7x 1.4x 2.0x 1.3x 1.8x 2.9x 2.4x 2.2x 3.4x - 1.0x 1.1x CY+2 2.1x 2.1x 3.3x 1.7x 1.1x 1.8x 1.4x 1.6x 2.6x 2.3x 1.9x 2.9x - 0.7x 0.9x LFY 7'358.0 4'169.0 2'798.0 1'962.2 19'105.5 3'736.0 710.1 6'934.0 33'421.0 34'366.5 15'486.0 787.4 48.5 370.8 4'222.0 LTM 7'358.0 4'169.0 2'798.0 1'962.2 19'105.5 3'508.0 710.1 6'617.0 27'133.0 34'366.5 15'486.0 791.4 48.5 399.7 3'562.0 CY+1 7'080.5 4'001.6 2'881.3 1'822.8 25'535.3 3'245.5 670.4 9'267.7 28'726.6 44'120.2 21'006.8 753.2 82.7 547.3 4'778.0 CY+2 7'838.1 4'996.2 3'967.6 2'151.9 31'172.8 3'945.0 780.4 10'831.8 33'552.1 44'434.4 23'251.3 954.9 100.2 762.7 6'956.0 LFY 6.7x 7.4x 10.7x 6.0x 6.5x 5.7x 5.9x 5.2x 7.1x 7.9x 10.2x 12.1x 5.7x 7.0x 7.6x LTM 6.7x 7.4x 10.7x 6.0x 6.3x 6.0x 5.9x 5.4x 8.7x 7.9x 10.2x 12.0x 5.7x 6.5x 9.0x CY+1 4.7x 6.1x 8.2x 4.0x 3.4x 6.1x 3.3x 4.2x 6.7x 5.2x 5.7x 8.2x - 3.8x 3.8x CY+2 4.2x 4.8x 5.8x 3.4x 2.6x 5.0x 3.3x 3.5x 5.7x 5.3x 5.0x 6.5x - 2.4x 2.7x LFY 3.74 3.78 1.99 0.77 21.85 2.59 0.89 3.27 3.61 4.30 4.06 1.89 0.07 0.49 4.62 LTM 3.30 3.77 1.89 0.77 24.22 2.33 0.93 2.95 1.83 1.88 -1.63 2.08 0.07 0.79 4.95 CY+1 3.40 3.17 1.62 0.49 24.30 2.14 0.56 3.70 2.53 4.56 5.72 1.34 0.13 0.82 4.77 CY+2 3.68 3.98 2.29 0.64 29.46 2.79 0.69 4.22 3.05 4.39 6.62 1.83 0.16 0.93 7.08 LFY 5.3x 8.6x 14.6x 7.0x 6.9x 11.0x 5.3x 9.7x 17.9x 16.9x - 15.4x 8.5x 7.7x 8.7x LTM 5.3x 8.6x 14.6x 7.0x 6.8x 11.0x 5.3x 9.7x 11.7x 7.5x - 15.4x 8.5x 8.0x 10.8x CY+1 5.2x 10.2x 17.1x 11.0x 6.9x 12.0x 8.9x 7.7x 12.9x 7.0x 9.8x 23.8x 4.6x 7.5x 9.0x CY+2 4.8x 8.1x 12.1x 8.5x 5.7x 9.2x 7.2x 6.8x 10.7x 7.3x 8.5x 17.5x 3.8x 6.5x 6.1x 1 Year 2.2% (4.7%) 1.4% 12.2% (4.1%) (10.2%) (0.2%) (13.7%) 0.7% (8.3%) (15.8%) 5.3% 63.8% 27.9% 30.8% 5 Year 13.6% 16.7% 19.3% 34.9% 24.6% 9.2% 21.9% 4.9% 6.8% 25.1% 11.2% 54.5% - 7.9% 19.2% 1 Year (11.6%) (19.2%) 19.8% 1.9% (17.8%) (30.4%) (9.5%) (31.8%) (12.1%) (39.8%) (41.1%) 4.6% 239.9% 64.2% 79.4% 5 Year 24.5% 19.4% 21.0% 40.7% 86.6% 5.7% 30.2% (2.4%) 8.0% 2.8% 8.1% 31.6% 60.5% 12.9% 16.7% LTM 50.6% 42.2% 51.5% 45.5% 36.6% 34.6% 42.5% 36.8% 40.5% 36.8% 30.4% 41.3% 41.2% 20.4% 22.2% CY+1 50.1% 40.8% 51.3% 43.6% 40.4% 33.0% 40.7% 42.4% 42.5% 45.4% 37.8% 41.4% 52.8% 25.1% 28.0% CY+2 51.6% 43.9% 56.9% 48.4% 42.5% 36.7% 42.9% 45.9% 45.4% 43.8% 37.8% 45.4% 59.6% 30.8% 33.2% Total Debt / Equity % 63.8% 45.7% 3.4% 26.7% 65.8% 40.4% 17.2% 20.1% 43.0% 40.6% 57.2% 24.7% 40.1% 2.0% 5.4% Total Debt / Capital % 36.3% 27.1% 3.3% 21.0% 39.6% 28.6% 14.4% 14.2% 29.7% 28.4% 31.6% 19.8% 28.6% 1.8% 5.1% Total Debt / EBITDA 1.895x 1.511x 0.280x 1.342x 1.540x 2.094x 0.903x 1.525x 1.308x 1.800x 1.732x 1.065x 1.922x 0.421x 0.666x Net Debt / EBITDA 1.610x 1.116x -0.048x 0.331x 1.156x 1.253x -0.242x 0.075x 1.120x 1.453x 1.259x 0.621x 1.307x -0.575x -0.039x EBITDA / Int. Expense 9.890x 11.711x 93.267x 13.838x 10.074x 6.026x 38.384x 25.970x 44.266x 14.114x 14.848x 13.603x 5.338x 23.648x 14.264x S&P LT Credit Rating BBB+ BBB+ BBB+ BBB- BBB- BBB BB- BBB A+ A- A- NR - - - S&P LT Credit Rating Date 30.07.2012 11.08.2008 01.06.2009 15.08.2011 10.12.2012 16.04.2010 10.09.2012 29.07.2011 15.11.2010 23.11.2011 18.04.2011 12.03.2003 - - - Moody's LT Credit Rating Baa1 *- Baa1 Baa2 Baa3 - Baa2 - Baa3 (P)A1 Baa2 - WR - - - Moody's LT Credit Rating Date 17.04.2013 26.07.2010 13.03.2013 15.08.2011 - 17.11.2010 - 13.10.2010 15.11.2010 29.08.2008 - 05.03.2002 - - - 52-Week High Date 52-Week Low Latest Fiscal Year: 52-Week High Total Debt Market Capitalization Daily Volume 52-Week Low % Change Current Price (4/dd/yy) 52-Week High % Change Cash and Equivalents EBITDA EV/EBITDA Enterprise Value Valuation Preferred Stock 52-Week Low Date Minority Interest Total Common Shares (M) P/E Revenue Growth Total Revenue EV/Total Revenue EPS EBITDA Growth EBITDA Margin Credit Ratings Leverage/Coverage Ratios Company Analysis - Peers Comparision Q.M.S Advisors | tel: +41 (0)78 922 08 77 | e-mail: info@qmsadv.com |