Financial analysis chesapeake energy corp - chesapeake energy corporation produces oil and natural gas. the company's operations are focused on discovering, developing and acquiring conventional and unconventional natural gas reserves
•
1 j'aime•226 vues


Recommandé
Recommandé
Contenu connexe
Tendances
Tendances (19)
En vedette
Similaire à Financial analysis chesapeake energy corp - chesapeake energy corporation produces oil and natural gas. the company's operations are focused on discovering, developing and acquiring conventional and unconventional natural gas reserves
Similaire à Financial analysis chesapeake energy corp - chesapeake energy corporation produces oil and natural gas. the company's operations are focused on discovering, developing and acquiring conventional and unconventional natural gas reserves (20)
Plus de BCV
Plus de BCV (20)
Financial analysis chesapeake energy corp - chesapeake energy corporation produces oil and natural gas. the company's operations are focused on discovering, developing and acquiring conventional and unconventional natural gas reserves
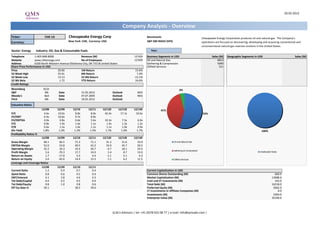
- 1. 20.02.2013 Company Analysis - Overview Ticker: CHK US Chesapeake Energy Corp Benchmark: Chesapeake Energy Corporation produces oil and natural gas. The Company's Currency: New York: CHK, Currency: USD S&P 500 INDEX (SPX) operations are focused on discovering, developing and acquiring conventional and unconventional natural gas reserves onshore in the United States. Sector: Energy Industry: Oil, Gas & Consumable Fuels Year: Telephone 1-405-848-8000 Revenue (M) 12'424 Business Segments in USD Sales (M) Geographic Segments in USD Sales (M) Website www.chkenergy.com No of Employees 12'600 Oil and Natural Gas 6813 Unallocated Sales 1 Address 6100 North Western Avenue Oklahoma City, OK 73118 United States Gathering & Compression 5090 Share Price Performance in USD Oilfield Services 521 Price 20.60 1M Return 15.6% 52 Week High 25.61 6M Return 7.2% 52 Week Low 13.13 52 Wk Return -15.1% 52 Wk Beta 1.72 YTD Return 24.6% Credit Ratings Bloomberg IG10 4% S&P BB- Date 15.05.2012 Outlook NEG Moody's Ba3 Date 07.07.2005 Outlook NEG Fitch BB- Date 18.05.2012 Outlook - Valuation Ratios 12/08 12/09 12/10 12/11 12/12E 12/13E 12/14E 41% P/E 4.6x 10.0x 8.8x 8.0x 42.4x 17.1x 10.6x 55% EV/EBIT 6.4x 10.6x 9.7x 8.9x - - - EV/EBITDA 4.0x 6.8x 6.6x 5.6x 10.3x 7.5x 6.0x P/S 0.8x 1.9x 1.6x 1.1x 1.4x 1.3x 1.2x P/B 0.6x 1.5x 1.4x 1.1x 1.1x 1.0x 0.9x Div Yield 1.8% 1.2% 1.2% 1.5% 1.7% 1.6% 1.7% 100% Profitability Ratios % 12/08 12/09 12/10 12/11 12/12E 12/13E 12/14E Gross Margin 68.1 66.5 71.3 71.1 31.2 31.6 33.9 Oil and Natural Gas EBITDA Margin 52.0 53.8 49.5 42.2 33.9 45.7 50.2 Operating Margin 32.2 34.3 33.4 26.7 -4.7 18.1 24.5 Gathering & Compression Profit Margin 5.6 -70.3 17.7 14.0 2.4 8.7 13.0 Unallocated Sales Return on Assets 1.7 -17.0 5.3 4.4 -1.1 3.1 4.3 Return on Equity 3.6 -42.6 14.4 12.2 1.1 6.2 11.5 Oilfield Services Leverage and Coverage Ratios 12/08 12/09 12/10 12/11 Current Ratio 1.2 0.9 0.7 0.4 Current Capitalization in USD Quick Ratio 0.8 0.6 0.5 0.4 Common Shares Outstanding (M) 660.9 EBIT/Interest 4.1 3.8 4.6 4.3 Market Capitalization (M) 13688.6 Tot Debt/Capital 0.4 0.5 0.5 0.4 Cash and ST Investments (M) 142.0 Tot Debt/Equity 0.8 1.0 0.8 0.6 Total Debt (M) 16218.0 Eff Tax Rate % 39.1 - 38.5 39.0 Preferred Equity (M) 3062.0 LT Investments in Affiliate Companies (M) 0.0 Investments (M) 2364.0 Enterprise Value (M) 35190.6 Q.M.S Advisors | tel: +41 (0)78 922 08 77 | e-mail: info@qmsadv.com |
- 2. Company Analysis - Analysts Ratings Chesapeake Energy Corp Target price in USD Broker Recommendation Buy and Sell Recommendations vs Price and Target Price Price Brokers' Target Price 45 30 100% 6% 3% 3% 3% 3% 3% 8% 6% 6% 11% 11% 11% 40 25 80% 35 20 15 41% 41% 42% 49% 56% 56% 56% 60% 62% 30 63% 62% 62% 10 60% 25 5 20 40% 0 Brean Murray Carret & Co BMO Capital Markets Barclays Simmons & Company Canaccord Genuity Corp RBC Capital Markets FBR Capital Markets Raymond James Credit Agricole Securities Alembic Global Advisors Capital One Southcoast, Inc. Global Hunter Securities SunTrust Robinson Humphrey Sanford C. Bernstein & Co Credit Suisse JPMorgan Macquarie Oppenheimer & Co Stifel Nicolaus Sterne, Agee & Leach Argus Research Corp EVA Dimensions Tudor Pickering & Co Johnson Rice & Co Goldman Sachs Deutsche Bank Jefferies Susquehanna Financial Group Ladenburg Thalmann & Co Robert W. Baird & Co Howard Weil Inc Wells Fargo Securities, LLC Wunderlich Securities 15 49% 49% 47% 10 20% 43% 39% 41% 41% 37% 34% 35% 32% 32% 5 0% 0 févr.12 mars.12 avr.12 mai.12 juin.12 juil.12 août.12 sept.12 oct.12 nov.12 déc.12 janv.13 Buy Hold Sell Price Target Price Date Buy Hold Sell Date Price Target Price Broker Analyst Recommendation Target Date 31-Jan-13 35% 62% 3% 20-Feb-13 20.58 22.88 Sanford C. Bernstein & Co BOB BRACKETT market perform 22.00 20-Feb-13 31-Dec-12 32% 62% 6% 19-Feb-13 20.36 22.88 Jefferies BIJU Z PERINCHERIL buy 26.00 19-Feb-13 30-Nov-12 32% 62% 6% 18-Feb-13 20.01 22.88 Stifel Nicolaus AMIR ARIF buy 25.00 15-Feb-13 31-Oct-12 34% 63% 3% 15-Feb-13 20.01 22.88 Barclays JEFFREY W ROBERTSON equalweight 24.00 15-Feb-13 28-Sep-12 37% 60% 3% 14-Feb-13 20.40 22.88 Brean Murray Carret & Co RAYMOND DEACON hold 13-Feb-13 31-Aug-12 41% 56% 3% 13-Feb-13 20.57 22.88 SunTrust Robinson Humphrey NEAL DINGMANN neutral 19.00 11-Feb-13 31-Jul-12 41% 56% 3% 12-Feb-13 20.01 22.88 BMO Capital Markets DAN MCSPIRIT market perform 22.00 4-Feb-13 29-Jun-12 39% 56% 6% 11-Feb-13 20.05 22.83 Raymond James JOHN FREEMAN market perform 4-Feb-13 31-May-12 43% 49% 8% 8-Feb-13 20.23 22.83 Simmons & Company International DAVID W KISTLER neutral 28.00 4-Feb-13 30-Apr-12 47% 42% 11% 7-Feb-13 20.23 22.83 Alembic Global Advisors JAMES J SULLIVAN neutral 19.00 4-Feb-13 30-Mar-12 49% 41% 11% 6-Feb-13 20.51 22.83 Canaccord Genuity Corp JOHN J GERDES buy 28.00 31-Jan-13 29-Feb-12 49% 41% 11% 5-Feb-13 20.54 22.83 Susquehanna Financial Group DUANE GRUBERT neutral 18.00 31-Jan-13 4-Feb-13 20.11 22.83 Argus Research Corp PHILIP H WEISS hold 30-Jan-13 1-Feb-13 20.33 22.88 Howard Weil Inc PETER KISSEL sector outperform 23.00 30-Jan-13 31-Jan-13 20.18 22.88 Capital One Southcoast, Inc. MARSHALL H CARVER VI add 26.00 30-Jan-13 30-Jan-13 20.11 22.88 Sterne, Agee & Leach TIM A REZVAN neutral 30-Jan-13 29-Jan-13 18.97 22.78 Wunderlich Securities JASON A WANGLER buy 25.00 30-Jan-13 28-Jan-13 18.93 22.78 Wells Fargo Securities, LLC DAVID R TAMERON market perform 30-Jan-13 25-Jan-13 19.36 22.78 RBC Capital Markets SCOTT HANOLD sector perform 21.00 29-Jan-13 24-Jan-13 18.77 22.78 Credit Agricole Securities (USA) JEB S ARMSTRONG buy 27.00 29-Jan-13 23-Jan-13 18.50 22.78 Global Hunter Securities MICHAEL KELLY buy 22.00 29-Jan-13 22-Jan-13 18.73 22.78 Johnson Rice & Co CHARLES MEADE overweight 28-Jan-13 21-Jan-13 17.82 22.78 Robert W. Baird & Co MICHAEL A HALL neutral 24.00 18-Jan-13 18-Jan-13 17.82 22.78 Credit Suisse ARUN JAYARAM neutral 22.00 17-Jan-13 17-Jan-13 17.55 22.83 Oppenheimer & Co FADEL GHEIT outperform 24.00 17-Jan-13 16-Jan-13 17.31 22.77 EVA Dimensions CRAIG STERLING underweight 15-Jan-13 15-Jan-13 17.37 22.77 Deutsche Bank STEPHEN RICHARDSON hold 20.00 14-Jan-13 14-Jan-13 16.94 22.77 JPMorgan JOSEPH D ALLMAN overweight 20.00 14-Jan-13 11-Jan-13 16.87 23.00 Ladenburg Thalmann & Co MICHAEL SCHMITZ neutral 20.00 14-Jan-13 10-Jan-13 16.64 23.00 Macquarie JOSEPH MAGNER neutral 19.00 7-Jan-13 Q.M.S Advisors | tel: +41 (0)78 922 08 77 | e-mail: info@qmsadv.com |
- 3. 20.02.2013 Chesapeake Energy Corp Company Analysis - Ownership Ownership Type Ownership Statistics Geographic Ownership Distribution Geographic Ownership 2% Shares Outstanding (M) 660.9 16% United States 82.54% 1% 1% 4% Float 89.4% Britain 4.80% 2% Short Interest (M) 77.2 Bahamas 2.45% 2% 2% Short Interest as % of Float 13.06% Canada 2.13% Days to Cover Shorts 3.83 Unknown Country 1.93% 5% Institutional Ownership 82.45% Germany 1.27% Retail Ownership 15.92% Japan 1.25% Insider Ownership 1.62% Others 3.64% 82% Institutional Ownership Distribution 83% Investment Advisor 77.68% Hedge Fund Manager 14.57% Pension Fund (Erisa) 2.84% United States Britain Bahamas Institutional Ownership Retail Ownership Insider Ownership Individual 1.93% Canada Unknown Country Germany Pricing data is in USD Others 2.99% Japan Others Top 20 Owners: TOP 20 ALL Institutional Ownership Holder Name Position Position Change Market Value % of Ownership Report Date Source Country SOUTHEASTERN ASSET M 85'481'331 -4'237'700 1'760'488'012 12.86% 31.12.2012 13F UNITED STATES 2% 3% ICAHN ASSOCIATES COR 59'698'689 9'613'487 1'229'494'500 8.98% 31.12.2012 13F UNITED STATES 3% ICAHN ASSOCIATES COR 59'698'689 0 1'229'494'500 8.98% 31.12.2012 Research UNITED STATES FRANKLIN RESOURCES 34'252'412 7'174'601 705'428'425 5.15% 31.12.2012 ULT-AGG UNITED STATES 15% BLACKROCK 29'102'143 -2'986'790 599'358'635 4.38% 31.12.2012 ULT-AGG UNITED STATES VANGUARD GROUP INC 25'656'221 747'083 528'389'871 3.86% 31.12.2012 13F UNITED STATES STATE STREET 24'670'203 242'007 508'082'831 3.71% 19.02.2013 ULT-AGG UNITED STATES WELLINGTON MANAGEMEN 23'781'033 3'174'148 489'770'375 3.58% 31.12.2012 13F UNITED STATES BANK OF AMERICA CORP 16'076'279 5'022'300 331'090'966 2.42% 31.12.2012 13F UNITED STATES 77% BRANDES INVESTMENT P 12'740'892 -830'057 262'398'671 1.92% 31.12.2012 13F UNITED STATES OLDFIELD PARTNERS LL 9'140'400 384'100 188'246'538 1.38% 31.12.2012 13F BRITAIN NORTHERN TRUST CORPO 7'250'423 -6'964 149'322'462 1.09% 31.12.2012 13F UNITED STATES SUSQUEHANNA INTERNAT 6'976'795 2'846'012 143'687'093 1.05% 31.12.2012 13F UNITED STATES BANK OF NEW YORK MEL 6'794'499 937'512 139'932'707 1.02% 31.12.2012 13F UNITED STATES Investment Advisor Hedge Fund Manager Pension Fund (Erisa) Individual Others DIMENSIONAL FUND ADV 6'205'209 567'637 127'796'279 0.93% 31.12.2012 13F UNITED STATES MACKENZIE FINANCIAL 5'057'882 -4'008'545 104'167'080 0.76% 31.12.2012 13F CANADA CORTLAND ADVISERS LL 4'868'900 4'868'900 100'274'996 0.73% 31.12.2012 13F UNITED STATES MORGAN STANLEY 4'837'769 10'445 99'633'853 0.73% 31.12.2012 ULT-AGG UNITED STATES DEUTSCHE BANK AG 4'500'499 -484'943 92'687'777 0.68% 31.12.2012 13F GERMANY FMR LLC 4'092'438 -2'266'979 84'283'761 0.62% 31.12.2012 ULT-AGG UNITED STATES Top 5 Insiders: Holder Name Position Position Change Market Value % of Ownership Report Date Source MCCLENDON AUBREY K 3'183'188 177'915 65'557'757 0.48% 29.01.2013 Form 4 DIXON STEVEN C 1'201'014 88'960 24'734'883 0.18% 29.01.2013 Form 4 JACOBSON DOUGLAS J 972'304 69'190 20'024'601 0.15% 29.01.2013 Form 4 HOOD HENRY J 704'429 14'507'715 0.11% 01.10.2012 Form 4 SIMPSON LOUIS A 542'098 3'997 11'164'508 0.08% 13.12.2012 Form 4 Q.M.S Advisors | tel: +41 (0)78 922 08 77 | e-mail: info@qmsadv.com |
- 4. Company Analysis - Financials I/IV Chesapeake Energy Corp Financial information is in USD (M) Equivalent Estimates Periodicity: Fiscal Year 12/01 12/02 12/03 12/04 12/05 12/06 12/07 12/08 12/09 12/10 12/11 12/12E 12/13E 12/14E Income Statement Revenue 969 739 1'717 2'709 4'624 6'830 8'174 10'832 8'290 10'023 12'424 10'027 10'208 11'670 - Cost of Goods Sold 426 529 1'012 816 1'470 2'197 2'939 3'460 2'780 2'872 3'590 Gross Income 543 209 705 1'893 3'154 4'633 5'235 7'372 5'510 7'151 8'834 3'129 3'230 3'958 - Selling, General & Admin Expenses 23 18 24 896 1'422 1'661 2'212 3'882 2'665 3'805 5'515 (Research & Dev Costs) Operating Income 520 192 682 997 1'732 2'972 3'023 3'490 2'845 3'346 3'319 -468 1'847 2'858 - Interest Expense 98 112 154 167 220 301 406 271 113 19 44 - Foreign Exchange Losses (Gains) 0 0 0 0 0 0 0 0 0 0 0 - Net Non-Operating Losses (Gains) -16 12 26 25 19 -584 276 2'228 12'020 443 395 Pretax Income 438 67 501 805 1'493 3'255 2'341 991 -9'288 2'884 2'880 -290 1'830 2'792 - Income Tax Expense 175 27 190 290 545 1'252 890 387 -3'483 1'110 1'123 Income Before XO Items 263 40 311 515 948 2'003 1'451 604 -5'805 1'774 1'757 - Extraordinary Loss Net of Tax 46 0 -2 0 0 0 0 0 0 0 0 - Minority Interests 0 0 0 0 0 0 0 0 25 0 15 Diluted EPS Before XO Items 1.51 0.17 1.20 1.53 2.51 4.35 2.62 0.93 (9.57) 2.51 2.32 Net Income Adjusted* 201 95 304 458 924 2'291 1'657 1'999 1'608 1'971 1'936 238 886 1'518 EPS Adjusted 1.16 0.55 1.26 1.60 2.63 3.61 3.21 3.55 2.58 2.95 2.80 0.49 1.21 1.95 Dividends Per Share 0.00 0.06 0.14 0.17 0.20 0.23 0.26 0.29 0.30 0.30 0.34 0.34 0.34 0.34 Payout Ratio % 0.0 35.4 10.1 10.3 7.1 4.8 9.7 31.1 11.4 13.7 0.70 0.28 0.18 Total Shares Outstanding 165 190 217 312 370 457 511 648 648 655 661 Diluted Shares Outstanding 174 173 259 306 367 459 487 545 612 706 752 EBITDA 698 427 1'068 1'602 2'668 4'422 4'994 5'634 4'460 4'960 5'242 3'398 4'670 5'856 *Net income excludes extraordinary gains and losses and one-time charges. Q.M.S Advisors | tel: +41 (0)78 922 08 77 | e-mail: info@qmsadv.com |
- 5. Company Analysis - Financials II/IV Periodicity: 12/01 12/02 12/03 12/04 12/05 12/06 12/07 12/08 12/09 12/10 12/11 12/12E 12/13E 12/14E Balance Sheet Total Current Assets 361.383 435.317 342.404 567.54 1183.397 1153.869 1396 4292 2446 3266 3177 + Cash & Near Cash Items 118 248 41 7 60 3 1 1'749 307 102 351 + Short Term Investments 0 0 0 0 0 0 0 0 0 0 0 + Accounts & Notes Receivable 51 109 174 347 615 845 1'074 1'324 1'325 1'974 2'505 + Inventories 11 15 19 32 87 82 87 58 25 0 0 + Other Current Assets 182 63 109 181 421 225 234 1'161 789 1'190 321 Total Long-Term Assets 1'925 2'440 4'230 7'677 14'935 23'263 29'338 34'301 27'468 33'913 38'658 + Long Term Investments 0 0 0 93 159 699 612 444 404 1'208 1'531 Gross Fixed Assets 3'728 4'561 6'675 10'587 18'486 27'396 35'744 45'670 51'763 58'692 65'029 Accumulated Depreciation 1'942 2'172 2'542 3'143 4'074 5'492 7'407 12'362 25'053 26'314 28'290 + Net Fixed Assets 1'786 2'390 4'133 7'444 14'412 21'904 28'337 33'308 26'710 32'378 36'739 + Other Long Term Assets 140 50 97 140 364 660 389 549 354 327 388 Total Current Liabilities 173 266 513 964 1'964 1'890 2'761 3'621 2'688 4'490 7'082 + Accounts Payable 80 86 164 367 517 860 1'262 1'611 957 2'069 3'311 + Short Term Borrowings 1 0 0 0 0 0 0 0 0 0 0 + Other Short Term Liabilities 93 180 349 597 1'447 1'030 1'499 2'010 1'731 2'421 3'771 Total Long Term Liabilities 1'346 1'702 2'326 4'118 7'980 11'276 15'843 17'955 14'885 17'425 16'792 + Long Term Borrowings 1'329 1'651 2'058 3'075 5'490 7'376 10'950 13'175 12'295 12'640 10'626 + Other Long Term Borrowings 17 51 269 1'043 2'490 3'900 4'893 4'780 2'590 4'785 6'166 Total Liabilities 1'519 1'968 2'839 5'082 9'944 13'166 18'604 21'576 17'573 21'915 23'874 + Long Preferred Equity 150 150 552 491 1'577 1'958 960 505 466 3'065 3'062 + Minority Interest 0 0 0 0 0 0 0 0 897 0 1'337 + Share Capital & APIC 1'037 1'208 1'391 2'443 3'807 5'878 7'037 11'686 12'152 12'201 12'153 + Retained Earnings & Other Equity -419 -450 -211 229 791 3'416 4'133 4'826 -1'174 -2 1'409 Total Shareholders Equity 767 908 1'733 3'163 6'174 11'251 12'130 17'017 12'341 15'264 17'961 Total Liabilities & Equity 2'287 2'876 4'572 8'245 16'118 24'417 30'734 38'593 29'914 37'179 41'835 Book Value Per Share 3.75 3.99 5.45 8.57 12.42 20.32 21.85 25.49 16.95 18.62 20.52 19.24 20.16 21.78 Tangible Book Value Per Share 3.75 3.99 5.45 8.57 12.42 20.32 21.85 25.49 16.95 18.62 20.52 Q.M.S Advisors | tel: +41 (0)78 922 08 77 | e-mail: info@qmsadv.com |
- 6. Company Analysis - Financials III/IV Periodicity: 12/01 12/02 12/03 12/04 12/05 12/06 12/07 12/08 12/09 12/10 12/11 12/12E 12/13E 12/14E Cash Flows Net Income 217 40 313 515 948 2'003 1'451 604 -5'830 1'774 1'742 -1'060 847 1'202 + Depreciation & Amortization 178 235 386 606 936 1'449 1'971 2'144 1'615 1'614 1'923 + Other Non-Cash Adjustments 124 137 205 376 702 518 1'311 2'555 8'707 1'160 1'644 + Changes in Non-Cash Capital 35 20 42 -64 -180 873 199 54 -136 569 594 Cash From Operating Activities 554 433 946 1'432 2'407 4'843 4'932 5'357 4'356 5'117 5'903 + Disposal of Fixed Assets 5 7 28 0 10 244 369 64 1'626 4'292 8'963 + Capital Expenditures -460 -769 -2'061 -3'341 -6'782 -8'726 -9'705 -17'770 -7'524 -13'513 -14'450 -10'872 -6'812 -7'328 + Increase in Investments 0 0 0 0 -135 -555 -8 0 -40 -134 0 + Decrease in Investments 0 0 0 0 0 0 0 0 0 0 + Other Investing Activities -215 -17 -44 -40 -15 94 1'422 7'741 476 852 -325 Cash From Investing Activities -670 -780 -2'077 -3'381 -6'921 -8'942 -7'922 -9'965 -5'462 -8'503 -5'812 + Dividends Paid -1 -15 -48 -80 -92 -175 -210 -183 -204 -281 -379 + Change in Short Term Borrowings 0 0 26 0 61 70 -98 330 -2'246 1'834 -1'604 + Increase in Long Term Borrowings 1'462 699 1'223 3'326 8'607 10'125 9'539 15'427 1'491 1'967 1'614 + Decrease in Long Term Borrowings -1'365 -360 -851 -2'101 -5'765 -8'264 -6'160 -11'307 0 -3'434 -2'015 + Increase in Capital Stocks 148 164 577 941 2'349 2'477 35 2'650 4 2'562 0 + Decrease in Capital Stocks -0 0 -2 0 -4 -86 -5 -7 0 0 + Other Financing Activities -10 -11 -0 -171 -588 -105 -118 -556 626 533 2'542 Cash From Financing Activities 234 477 925 1'915 4'568 4'042 2'988 6'356 -336 3'181 158 Net Changes in Cash 118 130 -207 -34 53 -58 -2 1'748 -1'442 -205 249 Free Cash Flow (CFO-CAPEX) 94 -336 -1'116 -1'909 -4'375 -3'882 -4'773 -12'413 -3'168 -8'396 -8'547 -7'959 -3'323 -2'988 Free Cash Flow To Firm 153 -269 -1'020 -1'802 -4'235 -3'697 -4'521 -12'248 -8'384 -8'520 Free Cash Flow To Equity 312 -1 -309 -785 -418 -1'415 -2'215 -8'387 -2'359 -1'249 -1'764 Free Cash Flow per Share 0.58 -2.02 -5.28 -7.54 -13.58 -9.74 -10.47 -23.16 -5.18 -13.31 -13.42 Q.M.S Advisors | tel: +41 (0)78 922 08 77 | e-mail: info@qmsadv.com |
- 7. Company Analysis - Financials IV/IV Periodicity: 12/01 12/02 12/03 12/04 12/05 12/06 12/07 12/08 12/09 12/10 12/11 12/12E 12/13E 12/14E Ratio Analysis Valuation Ratios Price Earnings 5.7x 14.1x 10.8x 10.3x 12.3x 8.0x 12.9x 4.6x 10.0x 8.8x 8.0x 42.5x 17.1x 10.6x EV to EBIT 4.7x 15.8x 8.1x 8.7x 10.8x 7.6x 10.6x 6.4x 10.6x 9.7x 8.9x EV to EBITDA 3.5x 7.1x 5.2x 5.4x 7.0x 5.1x 6.4x 4.0x 6.8x 6.6x 5.6x 10.3x 7.5x 6.0x Price to Sales 1.1x 1.7x 1.7x 1.5x 2.2x 1.7x 2.2x 0.8x 1.9x 1.6x 1.1x 1.4x 1.3x 1.2x Price to Book 1.8x 1.9x 2.5x 1.9x 2.6x 1.4x 1.8x 0.6x 1.5x 1.4x 1.1x 1.1x 1.0x 0.9x Dividend Yield 0.0% 0.8% 1.0% 1.0% 0.6% 0.8% 0.7% 1.8% 1.2% 1.2% 1.5% 1.7% 1.6% 1.7% Profitability Ratios Gross Margin 56.1% 28.3% 41.1% 69.9% 68.2% 67.8% 64.0% 68.1% 66.5% 71.3% 71.1% 31.2% 31.6% 33.9% EBITDA Margin 72.0% 57.8% 62.2% 59.1% 57.7% 64.7% 61.1% 52.0% 53.8% 49.5% 42.2% 33.9% 45.7% 50.2% Operating Margin 53.7% 26.0% 39.7% 36.8% 37.5% 43.5% 37.0% 32.2% 34.3% 33.4% 26.7% -4.7% 18.1% 24.5% Profit Margin 22.4% 5.5% 18.2% 19.0% 20.5% 29.3% 17.8% 5.6% -70.3% 17.7% 14.0% 2.4% 8.7% 13.0% Return on Assets 11.7% 1.6% 8.4% 8.0% 7.8% 9.9% 5.3% 1.7% -17.0% 5.3% 4.4% -1.1% 3.1% 4.3% Return on Equity 47.9% 4.4% 30.0% 22.8% 24.2% 27.4% 12.0% 3.6% -42.6% 14.4% 12.2% 1.1% 6.2% 11.5% Leverage & Coverage Ratios Current Ratio 2.08 1.64 0.67 0.59 0.60 0.61 0.51 1.19 0.91 0.73 0.45 Quick Ratio 0.98 1.34 0.42 0.37 0.34 0.45 0.39 0.85 0.61 0.46 0.40 Interest Coverage Ratio (EBIT/I) 5.05 1.64 4.07 4.90 5.80 6.19 4.48 4.08 3.81 4.55 4.28 Tot Debt/Capital 0.63 0.65 0.54 0.49 0.47 0.40 0.47 0.44 0.50 0.45 0.37 Tot Debt/Equity 1.73 1.82 1.19 0.97 0.89 0.66 0.90 0.77 1.00 0.83 0.59 Others Asset Turnover 0.52 0.29 0.46 0.42 0.38 0.34 0.30 0.31 0.24 0.30 0.31 Accounts Receivable Turnover 13.05 9.19 12.14 10.40 9.61 9.35 8.52 9.03 6.26 6.08 5.55 Accounts Payable Turnover 6.06 6.44 8.12 3.12 3.45 3.18 2.78 2.39 2.14 1.88 1.33 Inventory Turnover 61.71 40.73 58.47 31.75 24.66 26.06 34.88 47.72 66.99 229.76 Effective Tax Rate 39.9% 40.0% 38.0% 36.0% 36.5% 38.5% 38.0% 39.1% 38.5% 39.0% Q.M.S Advisors | tel: +41 (0)78 922 08 77 | e-mail: info@qmsadv.com |