Financial analysis paladin energy ltd - paladin energy limited primarily explores for uranium in australia and southern africa
•
1 j'aime•275 vues


Recommandé
Recommandé
Contenu connexe
Tendances
Tendances (17)
En vedette
En vedette (15)
Similaire à Financial analysis paladin energy ltd - paladin energy limited primarily explores for uranium in australia and southern africa
Similaire à Financial analysis paladin energy ltd - paladin energy limited primarily explores for uranium in australia and southern africa (20)
Plus de BCV
Plus de BCV (20)
Financial analysis paladin energy ltd - paladin energy limited primarily explores for uranium in australia and southern africa
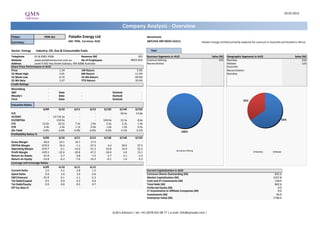
- 1. 20.02.2013 Company Analysis - Overview Ticker: PDN AU Paladin Energy Ltd Benchmark: Currency: ASE: PDN, Currency: AUD S&P/ASX 200 INDEX (AS51) Paladin Energy Limited primarily explores for uranium in Australia and Southern Africa. Sector: Energy Industry: Oil, Gas & Consumable Fuels Year: Telephone 61-8-9381-4366 Revenue (M) 355 Business Segments in AUD Sales (M) Geographic Segments in AUD Sales (M) Website www.paladinresources.com.au No of Employees #N/A N/A Uranium Mining 355 Namibia 232 Address Level 4 502 Hay Street Subiaco, WA 6008 Australia Reconciliation Malawi 123 Share Price Performance in AUD Australia Price 1.24 1M Return 3.3% Reconciliation 52 Week High 2.01 6M Return -11.4% Namibia 52 Week Low 0.74 52 Wk Return -29.9% 52 Wk Beta 2.47 YTD Return 20.4% Credit Ratings Bloomberg - S&P - Date - Outlook - Moody's - Date - Outlook - Fitch - Date - Outlook - 35% Valuation Ratios 6/09 6/10 6/11 6/12 6/13E 6/14E 6/15E P/E - - - - - 30.4x 14.8x EV/EBIT - 13'176.3x - - - - - EV/EBITDA - 124.9x - - 100.0x 12.5x 8.6x 65% P/S 22.0x 10.5x 7.5x 2.9x 2.6x 2.2x 1.9x P/B 4.4x 2.4x 1.7x 0.9x 1.0x 1.0x 0.9x Div Yield 0.0% 0.0% 0.0% 0.0% 0.0% 0.1% 0.1% 100% Profitability Ratios % 6/09 6/10 6/11 6/12 6/13E 6/14E 6/15E Gross Margin 40.6 24.1 16.7 17.5 - - - EBITDA Margin -670.9 10.4 -1.1 -37.3 4.4 29.6 37.5 Operating Margin -679.7 0.1 -15.0 -51.3 -23.8 10.9 22.2 Uranium Mining Profit Margin -429.5 -22.6 -30.8 -47.2 -18.4 4.6 13.1 Namibia Malawi Return on Assets -23.9 -2.7 -3.8 -7.3 -1.7 2.1 5.3 Return on Equity -53.8 -6.2 -7.6 -14.3 -6.1 1.6 6.3 Leverage and Coverage Ratios 6/09 6/10 6/11 6/12 Current Ratio 2.0 4.2 2.8 1.5 Current Capitalization in AUD Quick Ratio 0.9 3.0 1.0 0.6 Common Shares Outstanding (M) 835.6 EBIT/Interest -55.9 0.1 -1.1 -5.2 Market Capitalization (M) 1037.8 Tot Debt/Capital 0.5 0.4 0.3 0.4 Cash and ST Investments (M) 138.9 Tot Debt/Equity 0.9 0.8 0.5 0.7 Total Debt (M) 802.6 Eff Tax Rate % - - - - Preferred Equity (M) 0.0 LT Investments in Affiliate Companies (M) 0.0 Investments (M) 46.9 Enterprise Value (M) 1748.4 Q.M.S Advisors | tel: +41 (0)78 922 08 77 | e-mail: info@qmsadv.com |
- 2. Company Analysis - Analysts Ratings Paladin Energy Ltd Target price in AUD Broker Recommendation Buy and Sell Recommendations vs Price and Target Price Price Brokers' Target Price 4 5 100% 5% 9% 10% 13% 13% 9% 17% 17% 14% 17% 17% 5 21% 4 4 80% 3 26% 26% 30% 4 22% 22% 36% 38% 45% 32% 26% 30% 29% 3 3 60% 3 2 2 40% 2 2 61% 61% 55% 61% 61% 61% 55% 57% 1 50% 52% 50% 52% 1 20% 1 1 0 Securities Pty Genuity Corp Raymond BMO Capital Securities Inc. Securities Inc. Partners Ltd JPMorgan Securities Corp Commonwealth Morgan RBC Capital Macquarie Securities Ltd Capital Inc Credit Suisse Securities Stanley Dimensions Deutsche Bank CIBC World Paterson Paradigm Octa Phillip Canaccord James Ambrian Markets Markets Argonaut Haywood Markets Cormark 0% 0 EVA Dundee Bank févr.12 mars.12 avr.12 mai.12 juin.12 juil.12 août.12 sept.12 oct.12 nov.12 déc.12 janv.13 Buy Hold Sell Price Target Price Date Buy Hold Sell Date Price Target Price Broker Analyst Recommendation Target Date 31-Jan-13 52% 30% 17% 20-Feb-13 1.24 1.64 Deutsche Bank PAUL-D YOUNG hold 1.30 15-Feb-13 31-Dec-12 57% 26% 17% 19-Feb-13 1.21 1.64 JPMorgan MARK BUSUTTIL neutral 1.80 15-Feb-13 30-Nov-12 55% 32% 14% 18-Feb-13 1.20 1.64 Raymond James DAVID SADOWSKI outperform 1.93 15-Feb-13 31-Oct-12 61% 30% 9% 15-Feb-13 1.21 1.63 Dundee Securities Corp DAVID A TALBOT buy 2.31 15-Feb-13 28-Sep-12 61% 26% 13% 14-Feb-13 1.22 1.68 Cormark Securities Inc. MIKE KOZAK speculative buy 2.41 15-Feb-13 31-Aug-12 61% 26% 13% 13-Feb-13 1.15 1.68 Commonwealth Bank ANDREW KNUCKEY underweight 0.95 15-Feb-13 31-Jul-12 50% 45% 5% 12-Feb-13 1.12 1.64 BMO Capital Markets EDWARD STERCK market perform 1.45 14-Feb-13 29-Jun-12 52% 38% 10% 11-Feb-13 1.13 1.64 Morgan Stanley STEFAN HANSEN Equalwt/In-Line 1.35 14-Feb-13 31-May-12 55% 36% 9% 8-Feb-13 1.09 1.64 RBC Capital Markets ADAM SCHATZKER outperform 1.35 14-Feb-13 30-Apr-12 50% 29% 21% 7-Feb-13 1.08 1.64 Credit Suisse RALPH M PROFITI outperform 1.93 14-Feb-13 30-Mar-12 61% 22% 17% 6-Feb-13 1.10 1.64 CIBC World Markets MATTHEW GIBSON sector outperform 3.38 14-Feb-13 29-Feb-12 61% 22% 17% 5-Feb-13 1.11 1.65 Canaccord Genuity Corp OREST WOWKODAW buy 1.69 14-Feb-13 4-Feb-13 1.14 1.65 Haywood Securities Inc. COLIN HEALEY sector outperform 1.93 13-Feb-13 1-Feb-13 1.13 1.65 Paterson Securities SIMON TONKIN hold 1.20 11-Feb-13 31-Jan-13 1.14 1.65 EVA Dimensions CRAIG STERLING underweight 23-Jan-13 30-Jan-13 1.15 1.65 Macquarie MICHAEL BOGUSZ neutral 1.35 18-Jan-13 29-Jan-13 1.16 1.65 Argonaut Securities Pty Ltd TROY IRVIN speculative buy 1.75 17-Jan-13 28-Jan-13 1.12 1.65 Octa Phillip Securities Ltd ANDREW SHEARER buy 1.40 15-Nov-12 25-Jan-13 1.12 1.65 Ambrian Partners Ltd ADAM KILEY hold 1.69 12-Apr-12 24-Jan-13 1.14 1.65 Paradigm Capital Inc DAVID DAVIDSON hold 4.76 16-Nov-10 23-Jan-13 1.18 1.66 22-Jan-13 1.17 1.66 21-Jan-13 1.19 1.66 18-Jan-13 1.20 1.66 17-Jan-13 1.18 1.66 16-Jan-13 1.16 1.67 15-Jan-13 1.12 1.63 14-Jan-13 1.07 1.63 11-Jan-13 1.05 1.62 10-Jan-13 1.03 1.62 Q.M.S Advisors | tel: +41 (0)78 922 08 77 | e-mail: info@qmsadv.com |
- 3. 20.02.2013 Paladin Energy Ltd Company Analysis - Ownership Ownership Type Ownership Statistics Geographic Ownership Distribution Geographic Ownership 3% Shares Outstanding (M) 835.6 United States 31.40% 5% 1% Float 84.8% Australia 30.14% 1% 6% Short Interest (M) 108.3 35% Singapore 13.89% 32% Short Interest as % of Float 15.28% Switzerland 10.87% Days to Cover Shorts 6.84 Unknown Country 6.39% 11% Institutional Ownership 34.93% Canada 4.83% Retail Ownership 62.26% Luxembourg 1.05% Insider Ownership 2.81% 62% Others 1.44% 14% 30% Institutional Ownership Distribution Investment Advisor 32.59% Mutual Fund Manager 21.03% Corporation 14.16% United States Australia Singapore Institutional Ownership Retail Ownership Insider Ownership Government 13.85% Switzerland Unknown Country Canada Pricing data is in AUD Others 18.37% Luxembourg Others Top 20 Owners: TOP 20 ALL Institutional Ownership Holder Name Position Position Change Market Value % of Ownership Report Date Source Country L1 CAPITAL PTY LTD 63'119'387 9'584'967 78'268'040 7.54% 24.08.2012 EXCH AUSTRALIA 18% NEWMONT MINING CORP 52'097'937 0 64'601'442 6.22% 16.09.2011 Co File UNITED STATES GOVT OF SINGAPORE IN 50'957'433 8'651'860 63'187'217 6.09% 05.12.2012 ULT-AGG SINGAPORE 33% NATIONAL AUSTRALIA B 41'932'448 21'028 51'996'236 5.01% 14.02.2012 EXCH AUSTRALIA UBS 39'980'126 -2'257'895 49'575'356 4.78% 07.05.2012 ULT-AGG GLOBAL X MANAGEMENT 17'558'695 -416'532 21'772'782 2.10% 28.01.2013 MF-AGG UNITED STATES BORSHOFF JOHN 15'877'394 0 19'687'969 1.90% 29.01.2013 EXCH n/a 14% FMR LLC 14'406'619 273'415 17'864'208 1.72% 31.12.2012 ULT-AGG UNITED STATES 21% VANGUARD GROUP INC 8'621'660 219'813 10'690'858 1.03% 31.12.2012 MF-AGG UNITED STATES DIMENSIONAL FUND ADV 8'040'918 0 9'970'738 0.96% 31.07.2012 MF-AGG UNITED STATES 14% IG INVESTMENT MANAGE 6'537'500 0 8'106'500 0.78% 28.09.2012 MF-AGG CANADA INVESCO LTD 5'784'204 0 7'172'413 0.69% 19.02.2013 MF-AGG UNITED STATES CRABB RICK WAYNE 5'181'528 300'000 6'425'095 0.62% 15.11.2012 PROXY n/a VANGUARD INVESTMENTS 4'004'702 -31'839 4'965'830 0.48% 30.09.2012 MF-AGG AUSTRALIA Investment Advisor Mutual Fund Manager Corporation Government Others VAN ECK ASSOCIATES C 3'879'233 0 4'810'249 0.46% 15.02.2013 MF-AGG UNITED STATES TD ASSET MANAGEMENT 3'757'200 913'037 4'658'928 0.45% 31.12.2011 MF-AGG CANADA MANNING & NAPIER ADV 2'564'930 463'070 3'180'513 0.31% 31.12.2012 MF-AGG UNITED STATES CI INVESTMENTS INC 2'290'300 0 2'839'972 0.27% 30.06.2012 MF-AGG CANADA NATIXIS INTERNATIONA 2'238'906 0 2'776'243 0.27% 31.12.2012 MF-AGG LUXEMBOURG SWABY GILLIAN 2'081'655 -755'000 2'581'252 0.25% 12.09.2011 SEDI n/a Top 5 Insiders: Holder Name Position Position Change Market Value % of Ownership Report Date Source BORSHOFF JOHN 15'877'394 19'687'969 1.90% 29.01.2013 EXCH CRABB RICK WAYNE 5'181'528 300'000 6'425'095 0.62% 15.11.2012 Proxy SWABY GILLIAN 2'081'655 -755'000 2'581'252 0.25% 12.09.2011 SEDI SHUMKA DONALD M 200'000 100'000 248'000 0.02% 16.11.2012 SEDI LLEWELYN SEAN REVEILLE 100'000 124'000 0.01% 11.10.2012 Proxy Q.M.S Advisors | tel: +41 (0)78 922 08 77 | e-mail: info@qmsadv.com |
- 4. Company Analysis - Financials I/IV Paladin Energy Ltd Financial information is in AUD (M) Equivalent Estimates Periodicity: Fiscal Year 6/02 6/03 6/04 6/05 6/06 6/07 6/08 6/09 6/10 6/11 6/12 6/13E 6/14E 6/15E Income Statement Revenue 0 0 0 4 105 152 229 271 355 397 475 544 - Cost of Goods Sold 15 74 90 174 225 293 Gross Income -11 31 62 55 45 62 - Selling, General & Admin Expenses 1 1 1 10 13 44 50 1'095 55 86 245 (Research & Dev Costs) 0 0 0 0 0 0 0 0 0 Operating Income -1 -1 -1 -10 -12 -55 -18 -1'033 0 -41 -182 -94 52 121 - Interest Expense 0 0 0 0 0 15 21 18 5 37 35 - Foreign Exchange Losses (Gains) 0 0 0 0 -1 1 4 -1 6 6 -1 - Net Non-Operating Losses (Gains) 1 -0 -1 -1 -4 -8 7 56 10 23 55 Pretax Income -2 -1 0 -10 -7 -63 -49 -1'106 -20 -107 -271 -96 37 103 - Income Tax Expense 0 0 0 0 0 -15 -8 -322 32 -17 -76 Income Before XO Items -2 -1 0 -10 -7 -48 -42 -784 -53 -90 -195 - Extraordinary Loss Net of Tax 0 0 0 -0 0 0 0 0 0 0 0 - Minority Interests 0 0 0 0 0 -1 -1 -131 -1 -6 -27 Diluted EPS Before XO Items 0.00 (0.03) (0.02) (0.09) (0.07) (1.06) (0.07) (0.11) (0.20) Net Income Adjusted* -21 -38 -653 -54 -72 -31 -73 22 71 EPS Adjusted (0.04) (0.06) (1.06) (0.08) (0.10) (0.04) (0.08) 0.04 0.08 Dividends Per Share 0.00 0.00 0.00 0.00 0.00 0.00 0.00 0.00 0.00 0.00 0.00 0.00 0.00 0.00 Payout Ratio % 0.0 0.02 0.01 Total Shares Outstanding 227 266 334 401 454 602 613 624 717 778 836 Diluted Shares Outstanding 211 208 288 363 433 511 608 618 697 744 820 EBITDA -1 -0 -1 -10 -12 -52 -6 -1'020 24 -3 -132 18 140 204 *Net income excludes extraordinary gains and losses and one-time charges. Q.M.S Advisors | tel: +41 (0)78 922 08 77 | e-mail: info@qmsadv.com |
- 5. Company Analysis - Financials II/IV Periodicity: 6/02 6/03 6/04 6/05 6/06 6/07 6/08 6/09 6/10 6/11 6/12 6/13E 6/14E 6/15E Balance Sheet Total Current Assets 0.497 1.426 5.802 40.057 63.473 274.555935 468.073989 225.386997 609.30672 307.563025 382.608696 + Cash & Near Cash Items 0 0 5 39 60 215 353 82 411 110 110 + Short Term Investments 0 0 0 0 0 0 0 0 0 0 0 + Accounts & Notes Receivable 0 0 0 0 0 4 30 16 17 0 51 + Inventories 0 0 0 0 0 45 72 106 129 166 182 + Other Current Assets 0 1 1 1 4 11 13 21 53 32 40 Total Long-Term Assets 5 4 5 5 97 2'147 2'210 1'587 1'725 1'937 1'911 + Long Term Investments 1 1 1 0 0 71 0 86 42 39 15 Gross Fixed Assets 2 1 1 2 82 163 265 663 1'649 1'864 1'904 Accumulated Depreciation 1 1 0 1 1 4 12 28 48 77 220 + Net Fixed Assets 2 0 0 1 80 159 253 634 1'601 1'788 1'684 + Other Long Term Assets 3 3 4 4 16 1'917 1'958 867 82 110 212 Total Current Liabilities 0 1 1 1 12 36 57 113 143 111 248 + Accounts Payable 0 0 1 1 11 16 43 83 75 65 66 + Short Term Borrowings 0 1 1 1 0 7 11 18 57 41 179 + Other Short Term Liabilities 0 0 0 0 1 13 2 12 12 5 3 Total Long Term Liabilities 1 0 0 0 24 847 1'128 918 1'045 868 878 + Long Term Borrowings 1 0 0 0 19 315 597 708 806 631 640 + Other Long Term Borrowings 0 0 0 0 5 532 531 209 239 237 238 Total Liabilities 1 1 1 1 36 882 1'185 1'031 1'188 979 1'126 + Long Preferred Equity 0 0 0 0 0 0 0 0 0 0 0 + Minority Interest 0 0 0 0 0 217 217 85 86 78 51 + Share Capital & APIC 19 19 24 66 148 1'265 1'138 1'377 1'742 1'651 1'797 + Retained Earnings & Other Equity -14 -15 -15 -22 -23 57 139 -680 -681 -464 -681 Total Shareholders Equity 5 4 9 44 125 1'539 1'494 782 1'147 1'265 1'167 Total Liabilities & Equity 6 6 11 45 160 2'421 2'679 1'812 2'335 2'244 2'294 Book Value Per Share 0.02 0.02 0.03 0.11 0.27 2.19 2.08 1.12 1.48 1.53 1.34 1.28 1.28 1.35 Tangible Book Value Per Share 0.02 0.02 0.03 0.11 0.27 2.16 2.05 1.07 1.44 1.50 1.31 Q.M.S Advisors | tel: +41 (0)78 922 08 77 | e-mail: info@qmsadv.com |
- 6. Company Analysis - Financials III/IV Periodicity: 6/02 6/03 6/04 6/05 6/06 6/07 6/08 6/09 6/10 6/11 6/12 6/13E 6/14E 6/15E Cash Flows Net Income -2 -1 0 -9 -7 -48 -40 -653 -52 -83 -168 -131 23 71 + Depreciation & Amortization 0 0 0 0 0 3 12 13 24 38 50 + Other Non-Cash Adjustments 2 0 -1 8 7 3 35 648 42 52 135 + Changes in Non-Cash Capital -0 0 0 -0 1 -7 -28 -19 -53 -110 -140 Cash From Operating Activities -0 -0 -0 -1 1 -49 -21 -11 -39 -103 -122 + Disposal of Fixed Assets 0 0 0 1 0 0 2 0 0 12 0 + Capital Expenditures -0 0 -0 -1 -71 -113 -111 -323 -202 -149 -80 -36 -28 -61 + Increase in Investments -0 0 0 0 -1 -17 -20 -16 -2 0 0 + Decrease in Investments 0 0 1 0 0 1 0 0 0 3 0 + Other Investing Activities -0 -0 -1 -5 -5 -26 -40 -12 -1 Cash From Investing Activities -1 -0 -0 -5 -76 -155 -169 -351 -204 -134 -80 + Dividends Paid 0 0 0 0 0 0 0 0 0 0 0 + Change in Short Term Borrowings 0 0 0 0 + Increase in Long Term Borrowings 0 0 0 1 23 382 368 0 165 316 402 + Decrease in Long Term Borrowings -0 0 -0 -1 -1 0 -5 -17 -7 -309 -260 + Increase in Capital Stocks 1 0 5 41 76 9 12 8 414 1 61 + Decrease in Capital Stocks 0 0 0 0 0 0 0 0 0 0 + Other Financing Activities 0 0 -0 0 -3 -9 -12 1 -7 -4 -6 Cash From Financing Activities 1 0 5 41 96 382 362 -8 564 4 197 Net Changes in Cash -0 -0 5 35 20 177 173 -369 321 -234 -5 Free Cash Flow (CFO-CAPEX) -1 -0 -0 -2 -71 -162 -132 -333 -241 -252 -202 33 85 76 Free Cash Flow To Firm -0 Free Cash Flow To Equity -1 -0 -0 -1 -48 219 233 -350 -84 -234 -59 Free Cash Flow per Share 0.00 0.00 0.00 -0.01 -0.16 -0.32 -0.22 -0.54 -0.35 -0.34 -0.25 Q.M.S Advisors | tel: +41 (0)78 922 08 77 | e-mail: info@qmsadv.com |
- 7. Company Analysis - Financials IV/IV Periodicity: 6/02 6/03 6/04 6/05 6/06 6/07 6/08 6/09 6/10 6/11 6/12 6/13E 6/14E 6/15E Ratio Analysis Valuation Ratios Price Earnings 192.9x 30.4x 14.8x EV to EBIT 13'176.3x EV to EBITDA 124.9x 100.0x 12.5x 8.6x Price to Sales 1'087.7x 39.8x 22.0x 10.5x 7.5x 2.9x 2.6x 2.2x 1.9x Price to Book 1.5x 0.7x 4.8x 10.7x 15.0x 3.8x 3.1x 4.4x 2.4x 1.7x 0.9x 1.0x 1.0x 0.9x Dividend Yield 0.0% 0.0% 0.0% 0.0% 0.0% 0.0% 0.0% 0.0% 0.0% 0.0% 0.0% 0.0% 0.1% 0.1% Profitability Ratios Gross Margin -263.6% 29.2% 40.6% 24.1% 16.7% 17.5% EBITDA Margin -1245.5% -5.5% -670.9% 10.4% -1.1% -37.3% 4.4% 29.6% 37.5% Operating Margin -1309.1% -17.2% -679.7% 0.1% -15.0% -51.3% -23.8% 10.9% 22.2% Profit Margin -1139.4% -38.4% -429.5% -22.6% -30.8% -47.2% -18.4% 4.6% 13.1% Return on Assets -34.9% -10.0% 2.3% -33.5% -7.3% -3.5% -1.6% -23.9% -2.7% -3.8% -7.3% -1.7% 2.1% 5.3% Return on Equity -41.3% -12.6% 2.7% -35.2% -8.9% -6.2% -3.1% -53.8% -6.2% -7.6% -14.3% -6.1% 1.6% 6.3% Leverage & Coverage Ratios Current Ratio 1.85 1.11 4.40 30.23 5.45 7.73 8.28 1.99 4.25 2.77 1.54 Quick Ratio 1.07 0.09 3.53 29.81 5.13 6.16 6.77 0.87 2.98 0.99 0.65 Interest Coverage Ratio (EBIT/I) -13.10 -8.87 -17.95 -27.88 -83.36 -3.63 -0.88 -55.88 0.05 -1.10 -5.16 Tot Debt/Capital 0.14 0.14 0.07 0.01 0.13 0.17 0.29 0.48 0.43 0.35 0.41 Tot Debt/Equity 0.16 0.17 0.08 0.01 0.16 0.21 0.41 0.93 0.75 0.53 0.70 Others Asset Turnover 0.00 0.00 0.00 0.00 0.00 0.00 0.04 0.06 0.12 0.12 0.15 Accounts Receivable Turnover 0.00 0.00 0.00 2.00 5.86 5.34 14.74 37.58 14.07 Accounts Payable Turnover 4.54 3.53 1.54 2.71 4.37 4.54 Inventory Turnover 0.63 1.24 0.86 1.57 1.55 1.66 Effective Tax Rate 0.0% Q.M.S Advisors | tel: +41 (0)78 922 08 77 | e-mail: info@qmsadv.com |
- 8. Company Analysis - Peers Comparision DENISON MINES URANIUM ONE FORTESCUE MOUNT GIBSON PALADIN ENERGY ENERGY RES AUST CAMECO CORP BHP BILLITON LTD ALUMINA LTD ILUKA RESOURCES CO INC METALS IRO Latest Fiscal Year: 06/2012 12/2012 12/2012 12/2011 12/2011 06/2012 12/2011 12/2011 06/2012 06/2012 52-Week High 2.01 1.83 26.43 1.74 3.45 39.34 1.41 18.40 6.18 1.32 52-Week High Date 14.03.2012 03.05.2012 22.02.2012 23.02.2012 29.02.2012 20.02.2013 14.02.2013 02.04.2012 22.03.2012 24.02.2012 52-Week Low 0.74 1.09 16.50 1.04 1.78 30.09 0.63 7.36 2.81 0.62 52-Week Low Date 16.11.2012 10.12.2012 16.11.2012 15.11.2012 07.12.2012 12.07.2012 18.07.2012 19.11.2012 06.09.2012 29.11.2012 Daily Volume 10'509'581 1'865'307 466'924 46'713 153'732 13'806'043 20'974'288 6'222'607 25'745'397 12'356'513 Current Price (2/dd/yy) 1.24 1.41 22.94 1.34 2.73 38.65 1.25 10.35 4.92 0.82 52-Week High % Change -38.3% -23.0% -13.2% -23.1% -20.9% -1.8% -11.0% -43.8% -20.4% -37.9% 52-Week Low % Change 67.6% 29.5% 39.0% 28.8% 53.4% 28.4% 100.0% 40.6% 75.1% 33.3% Total Common Shares (M) 835.6 517.7 395.4 384.7 957.2 5'297.6 2'440.2 416.4 3'113.8 1'085.5 Market Capitalization 1'037.8 727.4 9'069.3 532.8 2'613.1 192'806.5 3'507.8 4'333.6 15'319.9 894.3 Total Debt 838.5 - 1'530.0 0.2 782.8 28'330.0 490.6 164.0 8'501.0 47.0 Preferred Stock - - - - - - - - - - Minority Interest 52.4 - 0.6 - - 1'215.0 - - - - Cash and Equivalents 112.1 467.3 799.4 53.5 619.0 4'781.0 19.0 320.7 2'343.0 40.7 Enterprise Value 1'804.3 260.1 9'800.6 483.7 2'975.7 229'982.0 4'210.9 4'450.8 26'490.6 900.6 Valuation Total Revenue LFY 365.8 422.8 2'321.5 96.8 530.4 72'226.0 0.0 1'536.7 6'681.0 637.0 LTM 324.1 422.8 2'321.5 67.3 493.2 66'950.0 - 1'629.3 6'625.1 671.4 CY+1 408.5 397.0 2'612.5 38.1 532.0 69'060.4 0.1 1'074.2 8'287.8 886.9 CY+2 489.1 345.7 2'830.4 17.2 657.2 75'838.5 0.2 1'004.6 11'721.2 719.8 EV/Total Revenue LFY 5.0x 0.4x 3.7x 5.5x 5.1x 3.3x #DIV/0! 3.1x 3.9x 1.5x LTM 5.6x 0.4x 3.7x 7.9x 5.5x 3.5x - 3.0x 3.9x 1.5x CY+1 3.8x 0.9x 3.9x 12.9x 5.5x 3.3x 37093.8x 4.2x 3.1x 0.6x CY+2 3.1x 1.0x 3.6x 25.2x 4.6x 3.0x 24272.7x 4.4x 2.2x 0.6x EBITDA LFY (136.4) 86.4 729.0 0.7 331.7 33'421.0 - 1'012.6 2'830.0 538.1 LTM (134.0) 86.4 729.0 13.7 200.4 22'246.0 - 1'235.2 2'304.2 538.1 CY+1 18.0 72.8 777.4 (1.9) 244.6 29'441.0 (22.1) 714.6 3'087.7 394.7 CY+2 144.6 63.3 901.9 (23.4) 361.5 34'978.0 10.7 492.6 4'429.2 324.3 EV/EBITDA LFY -13.3x 2.2x 11.6x 722.8x 8.1x 7.1x - 4.8x 9.1x 1.7x LTM - 2.2x 11.6x 38.9x 13.4x 10.6x - 3.9x 11.2x 1.7x CY+1 85.8x 5.0x 13.1x - 12.1x 7.7x - 6.3x 8.4x 1.4x CY+2 10.5x 5.5x 11.3x - 8.4x 6.4x 357.1x 8.9x 5.7x 1.3x EPS LFY -0.05 - 0.99 -0.10 0.11 3.61 - 1.24 0.50 0.16 LTM -0.11 -0.42 0.99 -0.19 0.05 1.83 0.02 1.61 0.40 0.08 CY+1 (0.08) (0.27) 1.18 (0.05) 0.04 2.56 (0.02) 0.91 0.48 0.15 CY+2 0.04 (0.24) 1.33 (0.05) 0.12 3.03 (0.01) 0.55 0.71 0.13 P/E LFY - - 23.2x - 53.7x 21.8x 71.4x 6.4x 12.7x 10.0x LTM - - 23.2x - 53.7x 12.7x - - - - CY+1 - - 19.4x - 61.0x 15.5x - 11.3x 10.6x 5.6x CY+2 30.4x - 17.3x - 22.2x 13.1x - 19.0x 7.2x 6.2x Revenue Growth 1 Year 37.1% (35.1%) (2.6%) (24.6%) 62.3% 0.7% - 73.3% 22.8% (1.6%) 5 Year 33.8% 5.0% 15.5% 58.9% 178.8% 6.8% - 26.1% - 20.4% EBITDA Growth 1 Year (4603.4%) - (9.3%) (98.3%) 162.0% (12.1%) - 242.7% 2.1% 3.2% 5 Year - (11.1%) (4.1%) - - 8.0% - 30.8% - 38.7% EBITDA Margin LTM (41.3%) 20.4% 31.4% 20.3% 40.6% 33.2% - 75.8% 34.8% 84.5% CY+1 4.4% 18.3% 29.8% (5.0%) 46.0% 42.6% (19248.7%) 66.5% 37.3% 44.5% CY+2 29.6% 18.3% 31.9% (135.7%) 55.0% 46.1% 6797.5% 49.0% 37.8% 45.1% Leverage/Coverage Ratios Total Debt / Equity % 73.4% 0.0% 30.9% 0.0% 39.3% 43.0% 17.2% 10.7% 226.0% 3.7% FALSE FALSE FALSE FALSE Total Debt / Capital % 41.2% 0.0% 23.6% 0.0% 28.2% 29.7% 14.7% 9.7% 69.3% 3.6% FALSE FALSE FALSE FALSE Total Debt / EBITDA - 0.000x 2.099x 0.020x 4.231x 1.595x - 0.120x 5.541x 0.087x FALSE FALSE FALSE FALSE Net Debt / EBITDA - -5.411x 1.002x -2.959x 2.023x 1.366x - 0.095x 4.655x 0.012x FALSE FALSE FALSE FALSE EBITDA / Int. Expense -3.747x 2.931x 9.073x 19.316x 6.728x 44.266x - 83.686x 3.871x 85.257x FALSE FALSE FALSE FALSE Credit Ratings S&P LT Credit Rating - - BBB+ - BB- A+ BBB- - BB- - FALSE FALSE FALSE FALSE S&P LT Credit Rating Date - - 19.12.2003 - 11.11.2011 15.11.2010 29.08.2012 - 28.09.2012 - FALSE FALSE FALSE FALSE Moody's LT Credit Rating - - WR - - (P)A1 - - - - FALSE FALSE FALSE FALSE Moody's LT Credit Rating Date - - 17.01.2006 - - 15.11.2010 - - - - FALSE FALSE FALSE FALSE Q.M.S Advisors | tel: +41 (0)78 922 08 77 | e-mail: info@qmsadv.com |