2. Koz 2
BACKGROUND INFORMATION
Matter is anything that has mass and volume. The three common forms of matter on Earth,
called the states of matter, are solid, liquid, and gas. A solid has a definite shape and volume;
a liquid has a definite volume but no definite shape; a gas has no definite volume or shape.
Substances commonly exist in one of the three states, but they can be in any one of the three
states depending on temperature. For example, water is commonly a liquid, but when cooled it
forms a solid called ice. When liquid water is heated, it forms a gas.
The state of matter doesn't change the kind of particles of which a substance is made. Instead,
the states of matter differ in how close their particles are as well as how tightly bonded the
particles are. For example, each particle of liquid, gas, or solid water is made of one atom of
oxygen combined with two atoms of hydrogen. Water particles in the gas state are far apart.
Liquid water particles are closer together, and some are bonded to one another. Solid water
particles, called ice, are close together and are the most tightly bonded.
When water changes from one state to another, there is a gain or loss of energy. States of
matter in order from least to most energy are solid, liquid, gas. To change to a higher energy
state, such as when water changes from ice (solid) to liquid or from a liquid to a gas, heat
must be added. The process of changing from a solid to a liquid is called melting. The process
of changing from a liquid to a gas is called vaporizing.
If vaporization happens at the surface of a liquid, the process is called evaporation. The
gaseous state of a substance at a temperature at which that substance is usually in a solid or
liquid state is called a vapor. When water evaporates, vapor is formed. Evaporation rate is the
amount of liquid that evaporates in a certain amount of time.1
When it evaporates, the liquid water in a lake, a stream, or the ocean changes to water vapor
and rises into the air. Depending on temperature and other weather conditions, the water
vapor will eventually condense into clouds and fall again to Earth as a liquid (rain), a solid
3. Koz 3
(snow, sleet, or hail), or it may condense on surfaces as dew. Several different factors can
affect the rate of evaporation, including heat, wind, relative humidity, and surface area. The
rate of evaporation increases as the heat from the Sun increases, the wind strengthens, the
relative humidity decreases, and the surface area expands.2
AIM: The intent of this investigation is to observe the effects on the surface area in the
evaporation rate.
RESEARCH QUESTION: How does surface area effects the evaporation rate?
HYPOTHESIS: If the surface area increases, then the rate of evaporation increases.
4. Koz 4
VARIABLES
Independent
Variables: Surface Area of Liquid/cm2
The surface area of the liquid did not change
during the experiment and the radius of the
container measured by the ruler and calculated
the formul of the πr2
.
Dependent
Variables:
Period of the Time /s (0, 2, 4,
6, 8, 10)
The period of the time was constant during the
experiment. The period of the time can be
changed the evaporation rate.
Room Temperature/°C (25°C)
The initial volume of the water was constant
during the experiment and measured by the
thermometer. It caused of the difference
between the evaporation rate.
Controlled
Variables:
Length between the Container
and Heater/ cm (3 cm)
The length between the container and heater
measured by the ruler. If it was changed, the
the reaction time changed.
Initial Volume of the
Water/mL (50 mL)
The initial volume of the water was same
during the experiment and measured by the
graduated cylinder. If the volume of the
graduated cylinder changed, evaporation rate
can be changed as well.
5. Koz 5
MATERIALS
Different Radius of Container (x3)
150 mL water
50 mL Graduated Cylinder (±0.5)
30 cm Ruler (±1)
Temperature
Small Funnel
Dropper
Heater
PROCEDURE
i. Draw the surface of the small containers on paper.
ii. Measure the radius of the small container and calculate the surface area of the
containers.
iii. Put 50 mL water into the small container as shown in the Figure 1.
iv. Ignite the wick and take the records of the rest volume of water by the aid of graduated
cylinder and small funnel in 2nd
, 4th
, 6th
, 8th
and 10th
minutes.
v. Repeat the process i, ii, iii and iv for the other containers.
vi. Repeat the experiment again for 5 times.
6. Koz 6
Figure 1
DATA COLLECTION & PROCESSING
Calculation 1:
Take the π=3.
Calculate the area of the small container:
The diameter of the container is 10 cm.
The radius of the container is 5 cm.
2𝜋𝑟2
= 2𝜋52
𝐴 = 150 𝑐𝑚2
Calculate the area of the middle container:
The diameter of the container is 16 cm.
The radius of the container is 8 cm.
2𝜋𝑟2
= 2𝜋82
𝐴 = 384𝑐𝑚2
Calculate the area of the big container:
The diameter of the container is 24 cm.
7. Koz 7
The radius of the container is 12 cm.
2𝜋𝑟2
= 2𝜋(12)2
𝐴 = 864𝑐𝑚2
Table 1: Evaporation Rate of the Small Container
Calculation 2:
Take the average of the volume of water in 0th
second.
50.0 + 50.0 + 50.0 + 50.0 + 50.0
5
= 50.0
Take the average of the volume of water in 120th
seconds.
45.6 + 42.9 + 43.4 + 46.3 + 45.3
5
= 44.7
Time/s Volume of the Water/ mL
±1s Trial 1 Trial 2 Trial 3 Trial 4 Trial 5
0 50.0 50.0 50.0 50.0 50.0
120 45.6 42.9 43.4 46.3 45.3
240 38.5 37.3 39.0 39.2 38.7
360 35.7 34.3 36.4 35.0 33.8
480 26.3 29.9 31.2 27.6 29.2
600 22.4 25.7 26.7 24.9 25.3
8. Koz 8
Take the average of the volume of water in 240th
seconds.
38.5 + 37.3 + 39.0 + 39.2 + 38.7
5
= 38.5
Take the average of the volume of water in 360th
seconds.
35.7 + 34.3 + 36.4 + 35.0 + 33.8
5
= 35.0
Take the average of the volume of water in 480th
seconds.
26.3 + 29.9 + 31.2 + 27.6 + 29.2
5
= 28.8
Take the average of the volume of water in 600th
seconds.
22.4 + 25.7 + 26.7 + 24.9 + 25.3
5
= 25.0
Table 2: Evaporation Rate of the Middle Container
Time/s Volume of the Water/ mL
±1s Trial 1 Trial 2 Trial 3 Trial 4 Trial 5
0 50.0 50.0 50.0 50.0 50.0
120 40.5 43.0 41.5 39.9 41.6
240 36.0 33.6 37.0 35.3 35.8
9. Koz 9
360 30.7 29.4 31.1 29.8 32.4
480 25.5 24.9 26.6 27.2 25.9
600 16.5 12.7 17.8 15.0 16.3
Calculation 3: Repeat the Calculation 2 process for the Table 2.
Table 3: Evaporation Rate of the Big Container
Time/s Volume of the Water/ mL
±1s Trial 1 Trial 2 Trial 3 Trial 4 Trial 5
0 50.0 50.0 50.0 50.0 50.0
120 36.7 38.9 40.2 37.5 38.5
240 21.5 25.7 29.7 22.3 24.6
360 14.6 16.1 16.7 15.2 15.9
480 7.4 8.9 9.3 8.3 9.6
600 2.9 5.4 4.7 3.8 5.2
Calculation 3: Repeat the Calculation 2 process for the Table 3.
Rearranged the data as shown in the Table 4.
Table 4: Average Evaporation Rate of Containers
Time/s Area of Container/ cm2
±1s 150 384 662
10. Koz 10
0 50.0 50.0 50.0
120 44.7 41.3 38.4
240 38.5 35.5 24.8
360 35.0 30.7 15.7
480 28.8 26.2 8.7
600 25.0 15.7 4.4
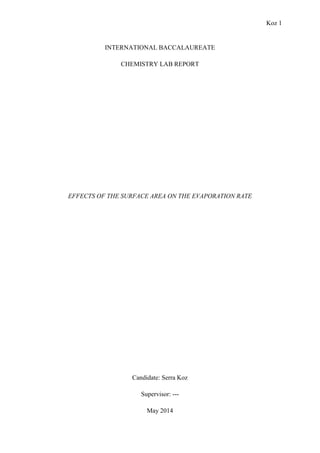
Graph 1: Volume and Time Graph of Small, Middle and Big Container
Error bars in horizontal axis calculated by the uncertainty of the chronometer which is ±1s.
Error bars in vertical axis calculated by the uncertainty of the graduated cylinder which is
±0.5.
Qualitative Data:
1. There is no color change during the experiment.
0
10
20
30
40
50
60
-100 0 100 200 300 400 500 600 700
VolumeofWater/mL(±0.5)
Time/s (±1)
Small Container
Middle Container
Big Container
11. Koz 11
2. While the water was heated, the bubbles observed on the surface and bottom of the
container.
CONCLUSION & EVALUATION
This experiment investigates the relationship between surface area and evaporation rate. As
hypothesis refers to if the surface area of the solution increases, time taken for the evaporation
increases.
50 mL water measured and put in the containers and every 2 minutes, rest of the volume
measured by the help of graduated cylinder. Consequently, the data is as follows:
According to Table 1, Table 2, Table 3 and Table 4 the evaporation rate is affected by the
surface area of the container. For the surface area of the 150 cm2
in 120th
seconds, rest of the
volume was measured 45.6, 42.9, 43.4, 46.3 and 45.3. The rest of the volume was measured
38.5, 37.3, 39.0, 39.2 and 38.7 in 240th
seconds. The rest of the volume was measured 35.7,
34.3, 36.4, 35.0 and 33.8 in 360th
seconds. The rest of the volume was measured 26.3, 29.9,
31.2, 27.6 and 29.2 in 480th
seconds. The rest of the volume was measured 22.4, 25.7, 26.7,
24.9 and 25.3 in 600th
seconds.
For the surface area of the 384 cm2
in 120th
seconds, rest of the volume was measured 40.5,
43.0, 41.5, 39.9 and 41.6. The rest of the volume was measured 36.0, 33.6, 37.0, 35.3 and
35.8 in 240th
seconds. The rest of the volume was measured 30.7, 29.4, 31.1, 29.8 and 32.42
in 360th
seconds. The rest of the volume was measured 25.5, 24.9, 26.6, 27.2 and 25.9 in 480th
seconds. The rest of the volume was measured 16.5, 12.7, 17.8, 15.0 and 16.3 in 600th
seconds.
For the surface area of the 864 cm2
in 120th
seconds, rest of the volume was measured 36.7,
38.9, 40.2, 37.5 and 38.5. The rest of the volume was measured 21.5, 25.7, 29.7, 22.3 and
24.6 in 240th
seconds. The rest of the volume was measured 14.6, 16.1, 16.7, 15.2 and 15.9 in
360th
seconds. The rest of the volume was measured 7.4, 8.9, 9.3, 8.3 and 9.6 in 480th
seconds.
The rest of the volume was measured 2.9, 5.4, 4.7, 3.8 and 5.2 in 600th
seconds.
The average rate of the evaporation is shown by the Table 4. For the 150 cm2
container, the
average rest of the volume is 50.0, 44.7, 38.5, 35.0, 28.8 and 25.0 in the 0th
, 2nd
, 4th
, 6th
, 8th
and 10th
minutes respectively. For the 384 cm2
container, the average rest of the volume is
50.0, 41.3, 35.5, 30.7, 26.2 and 15.7 in the 0th
, 2nd
, 4th
, 6th
, 8th
and 10th
minutes respectively.
12. Koz 12
For the 864 cm2
container, the average rest of the volume is 50.0, 38.4, 24.8, 15.7, 8.7 and 4.4
in the 0th
, 2nd
, 4th
, 6th
, 8th
and 10th
minutes respectively.
According to the observations (qualitative data), Table 1, Table 2, Table 3, Table 4 and Graph
1 the rate of evaporation is faster in the large amount of surface area. Thus, results support the
hypothesis and the experiment results are reliable.
PREFERANCES
1. http://www.education.com/science-fair/article/effect-surface-area-evaporation-rate/
2. http://www.sccoos.org/docs/Evaporation%20Investigation.pdf