Documentation and Metdata - VA DM Bootcamp
•Télécharger en tant que PPTX, PDF•
5 j'aime•2,481 vues

This document discusses documentation and metadata for research data. It begins with an overview of why documentation is important at different stages of the research data lifecycle from collection through archiving. Key elements to document include how the data was created, its content and structure, who created and maintains it, and how it can be accessed and cited. The document then discusses common documentation formats like readmes, data dictionaries, and codebooks. It also introduces metadata as structured information that describes resources and explains common metadata standards and tools for creating structured metadata files. Exercises guide creating documentation in these formats for a weather dataset example.

Recommandé
Recommandé
Contenu connexe
Tendances
Tendances (20)
En vedette
En vedette (20)
Similaire à Documentation and Metdata - VA DM Bootcamp
Similaire à Documentation and Metdata - VA DM Bootcamp (20)
Plus de Sherry Lake
Plus de Sherry Lake (16)
Dernier
Dernier (20)
Documentation and Metdata - VA DM Bootcamp
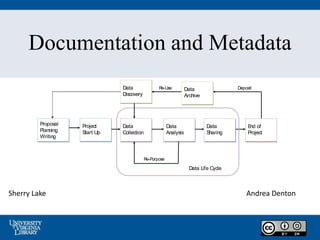
- 1. Documentation and Metadata Sherry Lake Data Life Cycle Re-Purpose Re-Use Deposit Data Collection Data Analysis Data Sharing Proposal Planning Writing Data Discovery End of Project Data Archive Project Start Up Andrea Denton
- 2. We’ll Explore • Why is documenting your research important? • What do you document (files? datasets? projects? Hands-on • What are the common types of documentation? • Metadata: What is it? Why is it important? Hands-on • Q & A
- 3. You’re already documenting your data • Notebook – Paper – Digital – Lab • Folders with notes, text files • Sources, experiments or surveys, procedures, etc.
- 4. Critical roles of data documentation • Data Use – To know enough details about how the how the data were collected and stored • Data Discovery – To be able to identify important data sets • Data Retrieval – To know how and where to access data • Data Archiving – Data can grow more valuable with time, but only if the critical information required to retrieve and interpret the data remains available
- 5. Information EntropyInformationContentofDataandMetadata Time of data development Specific details about problems with individual items or specific dates are lost relatively rapidly General details about datasets are lost through time Accident or technology change may make data unusable Retirement or career change makes access to “mental storage” difficult or unlikely Loss of investigator leads to loss of remaining information TIME From Michener et al 1997 http://dx.doi.org/10.1890/1051-0761(1997)007[0330:NMFTES]2.0.CO;2)
- 6. Elements of Documentation Good data documentation answers these basic questions: • Why were the data created? • What is the data about? • What is the content of the data? The structure? • Who created the data? • Who maintains it?
- 7. Elements of Documentation, continued • How were the data created? • How were the data produced/analyzed? • Where was it collected (geographic location)? • When were the data collected? When were they published? • How should the data be cited?
- 8. Documentation throughout your research Variable or Item Level File or Dataset Level Project or Study Level • Labels, codes, classifications • Missing values (and how they are represented) • Inventory of data files • Relationship between those files • Records, cases, etc. • What the study set out to do; research questions • How it contributes new knowledge to the field • Methodologies used, instruments and measures UK Data Service: http://ukdataservice.ac.uk/media/440277/documentingdata.pdf/
- 9. Exercise 1: Exploring Documentation • Refer to the files on the Data Management Bootcamp site, either – http://guides.lib.odu.edu/VADMBC/materials • In the section Documentation and Metadata Exercise_1_Data_Documentation Worksheet – Or, you may have a handout “Exercise 1”
- 10. Exercise 1: Exploring Documentation • For Column 1, take 2-3 minutes and, for each row, write down what general concept (who, what, when, where, how, or why, or a combination of these) that field describes about data, if applicable. • Now take 2-3 minutes to complete Column 2. Considering your research data, what information would you provide for each field? • Don’t have research data? Use the file DailyWeather to fill in Column 2.
- 11. Exercise 1 continued • Take 2 minutes • There is a blank row under each category for any information specific to your field, e.g. latitude and longitude, species, etc. • Please share an example with the class in the Google doc “Questions: Ask them here”
- 12. Wrapping up: elements of documentation • We’ve looked at commonly used fields • What does your discipline say about what you should document? • The answers you’ve provided could be used to create a data dictionary – we’ll examine next
- 13. Types of Documentation • ReadMe File • Data Dictionary • Codebook
- 14. ReadMe • Describes the core documentation about an investigation and its data files • Typically a simple text file • Can describe the individual file(s) and/or data package as a whole
- 15. ReadMe Example - File
- 16. ReadMe Example - File
- 17. ReadMe Example - Dataset
- 18. Data Dictionary • Provides definitions of the data fields in a data file • More details on the variables, observations of a file
- 19. Data Dictionary • Used to understand the data and the databases that contain it • Identifies data elements and their attributes including names, definitions and units of measure and other information • Often they are organized as a table http://www.pnamp.org/sites/default/files/best_practices_for_data_dictionary_definitions_ and_usage_version_1.1_2006-11-14.pdf
- 20. Data Dictionary Example: the dataset http://www.ncbi.nlm.nih.gov/projects/gap/cgi-bin/GetPdf.cgi?document_name=HowToSubmit.pdf
- 21. Data Dictionary Example: the dictionary
- 22. Exercise 2: Data Dictionary • Refer to the files on the Data Management Bootcamp site, either – http://guides.lib.odu.edu/VADMBC/materials • In the section Documentation and Metadata Exercise_2_DataDictionaryTemplate – Or, you may have a handout “Exercise 2” • Open the file DailyWeather Weather data source: http://www.ncdc.noaa.gov/cdo- web/search?datasetid=GHCND
- 23. • Use the Daily Weather dataset – Two worksheets (tabs) • Data • Definitions • Start by answering the questions • Fill out a data dictionary for this dataset Exercise 2: Data Dictionary Creation
- 25. What is a Codebook? • Typical in social sciences research • Includes elements similar to readme and dictionary – Project level information (e.g. survey design and methodology) – Response codes for each variable – Codes used to indicate nonresponse and missing data http://www.icpsr.umich.edu/icpsrweb/ICPSR/support/faqs/2006/01/what-is- codebook
- 26. What is a Codebook? • Additionally, codebooks may also contain: – A copy of the survey questionnaire (if applicable) – Exact questions and skip patterns used in a survey – Frequencies of response • Quite long! http://www.icpsr.umich.edu/icpsrweb/ICPSR/s upport/faqs/2006/01/what-is-codebook
- 29. Other Examples of Data Documentation • Lab notebooks • Software syntax • Programming code • Instrument settings and/or calibration • Provenance of sources of data • Embedded metadata (e.g. EXIF, FITS)
- 30. Metadata • What is it? – Information that describes a resource – NISO: “metadata is structured information that describes, explains, locates, or otherwise makes it easier to retrieve, use, or manage an information resource” • Why is it important? – Enables a resource or data to be easily discovered – Good metadata will help others understand and use your data
- 31. Metadata in Everyday Life DataONE Education Module: Metadata. DataONE. Retrieved Nov 12, 2012. From http://www.dataone.org/sites/all/documents/L07_Metadata.pptx Author(s) Boullosa, Carmen. Title(s) They're cows, we're pigs / by Carmen Boullosa Place New York : Grove Press, 1997. Physical Descr viii, 180 p ; 22 cm. Subject(s) Pirates Caribbean Area Fiction. Format Fiction
- 32. Metadata Formats • Documentation for understanding & re-use – Readme File – Data Dictionary – Codebook • Structured documentation in XML format for use in programs (few examples) – DDI – FGDC – EML
- 33. Exercise 3: XML File Creation • Refer to the files on the Data Management Bootcamp site, either – http://guides.lib.odu.edu/VADMBC/materials • In the section Documentation and Metadata Exercise_3_Weather-DDI-XML-FillinBlanks – Or, you may have a handout “Exercise 3”
- 34. Exercise 3: XML File Creation • Take the file Weather-DDI-XML and fill in the blanks (as best you can) using: • the file DailyWeather • and/or Exercise 2 Data Dictionary
- 38. Structured XML A Few Standard Schemes (XML) – DDI– Data Document Initiative http://www.ddialliance.org/ – FGDC– Geospatial Metadata Standard http://www.fgdc.gov/metadata/geospatial-metadata- standards – EML– Ecological Metadata Language http://knb.ecoinformatics.org/software/eml/
- 39. FGDC Example
- 40. Structured Metadata Tools Tools – Colectica add-on for Excel (DDI) – Nesstar (DDI) – Metavist (FGDC) – ArcGIS (FGDC) * – Morpho (EML) http://data.library.virginia.edu/data-management/plan/metadata/metadata-workshop/
- 41. Example 1: Nesstar DDI Tool
- 42. Example 2: Metavist FGDC Tool
- 43. Metadata Concept Map by Amanda Tarbet is licensed under a Creative Commons Attribution- NonCommercial-ShareAlike 3.0 Unported License. Metadata Standards
- 44. Metadata Wrap-up How to chose a metadata standard or documentation format? • What does your discipline use? • Look at what depositing repository requires
- 45. Research Life Cycle Data Life Cycle Re- Purpose Re- Use Deposit Data Collection Data Analysis Data Sharing Proposal Planning Writing Data Discovery End of Project Data Archive Project Start Up
- 46. QUESTIONS?
Notes de l'éditeur
- In fact, you probably already have metadata in some form. You just may not recognize it as such. For instance, among your work records, you certainly have notebooks stuffed with color-coded pages or assorted keys to your data stored on your computer. Perhaps the most common form of metadata that you may already have is a file folder filled with notes on your data sources and the procedures that you used to build your data. However, unless you’ve been unusually diligent, your information is probably not organized so that a stranger could stroll into your office at any time, and read and understand it easily.
- From: EML Best Practices for LTER Sites – Oct. 2004 Identification:----locate Minimum content for adequate data set discovery in a general cataloging system or repository title creator contact publisher pubDate keywords abstract (recommended) dataset/distribution (i.e. url for general dataset information) Discovery: Level 1 content, plus coverage information to support targeted searches, adding elements: Geographic Coverage Taxonomic Coverage Temporal Coverage Evaluation Level 2 content, plus data set details to enable end-user evaluation of the methodology and data entities, adding elements: Intellectual Rights project methods dataTable/entityGroup dataTable/attributes Access Level 3 content plus data access details to support automated data retrieval, adding elements: access physical Integration: Level 4 content plus complete attribute and quality control details to support computer-assisted data integration and re-sampling, adding elements: Attribute List (full descriptions) Constraint Quality Control
- This graph illustrates the phenomenon of “information entropy”, associated with research. At the time of the research project, a scientists memory is fresh. Details about the development of the dataset are easily recalled, and it is a good time to document information about the process. Over time, memory of the details begins to fade. A variety of circumstances can intervene, and eventually detailed knowledge about the dataset fades. Without a metadata record, this data might be unusable. A dataset it not considered complete without a metadata record to accompany it. Michener, W. , et al. (1997). Nongeospatial Metadata for the Ecological Sciences. Ecological Applications, 7(1), 330–342.
- Good metadata answers a wide range of questions, including:
- Good metadata answers a wide range of questions, including:
- UK Data Service http://www.data-archive.ac.uk/create-manage/document MANTRA Project level: A complete academic thesis normally contains this information in detail, but a published article may not. If a dataset is shared, a detailed technical report will need to be included for the user to understand how the data were collected and processed. You should also provide a sample bibliographic citation to indicate how you would like secondary users of your data to cite it in any publications, etc.
- Explain instructions
- Fix this!!
- Part Two Three methods or ways to represent or describe your data. Text file. Next slide Hmm, can we really explain what “unstructured” is until we explain what “structured” is? Maybe not focus on that as much until later?
- A simple data dictionary is an organized collection of data element names and definitions, arranged in a table.
- Here is a dataset – what does it mean? What does each column represent?
- This dictionary helps interpret the data (spreadsheet) by providing the link between the variable names and what they represent (in the description). It also tells you about what type of data we should expect, and what the specific values might be.
- Explain instructions
- Bottom of worksheet is typical format for a data dictionary. Use the dataset to fill out the dictionary. Some of the answers to the questions may help them with the dictionary or vice versa
- This is a partial dataset of a more complete Daily Weather database held at the National Climatic Data Center. If you want to know more details about this partial data set, a file with complete documentation about The data collection and all the variables, you can look at the file “DailyWeather_Complete Documentation” on the libguide materials page. Need units to understand and compare or use w/ other data files PRCP: tenth of mm = .1 mm….. 147, 84…. 14.7mm (.6 in), 8.4 mm (.33 in) TMAX: Celsius to tenths, 94 = 9.4C … 49F, .6C…33F TMIN: Celsius to tenths, -93 = -9.3C.. 15F Without codes defined, impossible to deduce Column headings should be unique (Measurement Flag & Source Flag) As you look at this dataset, and other sources of data, think about what information you need to duplicate or use, or understand the meaning of the data (observations). Keep your answers for this exercise handy, as you will use them for exercise #3.
- Data dictionary is part of the codebook, along with… Typically Social Science Includes narrative about project level information (might be your readme!) Can be very long
- Below is a diagram of the details included in most codebooks. This is a simple example of a codebook. In a complex survey,there will be more details about the flow of questions asked and the electronic organization of the data. In addition to question text, the most important items are variable names, values, value labels, and column locations. Try to find them in the example below and familiarize yourself with the layout of a codebook. Here is an explanation of the codebook image above.The circled red numbers relate to each ofthe subject headings below. 1) Item or Variable Name This is usually a mnemonic, or nickname assigned to an individual question.2) Variable LabelA short summary or description of question content.3) Card and Column Locations Indicates the electronic location of numerically coded responses to questions.4) Question TextExact text of a question as delivered to a respondent.5) Values and Value LabelsDescribes the numeric and textual response options or categories to questions.6) Valid ResponsesIndicates the allowed numeric codes to question responses.7) BranchingIndicates the flow of the questionnaire.
- The Excel spreadsheet, your datasets might not be their data – e.g. other types that the data dictionary might not easily describe Your code, your SPSS
- With regards to research….. What is Metadata? Information about research/resource can also be in an unstructured format. In a “structual” format, I’m talking about a machine readable format, that search engines and other programs can read and interpret. It enables a resource or data to be easily discovered. As well as…. Help others understand and use your data. It doesn’t necessarily replace the types of documentation we have been talking about, those are more for “humans” for understandability (and are considered “metadata”…. Just with lots of words). Structural metadata has a different purpose.
- Metadata is all around us. . .from Mp3 players, to nutrition labels, to library card catalogues. For example, a card catalogue tell us more information than just the title of the book, they also tells the user: Who is the author? Who published the book? What subject area does the book fall in? And finally, where is it located in the library? Another example of metadata that we see in our daily lives is the nutrition and ingredient information on food labels. Nutrition labels answer questions such as: What ingredients were used? Who made the food? How many calories per serving? How many servings in the can? What percentage of daily vitamins are in each serving? And in case you didn’t know most of our productivity software (word, PDF files, iPhoto, etc.) creates (and allow you to add) metadata.
- The same information that goes into the documentation, goes into structured metadata. The format most widely used is in XML, at HTML-like (ASCII) file. These are 3 different standards, of many (I’ll talk a little bit about the differences in later slides) in 3 different disciplines – focused on the type of data generated: DDI for Social Science, more geared toward interviews, surveys, etc. FGDC for GIS (geospatial, map related) and EML – ecological metadata for life sciences. In addition to being used for searching, Also in this structured format allows programs to convert one version of the XML to another, call this cross-walk. Allows interdisciplinary work. Structured XML used for searching, cross-walk between metadata standards.
- We are now going to create (actually fillin the blanks) an XML file using the standard DDI. Use the file online, or handout
- You will need to use the DailyWeather file and/or the Data Dictionary you created in exercise #2 to fill in the blanks. You have 5 min.
- This XML file, as all XML files are text files, indentation does not matter, I just tried to indent to show the “levels”. Each metadata standard has fields, some required, some not. How easy was this to “fill in the blanks”? Would you be able to create this from scratch? How would you know what to include (mandatory) for the particular XML schema? I’ll add a file with the “answers” to this section on the libguide later this after noon.
- This section has more of the description details, subject (keyword), abstract, time coverage, geographical coverage. Not all fields are used for all data.
- How easy was this to “fill in the blanks”? Would you be able to create this from scratch? How would you know what to include (mandatory) for the particular XML schema? These last two sections are “file” related. About the software that generated the file, and about the particular variables in each file (the information that you would find in a data dictionary?) I’ll add a file with the “answers” to this section on the libguide later this after noon.
- Web page has examples of these xml files. Uses standards: An established standard provides common terms, definitions and structure that allow for consistent communication. The use of standards also support search and retrieval in automated systems. A Standard provides a structure to describe data with: Common terms to allow consistency between records Common definitions for easier interpretation Common language for ease of communication Common structure to quickly locate information In search and retrieval, standards provide: Documentation structure in a reliable and predictable format for computer interpretation A uniform summary description of the dataset Many standards collect similar information Factors to consider: Your data type: (GIS – rastor/vector, ecological); Organizations policies; available resources (tools).
- Already have DDI example (full XML file), put a few FGDC snippets here so you can compare the different “tags” or elements, or fields from DDI to FGDC.
- I asked this question before: Would you be able to create this from scratch? Well the answer is maybe you don’t have to. This is a short list of “free” metadata creation tools. Unfortunately, the top three do not work on Macs. ArcCatalog, part of the ArcGIS software is also a good tool to use. And other software you may already be using, SPSS, ArcGIS, SAS already have some sort of documentation/metadata capture (export) feature.
- Screen shot of the tool Nesstar to create DDI metadata. This is a fill in the blank for fields, citation (title – author) and for description (keywords, abstract). This tool as do all the others, have an export function that creates the XML file for you.
- Here is an example of the tool Metavist for creating FGDC metadata. Here each “section” is a tab across the top. With fill-in the blanks.
- As I said, each discipline has different and maybe various metadata standards. I would say the sciences have the “most”, but having many standards isn’t good.
- Knowing the requirements for documentation at the start will enable you to design your data collection materials for easier metadata creation and facilitate your documentation creation. ICPSR: Deposits should include all data and documentation necessary to independently read and interpret the data collection. To deposit, you need, of course the data file(s), documentation for those files and a study description. Open ICPSR walks you through w/ fill-in blanks to fields. Dryad:We strongly encourage submitters to include one or more ReadMe files that provide additional information to help users make sense of the files (e.g., instructions for use with software scripts, variable abbreviations, measurement units, and data codes). View additional guidance on ReadMe files. A ReadMe file is intended to help ensure that your data can be correctly interpreted and reanalyzed by others.
- It is important to begin to document your data at the very beginning of your research project and continue throughout the project. By doing so will make data documentation easier and reduce the likelihood that you will forget aspects of your data later in the research project. Don’t wait until the end to start to document your research project and its data! In order for the data to be used properly once it’s been archived the data must be documented. Data documentation (otherwise known as Metadata) enables you to understand the data in detail, enable others to find it, use it and properly cite it. It’s all about re-use, for you or someone else: When you provide data to someone else, what types of information would you want to include with the data? When you receive a dataset from an external source, what types of details do you want to know about the data? Reproducibility! (Dryad) Submitters should aim to provide sufficient data and descriptive information such that another researcher would be able to evaluate the findings described in the publication. This will generally include any data that are used in statistical tests, as well the individual data points behind published figures and tables.