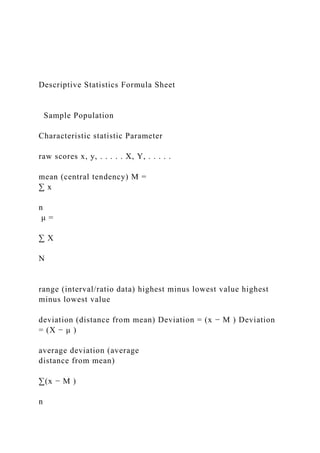
Descriptive Statistics Formula Sheet
Sample Population
Characteristic statistic Parameter
raw scores x, y, . . . . . X, Y, . . . . .
mean (central tendency) M =
∑ x
n
μ =
∑ X
N
range (interval/ratio data) highest minus lowest value highest minus lowest value
deviation (distance from mean) Deviation = (x − M ) Deviation = (X − μ )
average deviation (average
distance from mean)
∑(x − M )
n
= 0
∑(X − μ )
N
sum of the squares (SS)
(computational formula) SS = ∑ x
2 −
(∑ x)2
n
SS = ∑ X2 −
(∑ X)2
N
variance ( average deviation2 or
standard deviation
2
)
(computational formula)
s2 =
∑ x2 −
(∑ x)2
n
n − 1
=
SS
df
σ2 =
∑ X2 −
(∑ X)2
N
N
standard deviation (average
deviation or distance from mean)
(computational formula) s =
√∑ x
2 −
(∑ x)2
n
n − 1
σ =
√∑ X
2 −
(∑ X)2
N
N
Z scores (standard scores)
mean = 0
standard deviation = ± 1.0
Z =
x − M
s
=
deviation
stand. dev.
X = M + Zs
Z =
X − μ
σ
X = μ + Zσ
Area Under the Normal Curve -1s to +1s = 68.3%
-2s to +2s = 95.4%
-3s to +3s = 99.7%
Using Z Score Table for Normal Distribution
(Note: see graph and table in A-23)
for percentiles (proportion or %) below X
for positive Z scores – use body column
for negative Z scores – use tail column
for proportions or percentage above X
for positive Z scores – use tail column
for negative Z scores – use body column
to discover percentage / proportion between two X values
1. Convert each X to Z score
2. Find appropriate area (body or tail) for each Z score
3. Subtract or add areas as appropriate
4. Change area to % (area × 100 = %)
Regression lines
(central tendency line for all
points; used for predictions
only) formula uses raw
scores
b = slope
a = y-intercept
y = bx + a
(plug in x
to predict y)
b =
∑ xy −
(∑ x)(∑ y)
n
∑ x2 −
(∑ x)2
n
a = My - bMx
where My is mean of y
and Mx is mean of x
SEest (measures accuracy of predictions; same properties as standard deviation)
Pearson Correlation Coefficient
(used to measure relationship;
uses Z scores)
r =
∑ xy−
(∑ x)(∑ y)
n
√(∑ x2−
(∑ x)2
n
)(∑ y2−
(∑ y)2
n
)
r =
degree x & 𝑦 𝑣𝑎𝑟𝑦 𝑡𝑜𝑔𝑒𝑡ℎ𝑒𝑟
degree x & 𝑦 𝑣𝑎𝑟𝑦 𝑠𝑒𝑝𝑎𝑟𝑎𝑡𝑒𝑙𝑦
r
2
= estimate or % of accuracy of predictions
PSYC 2317 Mark W. Tengler, M.S.
Assignment #9
Hypothesis Testing
9.1 Briefly explain in your own words the advantage of using an alpha level (α) = .01
versus an α = .05. In general, what is the disadvantage of using a smaller alpha
level?
9.2 Discuss in your own words the errors that can be made in hypothesis testing.
a. What is a type I error? Why might it occur?
b. What is a type II error? How does it happen?
9.3 The term error is used in two different ways in the context of a hypothesis test.
First, there is the concept of sta
Descriptive Statistics Formula Sheet Sample Populatio.docx
1. Descriptive Statistics Formula Sheet
Sample Population
Characteristic statistic Parameter
raw scores x, y, . . . . . X, Y, . . . . .
mean (central tendency) M =
∑ x
n
μ =
∑ X
N
range (interval/ratio data) highest minus lowest value highest
minus lowest value
deviation (distance from mean) Deviation = (x − M ) Deviation
= (X − μ )
average deviation (average
distance from mean)
∑(x − M )
n
2. = 0
∑(X − μ )
N
sum of the squares (SS)
(computational formula) SS = ∑ x
2 −
(∑ x)2
n
SS = ∑ X2 −
(∑ X)2
N
variance ( average deviation2 or
standard deviation
2
)
(computational formula)
s2 =
∑ x2 −
(∑ x)2
n
n − 1
3. =
SS
df
σ2 =
∑ X2 −
(∑ X)2
N
N
standard deviation (average
deviation or distance from mean)
(computational formula) s =
√∑ x
2 −
(∑ x)2
n
n − 1
σ =
√∑ X
2 −
(∑ X)2
N
N
Z scores (standard scores)
4. mean = 0
standard deviation = ± 1.0
Z =
x − M
s
=
deviation
stand. dev.
X = M + Zs
Z =
X − μ
σ
X = μ + Zσ
Area Under the Normal Curve -1s to +1s = 68.3%
-2s to +2s = 95.4%
-3s to +3s = 99.7%
5. Using Z Score Table for Normal Distribution
(Note: see graph and table in A-23)
for percentiles (proportion or %) below X
for positive Z scores – use body column
for negative Z scores – use tail column
for proportions or percentage above X
for positive Z scores – use tail column
for negative Z scores – use body column
to discover percentage / proportion between two X values
1. Convert each X to Z score
2. Find appropriate area (body or tail) for each Z score
3. Subtract or add areas as appropriate
4. Change area to % (area × 100 = %)
Regression lines
(central tendency line for all
points; used for predictions
only) formula uses raw
scores
b = slope
a = y-intercept
y = bx + a
(plug in x
to predict y)
6. b =
∑ xy −
(∑ x)(∑ y)
n
∑ x2 −
(∑ x)2
n
a = My - bMx
where My is mean of y
and Mx is mean of x
SEest (measures accuracy of predictions; same properties as
standard deviation)
Pearson Correlation Coefficient
(used to measure relationship;
uses Z scores)
r =
∑ xy−
(∑ x)(∑ y)
n
√(∑ x2−
(∑ x)2
7. n
)(∑ y2−
(∑ y)2
n
)
r =
degree x & � ���� �����ℎ��
degree x & � ���� ����������
r
2
= estimate or % of accuracy of predictions
PSYC 2317 Mark W. Tengler, M.S.
Assignment #9
Hypothesis Testing
9.1 Briefly explain in your own words the advantage of using an
alpha level (α) = .01
versus an α = .05. In general, what is the disadvantage of using
a smaller alpha
level?
8. 9.2 Discuss in your own words the errors that can be made in
hypothesis testing.
a. What is a type I error? Why might it occur?
b. What is a type II error? How does it happen?
9.3 The term error is used in two different ways in the context
of a hypothesis test.
First, there is the concept of standard error (i.e. average
sampling error), and
second, there is the concept of a Type I error.
a. What factor can a researcher control that will reduce the risk
of a Type I
error?
b. What factor can a researcher control that will reduce the
standard error?
PSYC 2317 Mark W. Tengler, M.S.
Assignment #10
The z-test
10.1 Assume that a treatment does have an effect and that the
treatment effect is being
evaluated with a z hypothesis test. If all factors are held
constant, how is the
outcome of the hypothesis test influenced by sample size? To
answer this
question, do the following two tests and compare the results.
For both tests, a
sample is selected from a normal population distribution with a
9. mean of μ = 60
and a standard deviation of σ = 10. After the treatment is
administered to the
individuals in the sample, the sample mean if found to be M =
65. In each case,
use a two-
a. For the first test, assume that the sample consists of n = 4
individuals.
b. For the second test, assume that the sample consists of n = 25
individuals.
c. Explain in your own words how the outcome of the
hypothesis test is
influenced by the sample size.
Note: Be sure and show a picture of the research design. Also
show all steps and
calculations you made for each test following the process
outlined in the z-test
formula sheet handout. What statistical decision do you make
in each case?
10.2 Researchers have often noted increases in violent crimes
when it is very hot. In
fact, Reifman, Larrick, and Fein (1991) noted that this
relationship even extends
to baseball. That is, there is a much greater chance of a batter
being hit by a pitch
when the temperature increases. Consider the following
hypothetical data.
Suppose that over the past 30 years, during any given week of
the major league
season, an average of μ = 12 players are hit by wild pitches.
Assume the
distribution is nearly normal with σ = 3. For a sample of n = 4
weeks in which the
10. daily temperature was extremely hot, the weekly average of hit-
by-pitch players
was M = 15.5. Are players more likely to get hit by pitches
during the hot weeks?
Set alpha to .05 for a one-tailed test.
1
Single Sample z-test
I. Assumptions for z-test
A. one sample, randomly selected
B. know population mean and population standard deviation
ahead of time
C. standard deviation is unchanged by treatment or experiment
D. sample means are normally distributed; take all the possible
sample means that
could happen by chance without treatment (usually normally
distributed for
behavioral sciences if sample is greater than or equal to 30)
II. Diagramming your research (show the whole logic and
process of hypothesis testing)
a. Draw a picture of your research design (see diagramming
your research
handout).
b. There are always two explanations (i.e. hypotheses) of your
11. research results, the
wording of which depends on whether the research question is
directional (one-
tailed) or non-directional (two-tailed). State them as logical
opposites.
c. For statistical testing, ignore the alternative hypothesis and
focus on the null
hypothesis, since the null hypothesis claims that the research
results happened
by chance through sampling error.
d. Assuming that the null is true (i.e. that the research results
occurred by chance
through sampling error) allows one to do a probability
calculation (i.e. all
statistical tests are nothing more than calculating the probability
of getting your
research results by chance through sampling error).
e. Observe that there are two outcomes which may occur from
the results of the
probability calculation (high or low probability of getting your
research results by
chance, depending on the alpha (α) level).
f. Each outcome will lead to a decision about the null
hypothesis, whether the null
is probably true (i.e. we then accept the null to be true) or
probably not true (i.e.
we then reject the null as false).
III. Hypotheses (i.e. the two explanations of your research
results)
12. A. Two-tailed (non-directional research question)
1. Alternative hypothesis (H1): The independent variable (i.e.
the treatment)
does make a difference in performance.
2. Null hypothesis (H0): The independent variable (i.e. the
treatment) does
not make a difference in performance.
B. One-tailed (directional research question)
1. Alternative hypothesis (H1): The treatment has an increased
(right tail) or
a decreased (left tail) effect on performance.
2. Null hypothesis (H0): The treatment has an opposite effect
than expected
or no change in performance.
2
IV. Determine critical regions (i.e. the z score boundary
between the high or low probability
of getting your research results by chance) using table A-23
A. Significance level (should be given or decided prior to the
research; also called
the confidence, alpha, or p level)
1. α or p = .05, .01, or .001
B. One- or two-tailed test (using table A-23)
13. 1. One-tailed: use full alpha level amount for proportion in tail
(Column C)
2. Two-tailed: use half alpha level amount for proportion in tail
(Column C)
C. With one- or two-tailed p values, find the critical z value
1. If two-tailed, then critical z value is ± z value
2. If one-tailed, then determine if critical z value is +z (right
tail) or -z (left
tail)
V. Calculate the z-test statistic
A. General Single Sample z-test statistical test formula
z = the observed sample mean – the hypothesized population
mean
standard error
B. Calculations
1. Compute standard error (average difference between sample
&
population means)
Note: (standard error is simply an estimate of the average
sampling error which may
occur by chance, since a sample can never give a totally
accurate picture of a population)
σM =
�
√�
or √
�2
14. �
2. Compute z-test statistic (i.e. calculates the probability of
getting your
research results by chance through sampling error)
Z =
�− µ
��
B. Compare the calculated z-score to the critical z-score &
make a decision about
the null hypothesis
1. Reject the null (as false) and accept the alternative or
2. Accept null (as true)
VI. Reporting the results of a single sample z test
“The treatment had a significant effect on scores (M = 25, SD =
4.22); z = +3.85, p < .05,
two-tailed.”
Assignment-10z-single