SlideShare une entreprise Scribd logo
1  sur  6
Dear students get fully solved assignments
Send your semester & Specialization name to our mail id :
help.mbaassignments@gmail.com
or
call us at : 08263069601
ASSIGNMENT
Note – Answer all questions. Kindly note that answers for 10 marks questions should be
approximately of 400 words. Each question is followed by evaluation scheme.
QUESTION1. Give the meaning of the word Statistics. Mention the
characteristics of Statistics.
Answer : Meaning of statistics:
The word statistics is used to give the following three meanings.
Firstly it is used in plural sense which refers to the collection of numerical data in aggregate
form relating to any field of stud e.g. statistics of births, statistics of prices, statistics of road
accidents etc.
Secondly it is used in singular sense which refers to the methods and procedures used in the
collection, analysis, interpretation of data and presently the data in various forms such as
tables, graphs, charts, diagrams
QUESTION2. a. What do you mean by Probability?
DRIVE SPRING 2017
PROGRAM MBA
SEMESTER I
SUBJECT CODE & NAME MBA 103- Statistics for Management
BK ID B1731
CERDIT 4
MARKS 60
Answer. 2a. Probability is a branch of mathematics that deals with calculating the likelihood of a
givenevent'soccurrence,whichisexpressedasanumberbetween1and0.Aneventwithaprobability
of 1 canbe consideredacertainty:forexample,theprobabilityof acointossresultingineither"heads"
or "tails" is 1, because there are
b.A bag contains 5 white, 6 red, 2 greenand 2 black balls. One ball is selected
at random from the bag. Find the probability that the selected ball is-
i. white
ii. non-white
iii. white or green
iv. black or red
Answer2b.
(i)Total No. of Balls = (5+
Probability of white ball = P(E) = n(E)/n(S) = 5/15 = 1/3
(ii)Total No. of Balls =
Probability of Non-white ball = P(E) = n(E)/n(S) = 10/15 = 2/3
(iii)Probability of white
Probability of white or green balls = 1/3 + 2/15 = 7/15
(iv)Total no. black
Probability of black or red balls = 2/15+6/15 = 8/15 .
QUESTION3. What Do you mean by Sampling? Describe various Probability
and Non- Probability Sampling Methods.
Answer3.
Sampling - In statistics, quality assurance,and survey methodology,sampling is concernedwith the
selection of a subset of individuals from withina statistical population to estimate characteristics of
the whole population. Each observation measures one or more properties (such as weight,location,
color) of observable bodies distinguished as
QUESTION4. Write short notes on
a. Type I and Type II error
Answer4a. When you do a hypothesis test,two types of errors are possible: type I and type II. The
risks of these two errors are inversely related and determined by the level of significance and the
powerfor the test.Therefore,youshoulddetermine whicherrorhas more severe consequencesfor
your situation before you
b. Level of Significance
Answer4b. In hypothesis testing, the significance level is the criterion used for rejecting the null
hypothesis.The significancelevel isusedinhypothesistestingasfollows:First,the difference between
the results of the experiment and the null hypothesis is determined. Then, assuming the null
hypothesis is true, the probability of a difference that large or larger is computed . Finally, this
probability is compared to the
c. Null Hypothesis
Answer4c. In inferential statistics, the term "null hypothesis" usually refers to a general statement
or defaultpositionthatthere isnorelationshipbetweentwomeasuredphenomena,or noassociation
among groups. Rejecting or disproving the null hypothesis—and thus concluding that there are
grounds for believing that there is a relationship between two phenomena (e.g. that a potential
treatment has a measurable effect)—is a central task in the modern practice of science, and gives a
precise criterion for rejecting a
d. Two–tailed Tests and One–tailed Tests
Answer4d. In statistical significance testing, a one-tailed test and a two-tailed test are alternative
waysof computingthe statistical significance of aparameterinferredfromadataset,intermsof a test
statistic. A two-tailed test is used if deviations of the estimated parameter in either direction from
some benchmark value are consideredtheoreticallypossible; in contrast, a one-tailed test is used if
only deviations in one direction are
e. Test Statistics
Answer4e. A test statistic is a standardized value that is calculated from sample data during a
hypothesis test. You can use test statistics to determine whether to reject the null hypothesis. The
teststatisticcomparesyourdata withwhat isexpectedunderthe null hypothesis.The teststatisticis
used to calculate the p-value.
QUESTION5. a. Explain The concept of One Way ANOVA
Answer5a. The one-wayANOVA comparesthe meansbetweenthe groupsyouare interestedinand
determines whether any of those means are statistically significantly different from each other.
Specifically, it tests the null hypothesis:
One-way ANOVA Null Hypothesis
b. Table givenbelow depicts the data on productionrate by five workmen on
four machines. Test whether the rate is significantly different due to workers
and machines
Answer5b.
Descriptives ( with 95 % Confidence Interval for Mean)
QUESTION6. a. Explain the meaning of Weighted Index Numbers.
Answer6a. Whenall commoditiesare notof equalimportance.We assignweighttoeachcommodity
relative to its importance and index number computed from these weightsis called weighted index
numbers.
b. Information of sales price per unit of different commodities for two
different years is given in following table-
Construct the Price Index taking 2010 as the base year and2016 as the current
year by following methods.
i. Laspeyre’s Price Index
ii. Paasche’s Method
iii. Dorbish and Bowley’s method
iv. Fisher’s Ideal Index Method
Answer6b.
The computation table is as follows for getting the required price indexes –
Commodities Price Quantity 𝑃1 𝑄0 𝑃0 𝑄0 𝑃1 𝑄1 𝑃0 𝑄1
Dear students get fully solved assignments
Send your semester & Specialization name to our mail id :
help.mbaassignments@gmail.com
or
call us at : 08263069601

Contenu connexe

Tendances

12 ch ken black solution
12 ch ken black solution12 ch ken black solution
12 ch ken black solution
Krunal Shah
 
Statistical Methods
Statistical MethodsStatistical Methods
Statistical Methods
guest2137aa
 
Measures of central tendency
Measures of central tendencyMeasures of central tendency
Measures of central tendency
Chie Pegollo
 
Exam III Tian Xia
Exam III Tian XiaExam III Tian Xia
Exam III Tian Xia
TIAN XIA
 
11 ch ken black solution
11 ch ken black solution11 ch ken black solution
11 ch ken black solution
Krunal Shah
 

Tendances (18)

Elementary Statistics
Elementary Statistics Elementary Statistics
Elementary Statistics
 
Mb0040 statistics for management
Mb0040 statistics for managementMb0040 statistics for management
Mb0040 statistics for management
 
Statistics is the science of collection
Statistics is the science of collectionStatistics is the science of collection
Statistics is the science of collection
 
12 ch ken black solution
12 ch ken black solution12 ch ken black solution
12 ch ken black solution
 
Lesson 1 07 measures of variation
Lesson 1 07 measures of variationLesson 1 07 measures of variation
Lesson 1 07 measures of variation
 
PREDICTING CLASS-IMBALANCED BUSINESS RISK USING RESAMPLING, REGULARIZATION, A...
PREDICTING CLASS-IMBALANCED BUSINESS RISK USING RESAMPLING, REGULARIZATION, A...PREDICTING CLASS-IMBALANCED BUSINESS RISK USING RESAMPLING, REGULARIZATION, A...
PREDICTING CLASS-IMBALANCED BUSINESS RISK USING RESAMPLING, REGULARIZATION, A...
 
Statistical Methods
Statistical MethodsStatistical Methods
Statistical Methods
 
Measures of central tendency
Measures of central tendencyMeasures of central tendency
Measures of central tendency
 
Lesson 1 05 measuring central tendency
Lesson 1 05 measuring central tendencyLesson 1 05 measuring central tendency
Lesson 1 05 measuring central tendency
 
Descriptive statistics
Descriptive statisticsDescriptive statistics
Descriptive statistics
 
Statistics Class 10 CBSE
Statistics Class 10 CBSE Statistics Class 10 CBSE
Statistics Class 10 CBSE
 
Exam III Tian Xia
Exam III Tian XiaExam III Tian Xia
Exam III Tian Xia
 
Measures of central tendency
Measures of central tendencyMeasures of central tendency
Measures of central tendency
 
Areas In Statistics
Areas In StatisticsAreas In Statistics
Areas In Statistics
 
Graphs that Enlighten and Graphs that Deceive
Graphs that Enlighten and Graphs that DeceiveGraphs that Enlighten and Graphs that Deceive
Graphs that Enlighten and Graphs that Deceive
 
Ppt for 1.1 introduction to statistical inference
Ppt for 1.1 introduction to statistical inferencePpt for 1.1 introduction to statistical inference
Ppt for 1.1 introduction to statistical inference
 
11 ch ken black solution
11 ch ken black solution11 ch ken black solution
11 ch ken black solution
 
Probability distribution of a random variable module
Probability distribution of a random variable moduleProbability distribution of a random variable module
Probability distribution of a random variable module
 

Similaire à Mba103 statistics for management

Mb0050 research methodology
Mb0050   research methodologyMb0050   research methodology
Mb0050 research methodology
smumbahelp
 
Mb0040 statistics for management
Mb0040   statistics for managementMb0040   statistics for management
Mb0040 statistics for management
smumbahelp
 
Mb0050 research methodology
Mb0050   research methodologyMb0050   research methodology
Mb0050 research methodology
smumbahelp
 
Mb0050 research methodology
Mb0050   research methodologyMb0050   research methodology
Mb0050 research methodology
smumbahelp
 
InstructionDue Date 6 pm on October 28 (Wed)Part IProbability a.docx
InstructionDue Date 6 pm on October 28 (Wed)Part IProbability a.docxInstructionDue Date 6 pm on October 28 (Wed)Part IProbability a.docx
InstructionDue Date 6 pm on October 28 (Wed)Part IProbability a.docx
dirkrplav
 
Statistics for management
Statistics for managementStatistics for management
Statistics for management
John Prarthan
 
Directions The purpose of Project 8 is to prepare you for the final.docx
Directions The purpose of Project 8 is to prepare you for the final.docxDirections The purpose of Project 8 is to prepare you for the final.docx
Directions The purpose of Project 8 is to prepare you for the final.docx
eve2xjazwa
 
Maths A - Chapter 10
Maths A - Chapter 10Maths A - Chapter 10
Maths A - Chapter 10
westy67968
 
Running head COURSE PROJECT –PHASE 3 COURSE PROJECT –PHASE 3.docx
Running head COURSE PROJECT –PHASE 3 COURSE PROJECT –PHASE 3.docxRunning head COURSE PROJECT –PHASE 3 COURSE PROJECT –PHASE 3.docx
Running head COURSE PROJECT –PHASE 3 COURSE PROJECT –PHASE 3.docx
susanschei
 
Statistics for management
Statistics for managementStatistics for management
Statistics for management
Vinay Aradhya
 
Histograms and Descriptive Statistics Scoring GuideCRITERIANON.docx
Histograms and Descriptive Statistics Scoring GuideCRITERIANON.docxHistograms and Descriptive Statistics Scoring GuideCRITERIANON.docx
Histograms and Descriptive Statistics Scoring GuideCRITERIANON.docx
pooleavelina
 

Similaire à Mba103 statistics for management (20)

Math 300 MM Project
Math 300 MM ProjectMath 300 MM Project
Math 300 MM Project
 
Mb0050 research methodology
Mb0050   research methodologyMb0050   research methodology
Mb0050 research methodology
 
Mb0040 statistics for management
Mb0040   statistics for managementMb0040   statistics for management
Mb0040 statistics for management
 
Statistics for management assignment
Statistics for management assignmentStatistics for management assignment
Statistics for management assignment
 
Mb0050 research methodology
Mb0050   research methodologyMb0050   research methodology
Mb0050 research methodology
 
Mb0050 research methodology
Mb0050   research methodologyMb0050   research methodology
Mb0050 research methodology
 
Advanced Statistics.pptx
Advanced Statistics.pptxAdvanced Statistics.pptx
Advanced Statistics.pptx
 
Practice Test 1
Practice Test 1Practice Test 1
Practice Test 1
 
Introduction-to-Statistics.pptx
Introduction-to-Statistics.pptxIntroduction-to-Statistics.pptx
Introduction-to-Statistics.pptx
 
InstructionDue Date 6 pm on October 28 (Wed)Part IProbability a.docx
InstructionDue Date 6 pm on October 28 (Wed)Part IProbability a.docxInstructionDue Date 6 pm on October 28 (Wed)Part IProbability a.docx
InstructionDue Date 6 pm on October 28 (Wed)Part IProbability a.docx
 
Statistics for management
Statistics for managementStatistics for management
Statistics for management
 
SPSS statistics - get help using SPSS
SPSS statistics - get help using SPSSSPSS statistics - get help using SPSS
SPSS statistics - get help using SPSS
 
Directions The purpose of Project 8 is to prepare you for the final.docx
Directions The purpose of Project 8 is to prepare you for the final.docxDirections The purpose of Project 8 is to prepare you for the final.docx
Directions The purpose of Project 8 is to prepare you for the final.docx
 
Maths A - Chapter 10
Maths A - Chapter 10Maths A - Chapter 10
Maths A - Chapter 10
 
Analyzing experimental research data
Analyzing experimental research dataAnalyzing experimental research data
Analyzing experimental research data
 
Statistics final seminar
Statistics final seminarStatistics final seminar
Statistics final seminar
 
Running head COURSE PROJECT –PHASE 3 COURSE PROJECT –PHASE 3.docx
Running head COURSE PROJECT –PHASE 3 COURSE PROJECT –PHASE 3.docxRunning head COURSE PROJECT –PHASE 3 COURSE PROJECT –PHASE 3.docx
Running head COURSE PROJECT –PHASE 3 COURSE PROJECT –PHASE 3.docx
 
Statistics for management
Statistics for managementStatistics for management
Statistics for management
 
Histograms and Descriptive Statistics Scoring GuideCRITERIANON.docx
Histograms and Descriptive Statistics Scoring GuideCRITERIANON.docxHistograms and Descriptive Statistics Scoring GuideCRITERIANON.docx
Histograms and Descriptive Statistics Scoring GuideCRITERIANON.docx
 
DATA COLLECTION IN RESEARCH
DATA COLLECTION IN RESEARCHDATA COLLECTION IN RESEARCH
DATA COLLECTION IN RESEARCH
 

Dernier

Beyond the EU: DORA and NIS 2 Directive's Global Impact
Beyond the EU: DORA and NIS 2 Directive's Global ImpactBeyond the EU: DORA and NIS 2 Directive's Global Impact
Beyond the EU: DORA and NIS 2 Directive's Global Impact
PECB
 
1029-Danh muc Sach Giao Khoa khoi 6.pdf
1029-Danh muc Sach Giao Khoa khoi  6.pdf1029-Danh muc Sach Giao Khoa khoi  6.pdf
1029-Danh muc Sach Giao Khoa khoi 6.pdf
QucHHunhnh
 
Gardella_PRCampaignConclusion Pitch Letter
Gardella_PRCampaignConclusion Pitch LetterGardella_PRCampaignConclusion Pitch Letter
Gardella_PRCampaignConclusion Pitch Letter
MateoGardella
 
1029 - Danh muc Sach Giao Khoa 10 . pdf
1029 -  Danh muc Sach Giao Khoa 10 . pdf1029 -  Danh muc Sach Giao Khoa 10 . pdf
1029 - Danh muc Sach Giao Khoa 10 . pdf
QucHHunhnh
 
Seal of Good Local Governance (SGLG) 2024Final.pptx
Seal of Good Local Governance (SGLG) 2024Final.pptxSeal of Good Local Governance (SGLG) 2024Final.pptx
Seal of Good Local Governance (SGLG) 2024Final.pptx
negromaestrong
 
Activity 01 - Artificial Culture (1).pdf
Activity 01 - Artificial Culture (1).pdfActivity 01 - Artificial Culture (1).pdf
Activity 01 - Artificial Culture (1).pdf
ciinovamais
 
Gardella_Mateo_IntellectualProperty.pdf.
Gardella_Mateo_IntellectualProperty.pdf.Gardella_Mateo_IntellectualProperty.pdf.
Gardella_Mateo_IntellectualProperty.pdf.
MateoGardella
 

Dernier (20)

Sports & Fitness Value Added Course FY..
Sports & Fitness Value Added Course FY..Sports & Fitness Value Added Course FY..
Sports & Fitness Value Added Course FY..
 
Beyond the EU: DORA and NIS 2 Directive's Global Impact
Beyond the EU: DORA and NIS 2 Directive's Global ImpactBeyond the EU: DORA and NIS 2 Directive's Global Impact
Beyond the EU: DORA and NIS 2 Directive's Global Impact
 
SECOND SEMESTER TOPIC COVERAGE SY 2023-2024 Trends, Networks, and Critical Th...
SECOND SEMESTER TOPIC COVERAGE SY 2023-2024 Trends, Networks, and Critical Th...SECOND SEMESTER TOPIC COVERAGE SY 2023-2024 Trends, Networks, and Critical Th...
SECOND SEMESTER TOPIC COVERAGE SY 2023-2024 Trends, Networks, and Critical Th...
 
1029-Danh muc Sach Giao Khoa khoi 6.pdf
1029-Danh muc Sach Giao Khoa khoi  6.pdf1029-Danh muc Sach Giao Khoa khoi  6.pdf
1029-Danh muc Sach Giao Khoa khoi 6.pdf
 
Gardella_PRCampaignConclusion Pitch Letter
Gardella_PRCampaignConclusion Pitch LetterGardella_PRCampaignConclusion Pitch Letter
Gardella_PRCampaignConclusion Pitch Letter
 
Key note speaker Neum_Admir Softic_ENG.pdf
Key note speaker Neum_Admir Softic_ENG.pdfKey note speaker Neum_Admir Softic_ENG.pdf
Key note speaker Neum_Admir Softic_ENG.pdf
 
PROCESS RECORDING FORMAT.docx
PROCESS      RECORDING        FORMAT.docxPROCESS      RECORDING        FORMAT.docx
PROCESS RECORDING FORMAT.docx
 
Paris 2024 Olympic Geographies - an activity
Paris 2024 Olympic Geographies - an activityParis 2024 Olympic Geographies - an activity
Paris 2024 Olympic Geographies - an activity
 
1029 - Danh muc Sach Giao Khoa 10 . pdf
1029 -  Danh muc Sach Giao Khoa 10 . pdf1029 -  Danh muc Sach Giao Khoa 10 . pdf
1029 - Danh muc Sach Giao Khoa 10 . pdf
 
Unit-V; Pricing (Pharma Marketing Management).pptx
Unit-V; Pricing (Pharma Marketing Management).pptxUnit-V; Pricing (Pharma Marketing Management).pptx
Unit-V; Pricing (Pharma Marketing Management).pptx
 
Ecological Succession. ( ECOSYSTEM, B. Pharmacy, 1st Year, Sem-II, Environmen...
Ecological Succession. ( ECOSYSTEM, B. Pharmacy, 1st Year, Sem-II, Environmen...Ecological Succession. ( ECOSYSTEM, B. Pharmacy, 1st Year, Sem-II, Environmen...
Ecological Succession. ( ECOSYSTEM, B. Pharmacy, 1st Year, Sem-II, Environmen...
 
Seal of Good Local Governance (SGLG) 2024Final.pptx
Seal of Good Local Governance (SGLG) 2024Final.pptxSeal of Good Local Governance (SGLG) 2024Final.pptx
Seal of Good Local Governance (SGLG) 2024Final.pptx
 
Advance Mobile Application Development class 07
Advance Mobile Application Development class 07Advance Mobile Application Development class 07
Advance Mobile Application Development class 07
 
SOCIAL AND HISTORICAL CONTEXT - LFTVD.pptx
SOCIAL AND HISTORICAL CONTEXT - LFTVD.pptxSOCIAL AND HISTORICAL CONTEXT - LFTVD.pptx
SOCIAL AND HISTORICAL CONTEXT - LFTVD.pptx
 
Advanced Views - Calendar View in Odoo 17
Advanced Views - Calendar View in Odoo 17Advanced Views - Calendar View in Odoo 17
Advanced Views - Calendar View in Odoo 17
 
Activity 01 - Artificial Culture (1).pdf
Activity 01 - Artificial Culture (1).pdfActivity 01 - Artificial Culture (1).pdf
Activity 01 - Artificial Culture (1).pdf
 
Gardella_Mateo_IntellectualProperty.pdf.
Gardella_Mateo_IntellectualProperty.pdf.Gardella_Mateo_IntellectualProperty.pdf.
Gardella_Mateo_IntellectualProperty.pdf.
 
Holdier Curriculum Vitae (April 2024).pdf
Holdier Curriculum Vitae (April 2024).pdfHoldier Curriculum Vitae (April 2024).pdf
Holdier Curriculum Vitae (April 2024).pdf
 
Mixin Classes in Odoo 17 How to Extend Models Using Mixin Classes
Mixin Classes in Odoo 17  How to Extend Models Using Mixin ClassesMixin Classes in Odoo 17  How to Extend Models Using Mixin Classes
Mixin Classes in Odoo 17 How to Extend Models Using Mixin Classes
 
Código Creativo y Arte de Software | Unidad 1
Código Creativo y Arte de Software | Unidad 1Código Creativo y Arte de Software | Unidad 1
Código Creativo y Arte de Software | Unidad 1
 

Mba103 statistics for management

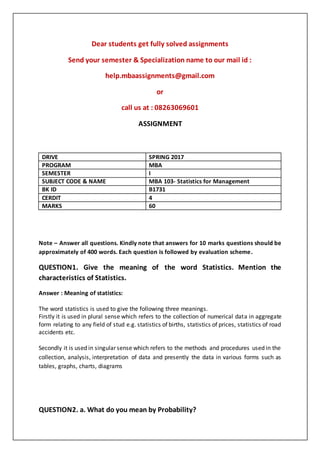
  • 1. Dear students get fully solved assignments Send your semester & Specialization name to our mail id : help.mbaassignments@gmail.com or call us at : 08263069601 ASSIGNMENT Note – Answer all questions. Kindly note that answers for 10 marks questions should be approximately of 400 words. Each question is followed by evaluation scheme. QUESTION1. Give the meaning of the word Statistics. Mention the characteristics of Statistics. Answer : Meaning of statistics: The word statistics is used to give the following three meanings. Firstly it is used in plural sense which refers to the collection of numerical data in aggregate form relating to any field of stud e.g. statistics of births, statistics of prices, statistics of road accidents etc. Secondly it is used in singular sense which refers to the methods and procedures used in the collection, analysis, interpretation of data and presently the data in various forms such as tables, graphs, charts, diagrams QUESTION2. a. What do you mean by Probability? DRIVE SPRING 2017 PROGRAM MBA SEMESTER I SUBJECT CODE & NAME MBA 103- Statistics for Management BK ID B1731 CERDIT 4 MARKS 60
  • 2. Answer. 2a. Probability is a branch of mathematics that deals with calculating the likelihood of a givenevent'soccurrence,whichisexpressedasanumberbetween1and0.Aneventwithaprobability of 1 canbe consideredacertainty:forexample,theprobabilityof acointossresultingineither"heads" or "tails" is 1, because there are b.A bag contains 5 white, 6 red, 2 greenand 2 black balls. One ball is selected at random from the bag. Find the probability that the selected ball is- i. white ii. non-white iii. white or green iv. black or red Answer2b. (i)Total No. of Balls = (5+ Probability of white ball = P(E) = n(E)/n(S) = 5/15 = 1/3 (ii)Total No. of Balls = Probability of Non-white ball = P(E) = n(E)/n(S) = 10/15 = 2/3 (iii)Probability of white Probability of white or green balls = 1/3 + 2/15 = 7/15 (iv)Total no. black Probability of black or red balls = 2/15+6/15 = 8/15 . QUESTION3. What Do you mean by Sampling? Describe various Probability and Non- Probability Sampling Methods.
  • 3. Answer3. Sampling - In statistics, quality assurance,and survey methodology,sampling is concernedwith the selection of a subset of individuals from withina statistical population to estimate characteristics of the whole population. Each observation measures one or more properties (such as weight,location, color) of observable bodies distinguished as QUESTION4. Write short notes on a. Type I and Type II error Answer4a. When you do a hypothesis test,two types of errors are possible: type I and type II. The risks of these two errors are inversely related and determined by the level of significance and the powerfor the test.Therefore,youshoulddetermine whicherrorhas more severe consequencesfor your situation before you b. Level of Significance Answer4b. In hypothesis testing, the significance level is the criterion used for rejecting the null hypothesis.The significancelevel isusedinhypothesistestingasfollows:First,the difference between the results of the experiment and the null hypothesis is determined. Then, assuming the null hypothesis is true, the probability of a difference that large or larger is computed . Finally, this probability is compared to the c. Null Hypothesis Answer4c. In inferential statistics, the term "null hypothesis" usually refers to a general statement or defaultpositionthatthere isnorelationshipbetweentwomeasuredphenomena,or noassociation among groups. Rejecting or disproving the null hypothesis—and thus concluding that there are grounds for believing that there is a relationship between two phenomena (e.g. that a potential treatment has a measurable effect)—is a central task in the modern practice of science, and gives a precise criterion for rejecting a d. Two–tailed Tests and One–tailed Tests
  • 4. Answer4d. In statistical significance testing, a one-tailed test and a two-tailed test are alternative waysof computingthe statistical significance of aparameterinferredfromadataset,intermsof a test statistic. A two-tailed test is used if deviations of the estimated parameter in either direction from some benchmark value are consideredtheoreticallypossible; in contrast, a one-tailed test is used if only deviations in one direction are e. Test Statistics Answer4e. A test statistic is a standardized value that is calculated from sample data during a hypothesis test. You can use test statistics to determine whether to reject the null hypothesis. The teststatisticcomparesyourdata withwhat isexpectedunderthe null hypothesis.The teststatisticis used to calculate the p-value. QUESTION5. a. Explain The concept of One Way ANOVA Answer5a. The one-wayANOVA comparesthe meansbetweenthe groupsyouare interestedinand determines whether any of those means are statistically significantly different from each other. Specifically, it tests the null hypothesis: One-way ANOVA Null Hypothesis b. Table givenbelow depicts the data on productionrate by five workmen on four machines. Test whether the rate is significantly different due to workers and machines Answer5b. Descriptives ( with 95 % Confidence Interval for Mean)
  • 5. QUESTION6. a. Explain the meaning of Weighted Index Numbers. Answer6a. Whenall commoditiesare notof equalimportance.We assignweighttoeachcommodity relative to its importance and index number computed from these weightsis called weighted index numbers. b. Information of sales price per unit of different commodities for two different years is given in following table- Construct the Price Index taking 2010 as the base year and2016 as the current year by following methods. i. Laspeyre’s Price Index ii. Paasche’s Method iii. Dorbish and Bowley’s method iv. Fisher’s Ideal Index Method Answer6b. The computation table is as follows for getting the required price indexes – Commodities Price Quantity 𝑃1 𝑄0 𝑃0 𝑄0 𝑃1 𝑄1 𝑃0 𝑄1
  • 6. Dear students get fully solved assignments Send your semester & Specialization name to our mail id : help.mbaassignments@gmail.com or call us at : 08263069601