
Recommandé
Recommandé
Contenu connexe
Similaire à lecture_01.ppt
Similaire à lecture_01.ppt (20)
Dernier
Dernier (20)
lecture_01.ppt
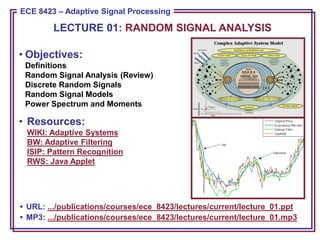
- 1. ECE 8443 – Pattern Recognition ECE 8423 – Adaptive Signal Processing • Objectives: Definitions Random Signal Analysis (Review) Discrete Random Signals Random Signal Models Power Spectrum and Moments • Resources: WIKI: Adaptive Systems BW: Adaptive Filtering ISIP: Pattern Recognition RWS: Java Applet • URL: .../publications/courses/ece_8423/lectures/current/lecture_01.ppt • MP3: .../publications/courses/ece_8423/lectures/current/lecture_01.mp3 LECTURE 01: RANDOM SIGNAL ANALYSIS
- 2. ECE 8423: Lecture 01, Slide 1 • Optimal Signal Processing: the design, analysis, and implementation of processing systems that extract information from sampled data in a manner that is “best” or optimal in some sense. • In a statistical sense, this means we maximize some criterion function, normally a posterior probability, by adjusting the parameters of the model(s). • Popular methods include Minimum Mean-Squared Error (MMSE), Maximum Likelihood (ML), Maximum A Posteriori (MAP) and Bayesian methods. • Adaptive Signal Processing: Adjusting the parameters of a model as new data is encountered to maximize a criterion function. This is often done in conjunction with a pattern recognition system. Key constraints are: Supervised vs. Unsupervised: Is the new data truth-marked so that you know the answer that your system should produce for this new data? Online or Off-line: Do you adapt as the new data arrives, or do you accumulate a set of new data, and adapt based on this data and all previously encountered data? Fast vs. Slow: Does the adaptation occur over seconds or hours or days? How much can you rely on the new data? As you can see, there is significant overlap between this course and our Pattern Recognition course. Introduction
- 3. ECE 8423: Lecture 01, Slide 2 Adaptive Signal Processing Examples • Exploiting Information: Adaptive systems can exploit all forms of information at all levels of an ontology or hierarchy that describes the problem space. • Systems can adapt to low-level changes such as channel or noise, or higher-level changes in language, user, or application. • Speech Recognition: Most statistical modeling systems suffer from over training on known training data. • Adaptation is employed to allow systems to deliver high performance in previously unseen environments or for new speakers or microphones.
- 4. ECE 8423: Lecture 01, Slide 3 Discrete Random Signals • Discrete random signal: • Probability density function: • Cumulative density function: • Deterministic signal: a signal that is repeatable (e.g., a sinewave). • Random signal: the signal can only be characterized through statistics. Often we model signals as the sum of a deterministic component and a random component (e.g., noise). • Measures of random signals: Mean value: The expectation can also be computed as an ensemble average: The expectation operator is linear: The expectation of a function of a random variable is given by: ) ( ),..., 1 ( ), 0 ( n x x x )) ( ( n x fx ) ( )) ( ( )) ( ( n dx n x f n x F x x ) ( )) ( ( ) ( )} ( { n dx n x f n x n x E n N i i N n n x N 1 ) ( 1 lim )} ( { )} ( { )} ( ) ( { n y bE m x aE n bx m ax E dx x f x g x g y E ) ( ) ( )} ( {
- 5. ECE 8423: Lecture 01, Slide 4 Correlation, Covariance and Linear Systems • The correlation of a random signal, x(n), is defined by: • This can also be computed via an ensemble average: • The autocorrelation is defined as: • The covariance of a random signal is defined as: • The variance is defined as: • We can write the covariance and autocorrelation in matrix form, and derive a relationship between them: • We can generalize the covariance and autocorrelation to higher orders: ) ( ) ( )) ( ), ( ( ) ( ) ( )} ( ) ( { ) , ( n dx m dx n x m x f n x m x n x m x E n m R N i i i N n x m x N n m R 1 )} ( ) ( 1 { lim ) , ( ) ( ) ( )) ( ), ( ( ) ) ( )( ) ( ( )} ) ( )( ) ( {( ) , ( n dx m dx n x m x f n x m x n x m x E n m C n m n m } ) ) ( {( ) , ( 2 2 n n n x E n n C )} ( { ) , ( 2 n x E n n R t μμ R C ))} ( ) ( ) ( {( ) , , ( )} ) ( )( ) ( )( ) ( {( ) , , ( 3 2 1 3 2 1 ) 3 ( ) 3 ( l x l x l x E l l l R n x m x l x E n m l C n m l
- 6. ECE 8423: Lecture 01, Slide 5 Independence and Stationarity • Samples x(m) and x(n) are said to be statistically independent if: which implies: • If x(m) and x(n) are independent: and the random variables are said to be uncorrelated. • Samples x(m) and x(n) are said to be orthogonal if: • A discrete random variable is said to be strictly stationary or strongly stationary if its k-th order distribution function, F(x(n1)x(n2),…,x(nk)), is shift invariant for any set of n1, n2, …, nk. • For weak stationarity, we require that the mean value be independent of location: • In this case, we can write the correlation (and covariance) in terms of lags: • The autocorrelation is an even sequence: • The mean-square value obeys: • The autocorrelation matrix is Toeplitz and positive semi-definite: )) ( ( )) ( ( )) ( ) ( ( n x f m x f n x m x f )} ( { )} ( { )} ( ) ( { n x E m x E n x m x E 0 ) , ( n m C 0 )} ( ) ( { n x m x E )} ( { )} ( { n x E m x E )} ( ) ( { ) ( i n x n x E i r ) ( ) ( i r i r ) ( ) 0 ( )} ( { 2 i r r n x E a Ra a vector any for 0 t
- 7. ECE 8423: Lecture 01, Slide 6 Some Important Random Signals • White noise is a zero-mean, stationary discrete random variable which satisfies: • First order Markov signals: • Gaussian Random Signals: • Complex Random Signals: ) ( ) ( ))... 1 ( ( )) 0 ( ( ),...) 1 ( ), 0 ( ( 2 m n m n r x f x f x x f w ) ( ) ( 2 1 2 / 1 2 / 1 1 0 1 ) 2 ( 1 ) ( )) ( ),..., ( ), ( ( μ x C μ x x t e f n x n x n x f L L )) 1 ( | ) ( ( )) 0 ( ),..., 2 ( ), 1 ( | ) ( ( n x n x f x n x n x n x f ) ( ) ( ) ( n jx n x n x I R
- 8. ECE 8423: Lecture 01, Slide 7 Spectral Representations of Discrete Random Signals • We can convert the autocorrelation function to a frequency domain representation using the z-transform: • We can obtain the power spectrum using : • For white noise: • For two random variables, we can define the cross-correlation and the cross-spectrum: • We can show: i i z i r z R ) ( ) ( j e z i i j j e i r e R ) ( ) ( 2 2 ) ( ) ( ) ( ) ( w i i j w i i j j e i i r e i r e R i i j xy j xy xy e i r e R i n y n x E i r ) ( ) ( )} ( ) ( { ) ( j yx j xy e R e R * ) (
- 9. ECE 8423: Lecture 01, Slide 8 Response of Linear Systems to Random Signals • Consider a zero-mean, stationary sequence, x(n), as the input to a linear shift- invariant system with an impulse response h(n): • Note that the expected value of the output is zero: • We can use the z-transform to write an expression for the output: • We can show that the output power spectrum is related to the input power spectrum by the important relation: • We can also express this in the time domain: k k x k n h n x n h n y ) ( ) ( ) ( ) ( ) ( k k k x E k n h k x k n h E n x n h E n y E 0 )} ( { ) ( )} ( ) ( { )} ( ) ( { )} ( { ) ( ) ( ) ( z X z H z Y ) ( ) ( ) ( 2 j xx j j yy e R e H e R k xx xy k m r k h m r ) ( ) ( ) (
- 10. ECE 8423: Lecture 01, Slide 9 Random Signal Models • Wold’s Theorem: An stationary sequence, x(n), which has no deterministic components can be represented as the output of a stable, causal, shift- invariant linear filter, h(n), with a white noise input, w(n): • The z-transform of the linear time-invariant system can be represented as a rational of polynomials: • Specials cases are autoregressive (AR) models (all poles), moving average (MA) models (all zeroes), and autoregressive moving average (ARMA) models (poles and zeros). • The discrete-time output can be written as a linear, constant coefficient difference equation: • Stability is determined by the location of poles with respect to the unit circle. • Minimum phase is determined by the location of the zeroes in the z-plane. 0 ) ( ) ( ) ( ) ( ) ( i i n w i h n w n h n x M z M z z N z N z z a a a b b b z H ... 1 ... 1 ) ( 2 2 1 1 2 2 1 1 ) ( ... ) 1 ( ) ( ) ( ... ) 2 ( ) 1 ( ) ( 1 0 2 1 M n x b n x b n x b N n y a n y a n y a n y M N
- 11. ECE 8423: Lecture 01, Slide 10 Estimation of Moments • In Pattern Recognition, we deal with the estimation of parameters in a rigorous manner and derive properties of well-known estimators such as means and variances. • The error in an estimation procedure can be written as: where represents the true value of the parameter (often unknown). If , the estimator is said to be unbiased. • If , the estimator is said to be asymptotically unbiased. • The efficiency of two estimators can be defined in terms of the variance: • A measure which embraces both the bias and the variance is the mean-squared error: • An estimator is said to be consistent if: • If contains all the information about , is said to be a sufficient statistic. See Pattern Recognition for more information on this. %] 100 } ˆ { } ˆ { [ 2 1 x Var Var Re } ˆ { E 0 }} ˆ { { lim E N } ˆ { } ˆ { ) ˆ ( E E B } ) ˆ {( ) ˆ ( 2 E mse 0 )} ˆ ( { lim mse N )) ( ( ˆ n x T ˆ
- 12. ECE 8423: Lecture 01, Slide 11 • The estimation of a time average from an ensemble average: is an unbiased estimator: • x(n) is ergodic in the mean if the estimator is consistent: • An unbiased estimator of the autocorrelation is: because . An alternative estimator that is asymptotically unbiased is: • The latter is more useful for large values of m and small values of M. • Later in this course we will explore many powerful ways to estimate parameters of a model with limited amounts of data. In general, adaptive signal processing involves trading the complexity of your model (e.g., the number of parameters) and the amount of data needed for adaptation. Estimation Using Time Averages 1 0 ) ( 1 ˆ M n n x M 1 0 )} ( { 1 } ˆ { M n n x E M E 1 0 )} ( 1 { lim M n M n x M 1 0 ) ( ) ( 1 ) ( ˆ m M n m n x n x m M m r 1 0 ) ( ) ( 1 ) ( ˆ m M n m n x n x M m r ) ( )} ( ˆ { m r m r E
- 13. ECE 8423: Lecture 01, Slide 12 • Adaptive signal processing involves adjusting the parameters of a model to better fit the current operating environment using a small number of data samples from the new environment. • We will employ well-known techniques from digital signal processing and statistics to develop parameter estimation techniques and derive properties of these estimators. • In this lecture, we quickly reviewed key topics from random signals and systems and digital signal processing. • We discussed how to analyze and model linear time-invariant discrete-time systems. • We also discussed the properties of some basic methods of estimating moments (e.g., ensemble averages). Summary
Notes de l'éditeur
- MS Equation 3.0 was used with settings of: 18, 12, 8, 18, 12.