SlideShare une entreprise Scribd logo
1  sur  14
Télécharger pour lire hors ligne
1
Lesson 14 Statistical Process Control Solutions
Solved Problem #2: see textbook
Solved Problem #4: see textbook
Solved Problem #5: see textbook
Solved Problem #6: see textbook (manual problem)
#1: Checkout time at a supermarket is monitored using a range and mean chart. Six samples which contain
20 observations per sample have been collected and the sample means and sample ranges have been
computed as shown below.
Sample Mean Range
1 3.06 0.42
2 3.15 0.50
3 3.11 0.41
4 3.13 0.46
5 3.06 0.46
6 3.09 0.45
Perform the manual calculations necessary to answer the following questions.
a. What is the sample size?
20
b. Is the variability of the checkout time known or unknown?
Unknown
c. Which chart is used to analyze the checkout time variability?
Range chart
d. Which chart is used to analyze the checkout time?
Mean chart
e. Should the range or mean chart be analyzed first? Explain your answer.
Range chart should be analyzed before the mean chart because the variability of the process
must be in control before the mean chart can be analyzed.
Analyze the range chart by answering the following questions.
f. What is the grand range?
.45
g. Calculate the centerline, upper and lower control limits for the range chart?
2
71325.585.1*45.*
18675.415.*45.*
45.
4
3
===
===
===
DRUCL
DRLCL
RrangegrandCenterline
h. Plot the range chart showing the centerline, upper and lower control limits.
Centerline
LCL
UCL
Sample Range
0
0.1
0.2
0.3
0.4
0.5
0.6
0.7
0.8
0 1 2 3 4 5 6 7
i. Are the sample ranges within the control limits?
Yes
j. Count the number of A/B and U/D runs for the range chart.
A/B B A B A A B 5 runs
U/D U D U D D 4 runs
k. What is the expected number of A/B runs?
41
2
6
1
2
#
)( / =+=+=
nsObservatio
rE BA
l. What is the variability of the expected number of A/B runs?
118.1
4
16
4
1#
)( / =
−
=
−
=
nsObservatio
r BAσ
m. What is the test statistic for the expected number of runs?
89.
118.1
45
)(
)(#
)(
/
/
/ =
−
=
−
=
BA
BA
BA
r
rEruns
rZ
σ
n. Based on 3-sigma control limits for the runs test, does the pattern analysis indicate the A/B runs
are random? Why?
3
Yes, because it is between -3 and 3.
o. What is the expected number of U/D runs?
67.3
3
16*2
3
1)(#2
)( / =
−
=
−
=
nsObservatio
rE DU
p. What is the variability of the expected number of A/B runs?
86.
90
296*16
90
29)(#16
)( / =
−
=
−
=
nsObservatio
r DUσ
q. What is the test statistic for the expected number of runs?
38.
86.
67.34
)(
)(#
)(
/
/
/ =
−
=
−
=
DU
DU
DU
r
rEruns
rZ
σ
r. Based on 3-sigma control limits for the runs test, does the pattern analysis indicate the U/D runs
are random? Why?
Yes, because it is between -3 and 3
s. Is the variability of the checkout times in control (i.e is the range chart in control)? Why?
Yes. The sample ranges are within the limits, the A/B runs are random, and the U/D runs
are random.
Analyze the mean chart by answering the following questions.
t. What is the grand mean?
3.10
u. Calculate the centerline, upper and lower control limits for the mean chart?
181.345.*18.45.
019.345.*18.10.3
10.3
2
2
=+=+=
=−=−=
===
RAXUCL
RAXLCL
XaveragegrandCenterline
v. Plot the mean chart showing the centerline, upper and lower control limits.
4
Centerline
LCL
UCL
Sample Mean
3
3.02
3.04
3.06
3.08
3.1
3.12
3.14
3.16
3.18
3.2
0 1 2 3 4 5 6 7
w. Are the sample means within the control limits?
Yes
x. Count the number of A/B and U/D runs for the mean chart.
A/B B A A A B B 3 runs
U/D U D U D U 5 runs
y. What is the expected number of A/B runs?
41
2
#
)( / =+=
nsObservatio
rE BA
z. What is the variability of the expected number of A/B runs?
118.1
4
1#
)( / =
−
=
nsObservatio
r BAσ
aa. What is the test statistic for the expected number of runs?
89.
118.1
43
)(
)(#
)(
/
/
/ −=
−
=
−
=
BA
BA
BA
r
rEruns
rZ
σ
bb. Based on 3-sigma control limits for the runs test, does the pattern analysis indicate the A/B runs
are random? Why?
Yes, because it is between -3 and 3.
cc. What is the expected number of U/D runs?
67.3
3
1)(#2
)( / =
−
=
nsObservatio
rE DU
dd. What is the variability of the expected number of A/B runs?
5
86.
90
296*16
90
29)(#16
)( / =
−
=
−
=
nsObservatio
r DUσ
ee. What is the test statistic for the expected number of runs?
55.1
86.
67.35
)(
)(#
)(
/
/
/ =
−
=
−
=
DU
DU
DU
r
rEruns
rZ
σ
ff. Based on 3-sigma control limits for the runs test, does the pattern analysis indicate the U/D runs
are random? Why?
Yes, because it is between -3 and 3
gg. Are the average checkout times in control (i.e. is the mean chart in control)? Why?
Yes. The sample means are within the limits and the A/B runs are random, and the U/D
runs are random.
Based on your analysis is the checkout process in control? Why?
Yes, both the range and mean charts indicate the process is in control.
#2: The Bayfield Mud Company supplies railroad boxcars of 50 pound bags of mud treating agents to the
Wet-Land Drilling Company. Mud treating agents are used to control the pH and other chemical properties
of the cone during oil drilling operations. Wet-Land has complained to Bayfield that it’s most recent
shipment of bags was underweight by 5%. This is a problem which Wet-Land needs corrected because the
use of under weight bags may result in poor chemical control during drilling which may hurt drilling
efficiency resulting in serious economic consequences.
Afraid of losing a long time customer, Bayfield immediately began investigating their production process.
Management suspected that the causes of the problem were their recently added third shift and the fact that
all three of the shifts were under pressure to increase output to meet increasing demand for the product.
Their quality control staff began taking random samples of the output of 3 bags per hour. They observed
the process for 36 hours beginning at 6am.
To avoid manually entering the data into the templates it can be copied and pasted from Data Sets on the
Lesson Page. Use “copy, paste special, values” to transfer the data to the appropriate SPC template
worksheet..
6
Sample Time Bag 1 Bag 2 Bag 3
1 6am 49.60 48.70 50.70
2 7am 50.20 49.10 51.20
3 8am 50.60 49.60 51.40
4 9am 50.80 50.20 51.80
5 10am 49.90 49.20 52.30
6 11am 50.30 48.60 51.70
7 12noon 48.60 46.20 50.40
8 1pm 49.00 46.40 50.00
9 2pm 49.00 46.00 50.60
10 3pm 49.80 48.20 50.80
11 4pm 50.30 49.20 52.70
12 5pm 51.40 50.00 55.30
13 6pm 51.60 49.20 54.70
14 7pm 51.80 50.00 55.60
15 8pm 51.00 48.60 53.20
16 9pm 50.50 49.40 52.40
17 10pm 49.20 46.10 50.70
18 11pm 49.00 46.30 50.80
19 12pm 48.40 45.40 50.20
20 1am 47.60 44.30 49.70
21 2am 47.40 44.10 49.60
22 3am 48.20 45.20 49.00
23 4am 48.00 45.50 49.10
24 5am 48.40 47.10 49.60
25 6am 48.60 47.40 52.00
26 7am 50.00 49.20 52.20
27 8am 49.80 49.00 52.40
28 9am 50.30 49.40 51.70
29 10am 50.20 49.60 51.80
30 11am 50.00 49.00 52.30
31 12noon 50.00 48.80 52.40
32 1pm 50.10 49.40 53.60
33 2pm 49.70 48.60 51.00
34 3pm 48.40 47.20 51.70
35 4pm 47.20 45.30 50.90
36 5pm 46.80 44.10 49.00
Answer the following questions.
a. What is the sample size?
3
b. Is the variability of the checkout time known or unknown?
Unknown
c. Which chart is used to analyze the variability in the bag filling process?
7
Range chart
d. Which chart is used to analyze the amount of fill in each bag?
Mean chart
e. Should the range or mean chart be analyzed first? Explain your answer.
Range chart should be analyzed before the mean chart because the variability of the process
must be in control before the mean chart can be analyzed.
Analyze the range chart by answering the following questions.
f. What is the grand range?
3.7472
g. Calculate the centerline, upper and lower control limits for the range chart?
3σ Control Chart Settings
UCL 9.6454
Centerline 3.7472
LCL 0.0000
h. Plot the range chart showing the centerline, upper and lower control limits.
Control Chart
Centerline, 3.7472
LCL, 0.0000
UCL, 9.6454
0
2
4
6
8
10
12
0 10 20 30 40 50 60 70
Range
i. Are the sample ranges within the control limits?
Yes
8
j. Based on 3-sigma control limits for the runs test, does the pattern analysis indicate the A/B runs
are random?
Yes
k. Based on 3-sigma control limits for the runs test, does the pattern analysis indicate the U/D runs
are random?
Yes
l. Is the variability of the checkout times in control (i.e is the range chart in control)? Why?
Yes. The sample ranges are within the limits, the A/B runs are random, and the U/D runs
are random.
Analyze the mean chart by answering the following questions.
m. What is the grand mean?
49.5907
n. Calculate the centerline, upper and lower control limits for the mean chart?
3σ Control Chart Settings
UCL 53.4241
Centerline 49.5907
LCL 45.7573
o. Plot the mean chart showing the centerline, upper and lower control limits.
Control Chart
Centerline, 49.5907
LCL, 45.7573
UCL, 53.4241
45
46
47
48
49
50
51
52
53
54
0 10 20 30 40 50 60 70
Mean Unknown Variation
p. Are the sample means within the control limits?
9
Yes
q. Based on 3-sigma control limits for the runs test, does the pattern analysis indicate the A/B runs
are random?
No
r. Based on 3-sigma control limits for the runs test, does the pattern analysis indicate the U/D runs
are random?
No
s. Are the average checkout times in control (i.e. is the mean chart in control)? Why?
No. While the sample means are within the limits, the A/B runs are not random, and the
U/D runs are not random.
Based on your analysis is the bag filling process in control? Why? What should management do?
No, while the range chart indicates the variability of the bag process is in control, the mean
chart indicates the mean chart is not in control. Management should take immediate
corrective action and discuss with the people who work in the bag filling process to identify
potential causes for the problem. A TQM analysis such as the fishbone (Ishikawa) diagram
could be used to identify areas for improvement to get the process under control.
Based on the mean control chart, provide an explanation of what may be occurring.
It appears the pressure to increase production (fill more bags per hour) is creating the under
filled bags.
#3: Optical scanners are used in all supermarkets to speed the checkout process. Whenever the scanner
fails to read the bar code on the product, the cashier is required to manually punch the code into the
register.
Obviously, unreadable bar codes slow the checkout process. SPC is used to determine whether the scanner
is working properly. Once a day at the check out counter, a sample of 500 scans is taken and the number of
times the scanner is unable to read the bar code is determined. The sampling process is performed
automatically by the cash register.
To avoid manually entering the data into the templates it can be copied and pasted from Data Sets on the
Lesson Page. Use “copy, paste special, values” to transfer the data to the appropriate SPC template
worksheet..
10
Sample
Sample Size Incorrect
1 500 1
2 500 5
3 500 9
4 500 4
5 500 5
6 500 6
7 500 3
8 500 5
9 500 7
10 500 4
11 500 3
12 500 5
13 500 2
14 500 7
15 500 7
16 500 10
17 500 5
18 500 4
19 500 5
20 500 5
21 500 9
22 500 10
23 500 11
24 500 16
25 500 9
Answer the following questions.
a. What is the average sample size?
500
b. How many samples were taken?
25
c. Which chart should be used to determine whether the scanning process is in control? Explain your
answer.
Proportion (P) chart, because it is counted (attribute) data.
d. What is the estimate of the expected proportion of scans which are unable to read the bar code?
.0126
11
e. Calculate the centerline, upper and lower control limits for the P chart?
3σ Control Chart Settings
UCL 0.0275
Centerline 0.0126
LCL 0.0000
f. Plot the P chart showing the centerline, upper and lower control limits.
Control Chart
Centerline, 0.0126
LCL, 0.0000
UCL, 0.0275
0
0.005
0.01
0.015
0.02
0.025
0.03
0.035
0 10 20 30 40 50 60 70
Proportion
g. Are the sample proportions within the control limits?
No
h. Based on 3-sigma control limits for the runs test, does the pattern analysis indicate the A/B runs
are random?
Yes
i. Based on 3-sigma control limits for the runs test, does the pattern analysis indicate the U/D runs
are random?
Yes
j. Is the optical scanning process in control? Why?
No. The sample ranges are not within the limits, the A/B runs are random, and the U/D runs
are random.
What should management do?
12
Management should take corrective action to see what could have been the causes for the
one observation which made the process appear to be out of control. Using the computer
records, they could identify the items which were scanned during this time to see if there
were any unusual products that may have caused the problem. A TQM summary chart and
Pareto analysis might identify the potential causes of the unreadable scans.
#4: Given the following control chart.
Control Chart
Centerline, -1.7308
LCL, -61.7308
UCL, 58.2692
-80
-60
-40
-20
0
20
40
60
80
0 10 20 30 40 50 60 70
Mean Known Variation
Answer the following questions.
a. How many observations are in the control chart?
26
b. Count the number of A/B and U/D runs for the control chart.
A/B A A A A B A A B B B B B A B B B B B B B B B B B B B 6 runs
U/D U D U D U D D U D U D U D U D D U D U D U D U D D 22 runs
c. What is the expected number of A/B runs?
141
2
26
1
2
#
)( / =+=+=
nsObservatio
rE BA
d. What is the variability of the expected number of A/B runs?
5.2
4
126
4
1#
)( / =
−
=
−
=
nsObservatio
r BAσ
13
e. What is the test statistic for the expected number of runs?
2.3
5.12
146
)(
)(#
)(
/
/
/ −=
−
=
−
=
BA
BA
BA
r
rEruns
rZ
σ
f. Based on 3-sigma control limits for the runs test, does the pattern analysis indicate the A/B runs
are random? Why? Are three too few, just the right amount, or too many runs?
No, because it is not between -3 and 3. There are too few runs.
g. What is the expected number of U/D runs?
17
3
126*2
3
1)(#2
)( / =
−
=
−
=
nsObservatio
rE DU
h. What is the variability of the expected number of A/B runs?
07.2
90
2926*16
90
29)(#16
)( / =
−
=
−
=
nsObservatio
r DUσ
i. What is the test statistic for the expected number of runs?
415.2
07.2
1722
)(
)(#
)(
/
/
/ =
−
=
−
=
DU
DU
DU
r
rEruns
rZ
σ
j. Based on 3-sigma control limits for the runs test, does the pattern analysis indicate the U/D runs
are random? Why?
Yes, because it is between -3 and 3
k. Is the process in control? Why?
No. While the sample ranges are within the limits, the U/D runs are random, the A/B runs
are not random indicating the process is out of control.
#5: An appliance manufacturer wants to contract with a repair shop to handle authorize repairs in
Indianapolis. The company has an acceptable range of repair time of 50 minutes to 90 minutes. Two
vendors have submitted bids for the work: A and B. In test trials, vendor A had a mean repair time 74
minutes with a standard deviation of 4.0 minutes, and vendor B had a repair time of 72 minutes with a
standard deviation of 5.1 minutes.
a. What is the tolerance range the manufacturer will accept?
40 minutes (90 – 50)
14
Answer the following questions assuming the appliance manufacture wants the repair shop to meet 3-sigma
quality control.
b. What is the process capability for vendor A? Vendor B?
Vendor A: Between 62 minutes (74 – 3*4) and 86 minutes (74+3*4)
Vendor B: Between 56.7 minutes (72-3*5.1) and 87.3 minutes (72+3*5.1)
c. Which company meets the appliance manufacturer’s tolerance specifications? Why?
Both meet the tolerance specifications for repair times because they are between the
required 50 minutes and 90 minutes
d. Assuming the appliance manufacturer will only choose one vendor and all other factors are equal
(e.g. price, delivery time, etc), which vendor should the company choose? Why?
Vendor A because the variability of their process is less than the variability of vendor B
Answer the following questions assuming the appliance manufacture wants the repair shop to meet 6-sigma
quality control.
e. What is the process variability a vendor should have if their average repair time is 70 minutes?
Why?
3.3 minutes
6 times the process variability (standard deviation) should be within the allowable range of
20 minutes (90 – 70 or 70 -50). For this to occur 6*s<20 implies s<3.33… minutes.

Contenu connexe

Dernier

Salient Features of India constitution especially power and functions
Salient Features of India constitution especially power and functionsSalient Features of India constitution especially power and functions
Salient Features of India constitution especially power and functions
KarakKing
 
The basics of sentences session 3pptx.pptx
The basics of sentences session 3pptx.pptxThe basics of sentences session 3pptx.pptx
The basics of sentences session 3pptx.pptx
heathfieldcps1
 
Jual Obat Aborsi Hongkong ( Asli No.1 ) 085657271886 Obat Penggugur Kandungan...
Jual Obat Aborsi Hongkong ( Asli No.1 ) 085657271886 Obat Penggugur Kandungan...Jual Obat Aborsi Hongkong ( Asli No.1 ) 085657271886 Obat Penggugur Kandungan...
Jual Obat Aborsi Hongkong ( Asli No.1 ) 085657271886 Obat Penggugur Kandungan...
ZurliaSoop
 

Dernier (20)

Application orientated numerical on hev.ppt
Application orientated numerical on hev.pptApplication orientated numerical on hev.ppt
Application orientated numerical on hev.ppt
 
80 ĐỀ THI THỬ TUYỂN SINH TIẾNG ANH VÀO 10 SỞ GD – ĐT THÀNH PHỐ HỒ CHÍ MINH NĂ...
80 ĐỀ THI THỬ TUYỂN SINH TIẾNG ANH VÀO 10 SỞ GD – ĐT THÀNH PHỐ HỒ CHÍ MINH NĂ...80 ĐỀ THI THỬ TUYỂN SINH TIẾNG ANH VÀO 10 SỞ GD – ĐT THÀNH PHỐ HỒ CHÍ MINH NĂ...
80 ĐỀ THI THỬ TUYỂN SINH TIẾNG ANH VÀO 10 SỞ GD – ĐT THÀNH PHỐ HỒ CHÍ MINH NĂ...
 
Salient Features of India constitution especially power and functions
Salient Features of India constitution especially power and functionsSalient Features of India constitution especially power and functions
Salient Features of India constitution especially power and functions
 
How to Give a Domain for a Field in Odoo 17
How to Give a Domain for a Field in Odoo 17How to Give a Domain for a Field in Odoo 17
How to Give a Domain for a Field in Odoo 17
 
Wellbeing inclusion and digital dystopias.pptx
Wellbeing inclusion and digital dystopias.pptxWellbeing inclusion and digital dystopias.pptx
Wellbeing inclusion and digital dystopias.pptx
 
How to Manage Global Discount in Odoo 17 POS
How to Manage Global Discount in Odoo 17 POSHow to Manage Global Discount in Odoo 17 POS
How to Manage Global Discount in Odoo 17 POS
 
Unit 3 Emotional Intelligence and Spiritual Intelligence.pdf
Unit 3 Emotional Intelligence and Spiritual Intelligence.pdfUnit 3 Emotional Intelligence and Spiritual Intelligence.pdf
Unit 3 Emotional Intelligence and Spiritual Intelligence.pdf
 
Unit-V; Pricing (Pharma Marketing Management).pptx
Unit-V; Pricing (Pharma Marketing Management).pptxUnit-V; Pricing (Pharma Marketing Management).pptx
Unit-V; Pricing (Pharma Marketing Management).pptx
 
Making communications land - Are they received and understood as intended? we...
Making communications land - Are they received and understood as intended? we...Making communications land - Are they received and understood as intended? we...
Making communications land - Are they received and understood as intended? we...
 
Beyond_Borders_Understanding_Anime_and_Manga_Fandom_A_Comprehensive_Audience_...
Beyond_Borders_Understanding_Anime_and_Manga_Fandom_A_Comprehensive_Audience_...Beyond_Borders_Understanding_Anime_and_Manga_Fandom_A_Comprehensive_Audience_...
Beyond_Borders_Understanding_Anime_and_Manga_Fandom_A_Comprehensive_Audience_...
 
Food safety_Challenges food safety laboratories_.pdf
Food safety_Challenges food safety laboratories_.pdfFood safety_Challenges food safety laboratories_.pdf
Food safety_Challenges food safety laboratories_.pdf
 
Fostering Friendships - Enhancing Social Bonds in the Classroom
Fostering Friendships - Enhancing Social Bonds  in the ClassroomFostering Friendships - Enhancing Social Bonds  in the Classroom
Fostering Friendships - Enhancing Social Bonds in the Classroom
 
UGC NET Paper 1 Mathematical Reasoning & Aptitude.pdf
UGC NET Paper 1 Mathematical Reasoning & Aptitude.pdfUGC NET Paper 1 Mathematical Reasoning & Aptitude.pdf
UGC NET Paper 1 Mathematical Reasoning & Aptitude.pdf
 
SKILL OF INTRODUCING THE LESSON MICRO SKILLS.pptx
SKILL OF INTRODUCING THE LESSON MICRO SKILLS.pptxSKILL OF INTRODUCING THE LESSON MICRO SKILLS.pptx
SKILL OF INTRODUCING THE LESSON MICRO SKILLS.pptx
 
Spatium Project Simulation student brief
Spatium Project Simulation student briefSpatium Project Simulation student brief
Spatium Project Simulation student brief
 
The basics of sentences session 3pptx.pptx
The basics of sentences session 3pptx.pptxThe basics of sentences session 3pptx.pptx
The basics of sentences session 3pptx.pptx
 
Micro-Scholarship, What it is, How can it help me.pdf
Micro-Scholarship, What it is, How can it help me.pdfMicro-Scholarship, What it is, How can it help me.pdf
Micro-Scholarship, What it is, How can it help me.pdf
 
Understanding Accommodations and Modifications
Understanding  Accommodations and ModificationsUnderstanding  Accommodations and Modifications
Understanding Accommodations and Modifications
 
Jual Obat Aborsi Hongkong ( Asli No.1 ) 085657271886 Obat Penggugur Kandungan...
Jual Obat Aborsi Hongkong ( Asli No.1 ) 085657271886 Obat Penggugur Kandungan...Jual Obat Aborsi Hongkong ( Asli No.1 ) 085657271886 Obat Penggugur Kandungan...
Jual Obat Aborsi Hongkong ( Asli No.1 ) 085657271886 Obat Penggugur Kandungan...
 
On National Teacher Day, meet the 2024-25 Kenan Fellows
On National Teacher Day, meet the 2024-25 Kenan FellowsOn National Teacher Day, meet the 2024-25 Kenan Fellows
On National Teacher Day, meet the 2024-25 Kenan Fellows
 

En vedette

How Race, Age and Gender Shape Attitudes Towards Mental Health
How Race, Age and Gender Shape Attitudes Towards Mental HealthHow Race, Age and Gender Shape Attitudes Towards Mental Health
How Race, Age and Gender Shape Attitudes Towards Mental Health
ThinkNow
 
Social Media Marketing Trends 2024 // The Global Indie Insights
Social Media Marketing Trends 2024 // The Global Indie InsightsSocial Media Marketing Trends 2024 // The Global Indie Insights
Social Media Marketing Trends 2024 // The Global Indie Insights
Kurio // The Social Media Age(ncy)
 

En vedette (20)

2024 State of Marketing Report – by Hubspot
2024 State of Marketing Report – by Hubspot2024 State of Marketing Report – by Hubspot
2024 State of Marketing Report – by Hubspot
 
Everything You Need To Know About ChatGPT
Everything You Need To Know About ChatGPTEverything You Need To Know About ChatGPT
Everything You Need To Know About ChatGPT
 
Product Design Trends in 2024 | Teenage Engineerings
Product Design Trends in 2024 | Teenage EngineeringsProduct Design Trends in 2024 | Teenage Engineerings
Product Design Trends in 2024 | Teenage Engineerings
 
How Race, Age and Gender Shape Attitudes Towards Mental Health
How Race, Age and Gender Shape Attitudes Towards Mental HealthHow Race, Age and Gender Shape Attitudes Towards Mental Health
How Race, Age and Gender Shape Attitudes Towards Mental Health
 
AI Trends in Creative Operations 2024 by Artwork Flow.pdf
AI Trends in Creative Operations 2024 by Artwork Flow.pdfAI Trends in Creative Operations 2024 by Artwork Flow.pdf
AI Trends in Creative Operations 2024 by Artwork Flow.pdf
 
Skeleton Culture Code
Skeleton Culture CodeSkeleton Culture Code
Skeleton Culture Code
 
PEPSICO Presentation to CAGNY Conference Feb 2024
PEPSICO Presentation to CAGNY Conference Feb 2024PEPSICO Presentation to CAGNY Conference Feb 2024
PEPSICO Presentation to CAGNY Conference Feb 2024
 
Content Methodology: A Best Practices Report (Webinar)
Content Methodology: A Best Practices Report (Webinar)Content Methodology: A Best Practices Report (Webinar)
Content Methodology: A Best Practices Report (Webinar)
 
How to Prepare For a Successful Job Search for 2024
How to Prepare For a Successful Job Search for 2024How to Prepare For a Successful Job Search for 2024
How to Prepare For a Successful Job Search for 2024
 
Social Media Marketing Trends 2024 // The Global Indie Insights
Social Media Marketing Trends 2024 // The Global Indie InsightsSocial Media Marketing Trends 2024 // The Global Indie Insights
Social Media Marketing Trends 2024 // The Global Indie Insights
 
Trends In Paid Search: Navigating The Digital Landscape In 2024
Trends In Paid Search: Navigating The Digital Landscape In 2024Trends In Paid Search: Navigating The Digital Landscape In 2024
Trends In Paid Search: Navigating The Digital Landscape In 2024
 
5 Public speaking tips from TED - Visualized summary
5 Public speaking tips from TED - Visualized summary5 Public speaking tips from TED - Visualized summary
5 Public speaking tips from TED - Visualized summary
 
ChatGPT and the Future of Work - Clark Boyd
ChatGPT and the Future of Work - Clark Boyd ChatGPT and the Future of Work - Clark Boyd
ChatGPT and the Future of Work - Clark Boyd
 
Getting into the tech field. what next
Getting into the tech field. what next Getting into the tech field. what next
Getting into the tech field. what next
 
Google's Just Not That Into You: Understanding Core Updates & Search Intent
Google's Just Not That Into You: Understanding Core Updates & Search IntentGoogle's Just Not That Into You: Understanding Core Updates & Search Intent
Google's Just Not That Into You: Understanding Core Updates & Search Intent
 
How to have difficult conversations
How to have difficult conversations How to have difficult conversations
How to have difficult conversations
 
Introduction to Data Science
Introduction to Data ScienceIntroduction to Data Science
Introduction to Data Science
 
Time Management & Productivity - Best Practices
Time Management & Productivity -  Best PracticesTime Management & Productivity -  Best Practices
Time Management & Productivity - Best Practices
 
The six step guide to practical project management
The six step guide to practical project managementThe six step guide to practical project management
The six step guide to practical project management
 
Beginners Guide to TikTok for Search - Rachel Pearson - We are Tilt __ Bright...
Beginners Guide to TikTok for Search - Rachel Pearson - We are Tilt __ Bright...Beginners Guide to TikTok for Search - Rachel Pearson - We are Tilt __ Bright...
Beginners Guide to TikTok for Search - Rachel Pearson - We are Tilt __ Bright...
 

Design Of Experiements Homework Help

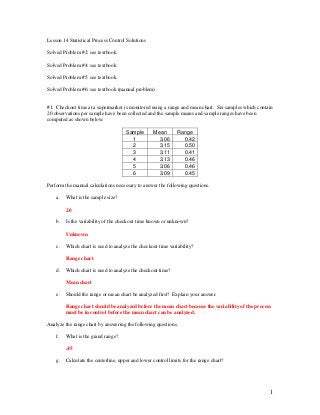
  • 1. 1 Lesson 14 Statistical Process Control Solutions Solved Problem #2: see textbook Solved Problem #4: see textbook Solved Problem #5: see textbook Solved Problem #6: see textbook (manual problem) #1: Checkout time at a supermarket is monitored using a range and mean chart. Six samples which contain 20 observations per sample have been collected and the sample means and sample ranges have been computed as shown below. Sample Mean Range 1 3.06 0.42 2 3.15 0.50 3 3.11 0.41 4 3.13 0.46 5 3.06 0.46 6 3.09 0.45 Perform the manual calculations necessary to answer the following questions. a. What is the sample size? 20 b. Is the variability of the checkout time known or unknown? Unknown c. Which chart is used to analyze the checkout time variability? Range chart d. Which chart is used to analyze the checkout time? Mean chart e. Should the range or mean chart be analyzed first? Explain your answer. Range chart should be analyzed before the mean chart because the variability of the process must be in control before the mean chart can be analyzed. Analyze the range chart by answering the following questions. f. What is the grand range? .45 g. Calculate the centerline, upper and lower control limits for the range chart?
  • 2. 2 71325.585.1*45.* 18675.415.*45.* 45. 4 3 === === === DRUCL DRLCL RrangegrandCenterline h. Plot the range chart showing the centerline, upper and lower control limits. Centerline LCL UCL Sample Range 0 0.1 0.2 0.3 0.4 0.5 0.6 0.7 0.8 0 1 2 3 4 5 6 7 i. Are the sample ranges within the control limits? Yes j. Count the number of A/B and U/D runs for the range chart. A/B B A B A A B 5 runs U/D U D U D D 4 runs k. What is the expected number of A/B runs? 41 2 6 1 2 # )( / =+=+= nsObservatio rE BA l. What is the variability of the expected number of A/B runs? 118.1 4 16 4 1# )( / = − = − = nsObservatio r BAσ m. What is the test statistic for the expected number of runs? 89. 118.1 45 )( )(# )( / / / = − = − = BA BA BA r rEruns rZ σ n. Based on 3-sigma control limits for the runs test, does the pattern analysis indicate the A/B runs are random? Why?
  • 3. 3 Yes, because it is between -3 and 3. o. What is the expected number of U/D runs? 67.3 3 16*2 3 1)(#2 )( / = − = − = nsObservatio rE DU p. What is the variability of the expected number of A/B runs? 86. 90 296*16 90 29)(#16 )( / = − = − = nsObservatio r DUσ q. What is the test statistic for the expected number of runs? 38. 86. 67.34 )( )(# )( / / / = − = − = DU DU DU r rEruns rZ σ r. Based on 3-sigma control limits for the runs test, does the pattern analysis indicate the U/D runs are random? Why? Yes, because it is between -3 and 3 s. Is the variability of the checkout times in control (i.e is the range chart in control)? Why? Yes. The sample ranges are within the limits, the A/B runs are random, and the U/D runs are random. Analyze the mean chart by answering the following questions. t. What is the grand mean? 3.10 u. Calculate the centerline, upper and lower control limits for the mean chart? 181.345.*18.45. 019.345.*18.10.3 10.3 2 2 =+=+= =−=−= === RAXUCL RAXLCL XaveragegrandCenterline v. Plot the mean chart showing the centerline, upper and lower control limits.
  • 4. 4 Centerline LCL UCL Sample Mean 3 3.02 3.04 3.06 3.08 3.1 3.12 3.14 3.16 3.18 3.2 0 1 2 3 4 5 6 7 w. Are the sample means within the control limits? Yes x. Count the number of A/B and U/D runs for the mean chart. A/B B A A A B B 3 runs U/D U D U D U 5 runs y. What is the expected number of A/B runs? 41 2 # )( / =+= nsObservatio rE BA z. What is the variability of the expected number of A/B runs? 118.1 4 1# )( / = − = nsObservatio r BAσ aa. What is the test statistic for the expected number of runs? 89. 118.1 43 )( )(# )( / / / −= − = − = BA BA BA r rEruns rZ σ bb. Based on 3-sigma control limits for the runs test, does the pattern analysis indicate the A/B runs are random? Why? Yes, because it is between -3 and 3. cc. What is the expected number of U/D runs? 67.3 3 1)(#2 )( / = − = nsObservatio rE DU dd. What is the variability of the expected number of A/B runs?
  • 5. 5 86. 90 296*16 90 29)(#16 )( / = − = − = nsObservatio r DUσ ee. What is the test statistic for the expected number of runs? 55.1 86. 67.35 )( )(# )( / / / = − = − = DU DU DU r rEruns rZ σ ff. Based on 3-sigma control limits for the runs test, does the pattern analysis indicate the U/D runs are random? Why? Yes, because it is between -3 and 3 gg. Are the average checkout times in control (i.e. is the mean chart in control)? Why? Yes. The sample means are within the limits and the A/B runs are random, and the U/D runs are random. Based on your analysis is the checkout process in control? Why? Yes, both the range and mean charts indicate the process is in control. #2: The Bayfield Mud Company supplies railroad boxcars of 50 pound bags of mud treating agents to the Wet-Land Drilling Company. Mud treating agents are used to control the pH and other chemical properties of the cone during oil drilling operations. Wet-Land has complained to Bayfield that it’s most recent shipment of bags was underweight by 5%. This is a problem which Wet-Land needs corrected because the use of under weight bags may result in poor chemical control during drilling which may hurt drilling efficiency resulting in serious economic consequences. Afraid of losing a long time customer, Bayfield immediately began investigating their production process. Management suspected that the causes of the problem were their recently added third shift and the fact that all three of the shifts were under pressure to increase output to meet increasing demand for the product. Their quality control staff began taking random samples of the output of 3 bags per hour. They observed the process for 36 hours beginning at 6am. To avoid manually entering the data into the templates it can be copied and pasted from Data Sets on the Lesson Page. Use “copy, paste special, values” to transfer the data to the appropriate SPC template worksheet..
  • 6. 6 Sample Time Bag 1 Bag 2 Bag 3 1 6am 49.60 48.70 50.70 2 7am 50.20 49.10 51.20 3 8am 50.60 49.60 51.40 4 9am 50.80 50.20 51.80 5 10am 49.90 49.20 52.30 6 11am 50.30 48.60 51.70 7 12noon 48.60 46.20 50.40 8 1pm 49.00 46.40 50.00 9 2pm 49.00 46.00 50.60 10 3pm 49.80 48.20 50.80 11 4pm 50.30 49.20 52.70 12 5pm 51.40 50.00 55.30 13 6pm 51.60 49.20 54.70 14 7pm 51.80 50.00 55.60 15 8pm 51.00 48.60 53.20 16 9pm 50.50 49.40 52.40 17 10pm 49.20 46.10 50.70 18 11pm 49.00 46.30 50.80 19 12pm 48.40 45.40 50.20 20 1am 47.60 44.30 49.70 21 2am 47.40 44.10 49.60 22 3am 48.20 45.20 49.00 23 4am 48.00 45.50 49.10 24 5am 48.40 47.10 49.60 25 6am 48.60 47.40 52.00 26 7am 50.00 49.20 52.20 27 8am 49.80 49.00 52.40 28 9am 50.30 49.40 51.70 29 10am 50.20 49.60 51.80 30 11am 50.00 49.00 52.30 31 12noon 50.00 48.80 52.40 32 1pm 50.10 49.40 53.60 33 2pm 49.70 48.60 51.00 34 3pm 48.40 47.20 51.70 35 4pm 47.20 45.30 50.90 36 5pm 46.80 44.10 49.00 Answer the following questions. a. What is the sample size? 3 b. Is the variability of the checkout time known or unknown? Unknown c. Which chart is used to analyze the variability in the bag filling process?
  • 7. 7 Range chart d. Which chart is used to analyze the amount of fill in each bag? Mean chart e. Should the range or mean chart be analyzed first? Explain your answer. Range chart should be analyzed before the mean chart because the variability of the process must be in control before the mean chart can be analyzed. Analyze the range chart by answering the following questions. f. What is the grand range? 3.7472 g. Calculate the centerline, upper and lower control limits for the range chart? 3σ Control Chart Settings UCL 9.6454 Centerline 3.7472 LCL 0.0000 h. Plot the range chart showing the centerline, upper and lower control limits. Control Chart Centerline, 3.7472 LCL, 0.0000 UCL, 9.6454 0 2 4 6 8 10 12 0 10 20 30 40 50 60 70 Range i. Are the sample ranges within the control limits? Yes
  • 8. 8 j. Based on 3-sigma control limits for the runs test, does the pattern analysis indicate the A/B runs are random? Yes k. Based on 3-sigma control limits for the runs test, does the pattern analysis indicate the U/D runs are random? Yes l. Is the variability of the checkout times in control (i.e is the range chart in control)? Why? Yes. The sample ranges are within the limits, the A/B runs are random, and the U/D runs are random. Analyze the mean chart by answering the following questions. m. What is the grand mean? 49.5907 n. Calculate the centerline, upper and lower control limits for the mean chart? 3σ Control Chart Settings UCL 53.4241 Centerline 49.5907 LCL 45.7573 o. Plot the mean chart showing the centerline, upper and lower control limits. Control Chart Centerline, 49.5907 LCL, 45.7573 UCL, 53.4241 45 46 47 48 49 50 51 52 53 54 0 10 20 30 40 50 60 70 Mean Unknown Variation p. Are the sample means within the control limits?
  • 9. 9 Yes q. Based on 3-sigma control limits for the runs test, does the pattern analysis indicate the A/B runs are random? No r. Based on 3-sigma control limits for the runs test, does the pattern analysis indicate the U/D runs are random? No s. Are the average checkout times in control (i.e. is the mean chart in control)? Why? No. While the sample means are within the limits, the A/B runs are not random, and the U/D runs are not random. Based on your analysis is the bag filling process in control? Why? What should management do? No, while the range chart indicates the variability of the bag process is in control, the mean chart indicates the mean chart is not in control. Management should take immediate corrective action and discuss with the people who work in the bag filling process to identify potential causes for the problem. A TQM analysis such as the fishbone (Ishikawa) diagram could be used to identify areas for improvement to get the process under control. Based on the mean control chart, provide an explanation of what may be occurring. It appears the pressure to increase production (fill more bags per hour) is creating the under filled bags. #3: Optical scanners are used in all supermarkets to speed the checkout process. Whenever the scanner fails to read the bar code on the product, the cashier is required to manually punch the code into the register. Obviously, unreadable bar codes slow the checkout process. SPC is used to determine whether the scanner is working properly. Once a day at the check out counter, a sample of 500 scans is taken and the number of times the scanner is unable to read the bar code is determined. The sampling process is performed automatically by the cash register. To avoid manually entering the data into the templates it can be copied and pasted from Data Sets on the Lesson Page. Use “copy, paste special, values” to transfer the data to the appropriate SPC template worksheet..
  • 10. 10 Sample Sample Size Incorrect 1 500 1 2 500 5 3 500 9 4 500 4 5 500 5 6 500 6 7 500 3 8 500 5 9 500 7 10 500 4 11 500 3 12 500 5 13 500 2 14 500 7 15 500 7 16 500 10 17 500 5 18 500 4 19 500 5 20 500 5 21 500 9 22 500 10 23 500 11 24 500 16 25 500 9 Answer the following questions. a. What is the average sample size? 500 b. How many samples were taken? 25 c. Which chart should be used to determine whether the scanning process is in control? Explain your answer. Proportion (P) chart, because it is counted (attribute) data. d. What is the estimate of the expected proportion of scans which are unable to read the bar code? .0126
  • 11. 11 e. Calculate the centerline, upper and lower control limits for the P chart? 3σ Control Chart Settings UCL 0.0275 Centerline 0.0126 LCL 0.0000 f. Plot the P chart showing the centerline, upper and lower control limits. Control Chart Centerline, 0.0126 LCL, 0.0000 UCL, 0.0275 0 0.005 0.01 0.015 0.02 0.025 0.03 0.035 0 10 20 30 40 50 60 70 Proportion g. Are the sample proportions within the control limits? No h. Based on 3-sigma control limits for the runs test, does the pattern analysis indicate the A/B runs are random? Yes i. Based on 3-sigma control limits for the runs test, does the pattern analysis indicate the U/D runs are random? Yes j. Is the optical scanning process in control? Why? No. The sample ranges are not within the limits, the A/B runs are random, and the U/D runs are random. What should management do?
  • 12. 12 Management should take corrective action to see what could have been the causes for the one observation which made the process appear to be out of control. Using the computer records, they could identify the items which were scanned during this time to see if there were any unusual products that may have caused the problem. A TQM summary chart and Pareto analysis might identify the potential causes of the unreadable scans. #4: Given the following control chart. Control Chart Centerline, -1.7308 LCL, -61.7308 UCL, 58.2692 -80 -60 -40 -20 0 20 40 60 80 0 10 20 30 40 50 60 70 Mean Known Variation Answer the following questions. a. How many observations are in the control chart? 26 b. Count the number of A/B and U/D runs for the control chart. A/B A A A A B A A B B B B B A B B B B B B B B B B B B B 6 runs U/D U D U D U D D U D U D U D U D D U D U D U D U D D 22 runs c. What is the expected number of A/B runs? 141 2 26 1 2 # )( / =+=+= nsObservatio rE BA d. What is the variability of the expected number of A/B runs? 5.2 4 126 4 1# )( / = − = − = nsObservatio r BAσ
  • 13. 13 e. What is the test statistic for the expected number of runs? 2.3 5.12 146 )( )(# )( / / / −= − = − = BA BA BA r rEruns rZ σ f. Based on 3-sigma control limits for the runs test, does the pattern analysis indicate the A/B runs are random? Why? Are three too few, just the right amount, or too many runs? No, because it is not between -3 and 3. There are too few runs. g. What is the expected number of U/D runs? 17 3 126*2 3 1)(#2 )( / = − = − = nsObservatio rE DU h. What is the variability of the expected number of A/B runs? 07.2 90 2926*16 90 29)(#16 )( / = − = − = nsObservatio r DUσ i. What is the test statistic for the expected number of runs? 415.2 07.2 1722 )( )(# )( / / / = − = − = DU DU DU r rEruns rZ σ j. Based on 3-sigma control limits for the runs test, does the pattern analysis indicate the U/D runs are random? Why? Yes, because it is between -3 and 3 k. Is the process in control? Why? No. While the sample ranges are within the limits, the U/D runs are random, the A/B runs are not random indicating the process is out of control. #5: An appliance manufacturer wants to contract with a repair shop to handle authorize repairs in Indianapolis. The company has an acceptable range of repair time of 50 minutes to 90 minutes. Two vendors have submitted bids for the work: A and B. In test trials, vendor A had a mean repair time 74 minutes with a standard deviation of 4.0 minutes, and vendor B had a repair time of 72 minutes with a standard deviation of 5.1 minutes. a. What is the tolerance range the manufacturer will accept? 40 minutes (90 – 50)
  • 14. 14 Answer the following questions assuming the appliance manufacture wants the repair shop to meet 3-sigma quality control. b. What is the process capability for vendor A? Vendor B? Vendor A: Between 62 minutes (74 – 3*4) and 86 minutes (74+3*4) Vendor B: Between 56.7 minutes (72-3*5.1) and 87.3 minutes (72+3*5.1) c. Which company meets the appliance manufacturer’s tolerance specifications? Why? Both meet the tolerance specifications for repair times because they are between the required 50 minutes and 90 minutes d. Assuming the appliance manufacturer will only choose one vendor and all other factors are equal (e.g. price, delivery time, etc), which vendor should the company choose? Why? Vendor A because the variability of their process is less than the variability of vendor B Answer the following questions assuming the appliance manufacture wants the repair shop to meet 6-sigma quality control. e. What is the process variability a vendor should have if their average repair time is 70 minutes? Why? 3.3 minutes 6 times the process variability (standard deviation) should be within the allowable range of 20 minutes (90 – 70 or 70 -50). For this to occur 6*s<20 implies s<3.33… minutes.