SlideShare une entreprise Scribd logo
1  sur  10
Télécharger pour lire hors ligne
1	


October 27, 2015
Twitter Reports Third Quarter 2015 Results
SAN FRANCISCO, California – Twitter, Inc. (NYSE: TWTR) today announced financial results for the quarter
ended September 30, 2015.
• Q3 revenue of $569 million, up 58% year-over-year, and above the previously forecast range of $545
million to $560 million. Excluding the impact of year-over-year changes in foreign exchange rates,
revenue would have increased 64%
• Q3 GAAP net loss of $132 million and non-GAAP net income of $67 million
• Q3 GAAP EPS of ($0.20) and non-GAAP diluted EPS of $0.10
• Q3 adjusted EBITDA of $142 million, up 108% year-over-year, and above the previously forecast range
of $110 million to $115 million, representing an adjusted EBITDA margin of 25%
“We continued to see strong financial performance this quarter, as well as meaningful progress across our three
areas of focus: ensuring more disciplined execution, simplifying our services, and better communicating the
value of our platform,” said Jack Dorsey, CEO of Twitter. “We’ve simplified our roadmap and organization
around a few big bets across Twitter, Periscope, and Vine that we believe represent our largest opportunities for
growth.”
Third Quarter 2015 Financial Summary
(In thousands, except per share data)
Three Months Ended Nine Months Ended
September 30, September 30,
2015 2014 2015 2014
GAAP Results
Revenue $ 569,237 $ 361,266 $ 1,507,559 $ 923,924
Net loss $ (131,690) $ (175,464) $ (430,795) $ (452,468)
Diluted net loss per share $ (0.20) $ (0.29) $ (0.66) $ (0.76)
Non-GAAP Results
Adjusted EBITDA $ 142,148 $ 68,326 $ 366,389 $ 159,406
Non-GAAP net income $ 66,984 $ 6,972 $ 162,010 $ 21,751
Non-GAAP diluted net income per share $ 0.10 $ 0.01 $ 0.23 $ 0.03
For additional information regarding the non-GAAP financial measures discussed in this release, please see
"Non-GAAP Financial Measures" and "Reconciliation of GAAP to Non-GAAP Financial Measures" below.
Third Quarter 2015 Operational and Product Highlights
Monthly Active Users – Total average Monthly Active Users (MAUs) were 320 million for the third quarter, up
11% year-over-year, and compared to 316 million in the previous quarter. Excluding SMS Fast Followers, MAUs
2	


were 307 million for the third quarter, up 8% year-over-year, and compared to 304 million in the previous
quarter. Mobile MAUs represented approximately 80% of total MAUs.
Consumer Products – Twitter launched Highlights on Android, Music on Vine, and landscape view and web
profiles for Periscope. We introduced an updated version of the logged-out Twitter.com desktop home page. We
also removed the 140-character limit on direct messages.
Advertising Products – Twitter launched video auto-play on all devices, expanded its self-service ads platform
to over 200 countries and territories, and extended the offerings of the Twitter Audience Platform (formerly the
Twitter Publisher Network) to include additional targeted objectives and new creative formats. For performance
marketers, Twitter introduced new optimization and bidding enhancements. Twitter also introduced event
targeting as well as ads editor, a new tool that enables advertisers to seamlessly create and edit numerous
campaigns at once.
Partnerships – Twitter announced commerce partnerships with platforms that power e-commerce sites,
including Bigcommerce, Demandware, and Shopify, and retailers and brands such as Best Buy, Adidas, and
PacSun. These commerce partnerships are powered by Stripe Relay. Twitter partnered with Square to enable
U.S. political donations through Tweets. Twitter also extended its existing agreement with Bloomberg to bring
more Twitter data to financial professionals.
Third Quarter 2015 Financial Highlights
Revenue – Revenue for the third quarter of 2015 totaled $569 million, an increase of 58% compared to $361
million in the same period in 2014. Excluding the impact of year-over-year changes in foreign exchange rates,
revenue would have increased 64%.
• Advertising revenue totaled $513 million, an increase of 60% year-over-year. Excluding the impact of
year-over-year changes in foreign exchange rates, advertising revenue would have increased 67%.
• Mobile advertising revenue was 86% of total advertising revenue.
• Data licensing and other revenue totaled $56 million, an increase of 37% year-over-year.
• U.S. revenue totaled $370 million, an increase of 54% year-over-year.
• International revenue totaled $199 million, an increase of 65% year-over-year.
Net loss – GAAP net loss was $132 million for the third quarter of 2015 compared to $175 million in the same
period in 2014. GAAP net loss for the third quarter of 2015 included $166 million of stock-based compensation
expense.
Adjusted EBITDA – Adjusted EBITDA was $142 million for the third quarter of 2015, an increase of 108%
compared to $68 million in the same period in 2014.
Non-GAAP net income – Non-GAAP net income was $67 million for the third quarter of 2015 compared to $7
million in the same period in 2014.
EPS – Basic and diluted GAAP EPS was ($0.20) for the third quarter of 2015 compared to ($0.29) in the same
period in 2014.
3	


Non-GAAP diluted EPS – Non-GAAP diluted EPS was $0.10 for the third quarter of 2015 compared to $0.01 in
the same period in 2014.
Capital expenditures – Purchases of property and equipment for the third quarter of 2015 were $106 million.
Additionally, $14 million of equipment purchases were financed through capital leases during the third quarter of
2015.
Cash, cash equivalents, and marketable securities – As of September 30, 2015, cash, cash equivalents, and
marketable securities were approximately $3.5 billion, compared to $3.6 billion as of June 30, 2015.
Outlook
Twitter's outlook for the fourth quarter of 2015 is as follows:
• Revenue is projected to be in the range of $695 million to $710 million.
• Adjusted EBITDA is projected to be in the range of $155 million to $175 million.
• GAAP expenses are projected to include the vast majority of the $5 million to $15 million of total
restructuring charges expected from corporate restructuring activities. These charges are projected to
be $10 million to $20 million in cash expenditures. GAAP expenses are lower than cash restructuring
costs due to a credit related to non-cash stock-based compensation expense reversals for unvested
stock awards.
• Capital expenditures are projected to be no more than $110 million.
• Stock-based compensation expense is projected to be in the range of $170 million to $180 million,
excluding the impact of equity awards that may be granted in connection with potential future
acquisitions.
Note that Twitter's outlook for the fourth quarter of 2015 reflects foreign exchange rates as of October 15, 2015.
Webcast and Conference Call Details
Twitter will host a conference call today, Tuesday, October 27, 2015, at 2:00 p.m. Pacific Time (5:00 p.m.
Eastern Time) to discuss financial results. The company will be following the conversation on Twitter about the
earnings announcement. Tweet to @TwitterIR or use #TWTRearnings or $TWTR to have your questions
considered during the Q&A portion of the conference call along with those submitted by conference call
participants. Watch a live broadcast of the call on Periscope from the @TwitterIR account or tune in to a live
webcast on the company’s Investor Relations page at investor.twitterinc.com. The Investor Relations website will
also have the company’s financial results, supplemental slides, and an archived replay of the webcast. Twitter
has used, and intends to continue to use, its Investor Relations website and the Twitter accounts of @jack,
@twitter, and @TwitterIR as means of disclosing material non-public information and for complying with its
disclosure obligations under Regulation FD.
About Twitter, Inc.
Twitter (NYSE: TWTR) is a global platform for public self-expression and conversation in real time. By developing
a fundamentally new way for people to consume, create, distribute, and discover content, Twitter enables any
voice to echo around the world instantly and unfiltered. The service can be accessed at Twitter.com, on a variety
of mobile devices, and via SMS. Available in more than 35 languages, Twitter has 320 million monthly active
4	


users. For more information, visit about.twitter.com or follow @twitter.
Forward Looking Statements
This press release contains forward-looking statements within the meaning of Section 27A of the Securities Act
of 1933 and Section 21E of the Securities Exchange Act of 1934. Forward-looking statements generally relate to
future events or Twitter's future financial or operating performance. In some cases, you can identify forward-
looking statements because they contain words such as "may," "will," "should," "expects," "plans,"
"anticipates," "could," "intends," "target," "projects," "contemplates," "believes," "estimates," "predicts,"
"potential" or "continue" or the negative of these words or other similar terms or expressions that concern
Twitter's expectations, strategy, plans or intentions. Forward-looking statements in this press release include,
but are not limited to, Twitter's strategies and business plans, Twitter's expectations regarding its revenue,
adjusted EBITDA, capital expenditures and stock-based compensation expense for the fourth quarter 2015.
Twitter's expectations and beliefs regarding these matters may not materialize, and actual results in future
periods are subject to risks and uncertainties that could cause actual results to differ materially from those
projected. These risks include the possibility that: Twitter's user base and engagement do not continue to grow;
Twitter's new products and product features do not meet expectations; advertisers reduce or discontinue their
spending on Twitter; data partners reduce or discontinue their purchases of data licenses from Twitter; and
Twitter experiences expenses that exceed its expectations. The forward-looking statements contained in this
press release are also subject to other risks and uncertainties, including those more fully described in Twitter's
Annual Report on Form 10-K for the fiscal year ended December 31, 2014 and Quarterly Report on Form 10-Q
for the quarter ended June 30, 2015 filed with the Securities and Exchange Commission. Additional information
will also be set forth in Twitter's Quarterly Report on Form 10-Q for the quarter ended September 30, 2015. The
forward-looking statements in this press release are based on information available to Twitter as of the date
hereof, and Twitter disclaims any obligation to update any forward-looking statements, except as required by
law.
Non-GAAP Financial Measures
To supplement Twitter's financial information presented in accordance with generally accepted accounting
principles in the United States, or GAAP, Twitter considers certain financial measures that are not prepared in
accordance with GAAP, including revenue excluding foreign exchange effect, advertising revenue excluding
foreign exchange effect, adjusted EBITDA, non-GAAP net income, adjusted EBITDA margin and non-GAAP
diluted EPS. Twitter defines adjusted EBITDA as net loss adjusted to exclude stock-based compensation
expense, depreciation and amortization expense, interest and other expenses, net and provision (benefit) for
income taxes; and Twitter defines non-GAAP net income as net loss adjusted to exclude stock-based
compensation expense, amortization of acquired intangible assets, non-cash interest expense related to
convertible notes, non-cash expense related to acquisitions and the income tax effects related to acquisitions.
Adjusted EBITDA margin is calculated by dividing adjusted EBITDA by revenue.
Twitter uses the non-GAAP financial measures of adjusted EBITDA, non-GAAP net income, adjusted EBITDA
margin and non-GAAP diluted EPS in evaluating its operating results and for financial and operational decision-
making purposes. Twitter believes that adjusted EBITDA, non-GAAP net income, adjusted EBITDA margin and
non-GAAP diluted EPS help identify underlying trends in its business that could otherwise be masked by the
effect of the expenses that we exclude in adjusted EBITDA, non-GAAP net income, adjusted EBITDA margin and
non-GAAP diluted EPS. Twitter also believes that adjusted EBITDA, non-GAAP net income, adjusted EBITDA
margin and non-GAAP diluted EPS provide useful information about its operating results, enhance the overall
understanding of Twitter's past performance and future prospects and allow for greater transparency with
respect to key metrics used by Twitter's management in its financial and operational decision-making. Twitter
5	


uses these measures to establish budgets and operational goals for managing its business and evaluating its
performance. Twitter translated revenue and advertising revenue for the quarter and nine months ended
September 30, 2015 using the prior year's monthly exchange rates for its settlement currencies other than the
U.S. dollar, which Twitter believes is a useful metric that facilitates comparison to its historical performance.
Twitter is presenting these non-GAAP financial measures to assist investors in seeing Twitter's operating results
through the eyes of management, and because it believes that these measures provide an additional tool for
investors to use in comparing Twitter's core business operating results over multiple periods with other
companies in its industry.
These non-GAAP financial measures should not be considered in isolation from, or as a substitute for, financial
information prepared in accordance with GAAP. These non-GAAP financial measures are not based on any
standardized methodology prescribed by GAAP and are not necessarily comparable to similarly-titled measures
presented by other companies.
For future periods, Twitter is unable to provide a reconciliation of adjusted EBITDA to net loss as a result of the
uncertainty regarding, and the potential variability of, depreciation and amortization expense, interest and other
expenses, net and provision (benefit) for income taxes, that are expected to be incurred in the future.
Contacts
Investors:
Dave Rivinus
ir@twitter.com
Press:
Jim Prosser
jprosser@twitter.com
6	


TWITTER, INC.
CONDENSED CONSOLIDATED BALANCE SHEETS
(In thousands)
(Unaudited)	


September 30, December 31,
2015 2014
Assets
Current assets:
Cash and cash equivalents $ 876,432 $ 1,510,724
Short-term investments 2,612,762 2,111,154
Accounts receivable, net 536,788 418,454
Prepaid expenses and other current assets 237,577 215,521
Total current assets 4,263,559 4,255,853
Property and equipment, net 699,502 557,019
Intangible assets 147,286 105,011
Goodwill 1,123,121 622,570
Other assets 55,596 42,629
Total assets $ 6,289,064 $ 5,583,082
Liabilities and stockholders’ equity
Current liabilities:
Accounts payable $ 40,100 $ 53,241
Accrued and other current liabilities 294,057 228,233
Capital leases, short-term 93,621 112,320
Total current liabilities 427,778 393,794
Convertible notes 1,434,968 1,376,020
Capital leases, long-term 73,525 118,950
Deferred and other long-term tax liabilities, net 32,958 24,706
Other long-term liabilities 45,672 43,209
Total liabilities 2,014,901 1,956,679
Stockholders’ equity:
Common stock 3 3
Additional paid-in capital 6,311,697 5,208,870
Accumulated other comprehensive loss (34,296) (10,024)
Accumulated deficit (2,003,241) (1,572,446)
Total stockholders’ equity 4,274,163 3,626,403
Total liabilities and stockholders’ equity $ 6,289,064 $ 5,583,082


7	


TWITTER, INC.
CONDENSED CONSOLIDATED STATEMENTS OF OPERATIONS
(In thousands, except per share data)
(Unaudited)	


Three Months Ended Nine Months	
  Ended
September 30, September 30,
2015 2014 2015 2014
Revenue $ 569,237 $ 361,266 $ 1,507,559 $ 923,924
Costs and expenses
Cost of revenue 200,195 124,166 511,293 309,696
Research and development 207,937 183,342 596,590 509,828
Sales and marketing 208,797 164,015 594,302 410,511
General and administrative 57,545 51,174 188,231 134,602
Total costs and expenses 674,474 522,697 1,890,416 1,364,637
Loss from operations (105,237) (161,431) (382,857) (440,713)
Interest expense (25,239) (6,079) (73,995) (11,835)
Other income (expense), net 1,948 (7,795) 10,378 (4,138)
Loss before income taxes (128,528) (175,305) (446,474) (456,686)
Provision (benefit) for income taxes 3,162 159 (15,679) (4,218)
Net loss $ (131,690) $ (175,464) $ (430,795) $ (452,468)
Net loss per share:
Basic and diluted $ (0.20) $ (0.29) $ (0.66) $ (0.76)
Weighted-average shares used to
compute net loss per share:	
  
Basic and diluted 670,604 614,395 655,721 596,722


8	


TWITTER, INC.
CONDENSED CONSOLIDATED STATEMENTS OF CASH FLOWS
(In thousands)
(Unaudited)	


Three Months Ended Nine Months Ended
September 30, September 30,
2015 2014 2015 2014
Cash flows from operating activities
Net loss $ (131,690) $ (175,464) $ (430,795) $ (452,468)
Adjustments to reconcile net loss to net cash provided by (used in)
operating activities:	
  
Depreciation and amortization 81,464 60,155 225,377 145,737
Stock-based compensation expense 165,921 169,602 523,869 454,382
Amortization of discount on convertible notes 17,495 2,411 51,139 2,411
Provision for bad debt (2,985) 1,508 360 2,944
Deferred income tax 86 (2,000) (24,220) (9,737)
Other adjustments 10,524 9,074 5,327 9,740
Changes in assets and liabilities, net of assets acquired
and liabilities assumed from acquisitions:	
  
Accounts receivable (61,542) (40,620) (105,486) (77,833)
Prepaid expenses and other assets (4,823) (123,481) (12,684) (140,710)
Accounts payable 1,926 3,891 (9,511) 5,298
Accrued and other liabilities 25,292 9,022 60,452 98,714
Net cash provided by (used in) operating activities 101,668 (85,902) 283,828 38,478
Cash flows from investing activities
Purchases of property and equipment (106,476) (38,762) (266,816) (132,839)
Purchases of marketable securities (850,507) (578,401) (3,086,004) (1,617,415)
Proceeds from maturities of marketable securities 883,118 512,656 2,225,255 1,522,582
Proceeds from sales of marketable securities 24,556 30 359,817 168,168
Changes in restricted cash 957 687 (2,840) (11,029)
Business combinations, net of cash acquired (25,344) (30,981) (51,644) (163,477)
Purchases of cost method investments and others (5,430) (1,300) (12,430) (1,700)
Net cash used in investing activities (79,126) (136,071) (834,662) (235,710)
Cash flows from financing activities
Proceeds from issuance of convertible notes — 1,800,000 — 1,800,000
Convertible notes initial issuance discount — (27,475) — (27,475)
Purchases of convertible note hedges — (387,450) — (387,450)
Proceeds from issuance of warrants — 275,130 — 275,130
Taxes paid related to net share settlement of equity awards (2,398) — (8,878) (16,168)
Repayments of capital lease obligations (28,431) (32,190) (91,365) (75,076)
Proceeds from exercise of stock options 1,488 9,120 8,450 25,027
Proceeds from issuances of common stock under
employee stock purchase plan	
   — — 21,600 21,224
Other financing activities 1,983 (1,500) 1,983 (2,662)
Net cash provided by (used in) financing activities (27,358) 1,635,635 (68,210) 1,612,550
Net increase (decrease) in cash and cash equivalents (4,816) 1,413,662 (619,044) 1,415,318
Foreign exchange effect on cash and cash equivalents (2,059) (5,843) (15,248) (3,533)
Cash and cash equivalents at beginning of period 883,307 844,976 1,510,724 841,010
Cash and cash equivalents at end of period $ 876,432 $ 2,252,795 $ 876,432 $ 2,252,795
Supplemental disclosures of non-cash investing and financing
activities
Common stock issued in connection with acquisitions $ — $ 96,112 $ 516,538 $ 147,958
Equipment purchases under capital leases $ 13,692 $ 62,670 $ 24,236 $ 110,409
Changes in accrued equipment purchases $ (13,467) $ (29,252) $ (4,380) $ 14,345


9	


TWITTER, INC.
RECONCILIATION OF GAAP TO NON-GAAP FINANCIAL MEASURES
(In thousands, except per share data)
(Unaudited)	


Three Months Ended Nine Months	
  Ended
September 30, September 30,
2015 2014 2015 2014
Non-GAAP net income and net income per share:
Net loss $ (131,690) $ (175,464) $ (430,795) $ (452,468)
Stock-based compensation expense 165,921 169,602 523,869 454,382
Amortization of acquired intangible assets 14,481 11,869 39,241 26,144
Non-cash interest expense related to convertible notes 17,495 2,411 51,139 2,411
Non-cash expense related to acquisitions - — 926 —
Income tax effects related to acquisitions 777 (1,446) (22,370) (8,718)
Non-GAAP net income $ 66,984 $ 6,972 $ 162,010 $ 21,751
GAAP diluted shares 670,604 614,395 655,721 596,722
Dilutive equity awards
(1)
	
   29,474 68,672 38,916 86,465
Non-GAAP diluted shares 700,078 683,067 694,637 683,187
Non-GAAP diluted net income per share $ 0.10 $ 0.01 $ 0.23 $ 0.03
Adjusted EBITDA:
Net loss $ (131,690) $ (175,464) $ (430,795) $ (452,468)
Stock-based compensation expense 165,921 169,602 523,869 454,382
Depreciation and amortization expense 81,464 60,155 225,377 145,737
Interest and other expense, net 23,291 13,874 63,617 15,973
Provision (benefit) for income taxes 3,162 159 (15,679) (4,218)
Adjusted EBITDA $ 142,148 $ 68,326 $ 366,389 $ 159,406
Stock-based compensation expense by function:
Cost of revenue $ 8,973 $ 13,596 $ 32,345 $ 37,296
Research and development 100,673 93,973 306,830 264,784
Sales and marketing 37,889 42,884 120,154 108,232
General and administrative 18,386 19,149 64,540 44,070
Total stock-based compensation expense $ 165,921 $ 169,602 $ 523,869 $ 454,382
Amortization of acquired intangible assets by function:
Cost of revenue $ 9,558 $ 8,855 $ 28,104 $ 18,749
Research and development 64 512 192 792
Sales and marketing 4,859 2,502 10,945 6,603
General and administrative — — — —
Total amortization of acquired intangible assets $ 14,481 $ 11,869 $ 39,241 $ 26,144
(1)
Gives effect to potential common stock instruments such as stock options, RSUs, unvested restricted stock and warrant.	


There is no dilutive effect of the notes nor the related hedge and warrant transactions.


10	


TWITTER, INC.
RECONCILIATION OF GAAP REVENUE TO NON-GAAP CONSTANT CURRENCY REVENUE
(In millions)
(Unaudited)	


Three Months Ended Nine Months Ended
September 30, September 30,
2015 2014 2015 2014
Revenue and advertising revenue excluding foreign exchange effect:
Revenue $ 569 $ 361 $ 1,508 $ 924
Foreign exchange effect on 2015 revenue using 2014 rates 23 61
Revenue excluding foreign exchange effect $ 592 $ 1,569
Revenue year-over-year change percent 58% 63%
Revenue excluding foreign exchange effect year-over-year change percent 64% 70%
Advertising revenue $ 513 $ 320 $ 1,353 $ 824
Foreign exchange effect on 2015 advertising revenue using 2014 rates 23 61
Advertising revenue excluding foreign exchange effect $ 536 $ 1,414
Advertising revenue year-over-year change percent 60% 64%
Advertising revenue excluding foreign exchange effect year-over-year change
percent
67% 72%


Contenu connexe

Tendances

Budget FY17 - Reforms set to persist_ recovery in agri to lift 06-06-2016
Budget FY17 - Reforms set to persist_ recovery in agri to lift 06-06-2016Budget FY17 - Reforms set to persist_ recovery in agri to lift 06-06-2016
Budget FY17 - Reforms set to persist_ recovery in agri to lift 06-06-2016
Aijaz Siddique
 
Weekly media update 18. 05. 2015
Weekly media update 18. 05. 2015Weekly media update 18. 05. 2015
Weekly media update 18. 05. 2015
BalmerLawrie
 
GDP & Comms (Mar Qtr 2016) - June 2016
GDP & Comms (Mar Qtr 2016) - June 2016GDP & Comms (Mar Qtr 2016) - June 2016
GDP & Comms (Mar Qtr 2016) - June 2016
Mark Kooymans (M.Econ)
 

Tendances (20)

Budget FY17 - Reforms set to persist_ recovery in agri to lift 06-06-2016
Budget FY17 - Reforms set to persist_ recovery in agri to lift 06-06-2016Budget FY17 - Reforms set to persist_ recovery in agri to lift 06-06-2016
Budget FY17 - Reforms set to persist_ recovery in agri to lift 06-06-2016
 
Nigeria real estate industry outlook 2017 report (abridged version)
Nigeria real estate industry outlook 2017 report (abridged version)Nigeria real estate industry outlook 2017 report (abridged version)
Nigeria real estate industry outlook 2017 report (abridged version)
 
Weekly media update 18. 05. 2015
Weekly media update 18. 05. 2015Weekly media update 18. 05. 2015
Weekly media update 18. 05. 2015
 
BSL Fact Sheet June 2017
BSL Fact Sheet June 2017BSL Fact Sheet June 2017
BSL Fact Sheet June 2017
 
MNI India Business Report July 2014
MNI India Business Report July 2014MNI India Business Report July 2014
MNI India Business Report July 2014
 
Nigeria's socio economic scorecard 2010-2015
Nigeria's socio economic scorecard  2010-2015Nigeria's socio economic scorecard  2010-2015
Nigeria's socio economic scorecard 2010-2015
 
Focus of the Month: Ease of Doing Business: Moving Ahead Steadily
Focus of the Month: Ease of Doing Business: Moving Ahead SteadilyFocus of the Month: Ease of Doing Business: Moving Ahead Steadily
Focus of the Month: Ease of Doing Business: Moving Ahead Steadily
 
Weekly media update 26 08_2019_edited
Weekly media update 26 08_2019_editedWeekly media update 26 08_2019_edited
Weekly media update 26 08_2019_edited
 
Weekly media update 26 08_2019
Weekly media update 26 08_2019Weekly media update 26 08_2019
Weekly media update 26 08_2019
 
R3 2015 China Media Inflation Trend Report
R3 2015 China Media Inflation Trend ReportR3 2015 China Media Inflation Trend Report
R3 2015 China Media Inflation Trend Report
 
Standpoint: Macro Update by Kevin Lings
Standpoint: Macro Update by Kevin Lings Standpoint: Macro Update by Kevin Lings
Standpoint: Macro Update by Kevin Lings
 
Mongolia Economic Brief
Mongolia Economic BriefMongolia Economic Brief
Mongolia Economic Brief
 
Weekly media update 26 11_2018
Weekly media update 26 11_2018Weekly media update 26 11_2018
Weekly media update 26 11_2018
 
Union Budget Detailed Analysis
Union Budget Detailed AnalysisUnion Budget Detailed Analysis
Union Budget Detailed Analysis
 
2016 New Business League Report
2016 New Business League Report2016 New Business League Report
2016 New Business League Report
 
Prelude to Budget 2017-18
Prelude to Budget 2017-18Prelude to Budget 2017-18
Prelude to Budget 2017-18
 
R3 2016 China Media Inflation Trend Report
R3 2016 China Media Inflation Trend ReportR3 2016 China Media Inflation Trend Report
R3 2016 China Media Inflation Trend Report
 
Union Budget Preview - Reinforcement of Fiscal Stimulus
Union Budget Preview - Reinforcement of Fiscal StimulusUnion Budget Preview - Reinforcement of Fiscal Stimulus
Union Budget Preview - Reinforcement of Fiscal Stimulus
 
GDP & Comms (Mar Qtr 2016) - June 2016
GDP & Comms (Mar Qtr 2016) - June 2016GDP & Comms (Mar Qtr 2016) - June 2016
GDP & Comms (Mar Qtr 2016) - June 2016
 
Market outlook April 2021 - ICICI Prudential Mutual Fund
Market outlook April 2021 - ICICI Prudential Mutual FundMarket outlook April 2021 - ICICI Prudential Mutual Fund
Market outlook April 2021 - ICICI Prudential Mutual Fund
 

Similaire à Twitter Q3 2015 Financial Results

Q3 2016 atento earnings presentation
Q3 2016 atento earnings presentationQ3 2016 atento earnings presentation
Q3 2016 atento earnings presentation
atentoinvestors
 
Visa inc. Q2 2015 financial results conference call presentation
Visa inc. Q2 2015 financial results conference call presentationVisa inc. Q2 2015 financial results conference call presentation
Visa inc. Q2 2015 financial results conference call presentation
visainc
 

Similaire à Twitter Q3 2015 Financial Results (20)

Twitter's Q1 2015 Earnings Report
Twitter's Q1 2015 Earnings ReportTwitter's Q1 2015 Earnings Report
Twitter's Q1 2015 Earnings Report
 
Q3 2016 atento earnings presentation
Q3 2016 atento earnings presentationQ3 2016 atento earnings presentation
Q3 2016 atento earnings presentation
 
Final-Q2'22-Earnings-Release.pdf
Final-Q2'22-Earnings-Release.pdfFinal-Q2'22-Earnings-Release.pdf
Final-Q2'22-Earnings-Release.pdf
 
Q3 2016 atento earnings presentation 11.13.16 v1
Q3 2016 atento earnings presentation 11.13.16 v1Q3 2016 atento earnings presentation 11.13.16 v1
Q3 2016 atento earnings presentation 11.13.16 v1
 
Twitter 1st quarter earnings slides
Twitter 1st quarter earnings slidesTwitter 1st quarter earnings slides
Twitter 1st quarter earnings slides
 
Résultats financiers Twitter 4ème trimestre 2015
Résultats financiers Twitter 4ème trimestre 2015Résultats financiers Twitter 4ème trimestre 2015
Résultats financiers Twitter 4ème trimestre 2015
 
Twitter 2015 q4 earnings slides
Twitter 2015 q4 earnings slidesTwitter 2015 q4 earnings slides
Twitter 2015 q4 earnings slides
 
Intuit IR Deck - March 2015
Intuit IR Deck - March 2015Intuit IR Deck - March 2015
Intuit IR Deck - March 2015
 
Pwc 2015 Technology Sector Sec Comment Letter Trends
Pwc 2015 Technology Sector Sec Comment Letter TrendsPwc 2015 Technology Sector Sec Comment Letter Trends
Pwc 2015 Technology Sector Sec Comment Letter Trends
 
January Investor Meetings
January Investor MeetingsJanuary Investor Meetings
January Investor Meetings
 
Q3 FY15 Atento Earnings Presentation
Q3 FY15 Atento Earnings PresentationQ3 FY15 Atento Earnings Presentation
Q3 FY15 Atento Earnings Presentation
 
theScore Q2 F2020 Earnings Presentation
theScore Q2 F2020 Earnings PresentationtheScore Q2 F2020 Earnings Presentation
theScore Q2 F2020 Earnings Presentation
 
Q3 2018 atento earnings presentation 11.12.18
Q3 2018 atento earnings presentation 11.12.18Q3 2018 atento earnings presentation 11.12.18
Q3 2018 atento earnings presentation 11.12.18
 
Ipdn 201507
Ipdn 201507Ipdn 201507
Ipdn 201507
 
Hubs ir deck q417 final
Hubs ir deck q417 finalHubs ir deck q417 final
Hubs ir deck q417 final
 
Level 3 communications bof aml 2015 leveraged finance conference final
Level 3 communications bof aml 2015 leveraged finance conference finalLevel 3 communications bof aml 2015 leveraged finance conference final
Level 3 communications bof aml 2015 leveraged finance conference final
 
Visa inc. Q2 2015 financial results conference call presentation
Visa inc. Q2 2015 financial results conference call presentationVisa inc. Q2 2015 financial results conference call presentation
Visa inc. Q2 2015 financial results conference call presentation
 
Q4 2016 atento earnings presentation 3.21.17 vf
Q4 2016 atento earnings presentation 3.21.17 vfQ4 2016 atento earnings presentation 3.21.17 vf
Q4 2016 atento earnings presentation 3.21.17 vf
 
3 Q 2015 External Earnings Presentation 2015-10-28-Final
3 Q 2015 External Earnings Presentation 2015-10-28-Final3 Q 2015 External Earnings Presentation 2015-10-28-Final
3 Q 2015 External Earnings Presentation 2015-10-28-Final
 
Symantec investor presentation may 2015 final
Symantec investor presentation may 2015 finalSymantec investor presentation may 2015 final
Symantec investor presentation may 2015 final
 

Dernier

B2 Interpret the brief.docxccccccccccccccc
B2 Interpret the brief.docxcccccccccccccccB2 Interpret the brief.docxccccccccccccccc
B2 Interpret the brief.docxccccccccccccccc
MollyBrown86
 
VIP Call Girls Kheda 7001035870 Whatsapp Number, 24/07 Booking
VIP Call Girls Kheda 7001035870 Whatsapp Number, 24/07 BookingVIP Call Girls Kheda 7001035870 Whatsapp Number, 24/07 Booking
VIP Call Girls Kheda 7001035870 Whatsapp Number, 24/07 Booking
dharasingh5698
 
VIP Call Girls Junagadh 7001035870 Whatsapp Number, 24/07 Booking
VIP Call Girls Junagadh 7001035870 Whatsapp Number, 24/07 BookingVIP Call Girls Junagadh 7001035870 Whatsapp Number, 24/07 Booking
VIP Call Girls Junagadh 7001035870 Whatsapp Number, 24/07 Booking
dharasingh5698
 
Call Girls in Panjabi Bagh, Delhi 💯 Call Us 🔝9953056974 🔝 Escort Service
Call Girls in Panjabi Bagh, Delhi 💯 Call Us 🔝9953056974 🔝 Escort ServiceCall Girls in Panjabi Bagh, Delhi 💯 Call Us 🔝9953056974 🔝 Escort Service
Call Girls in Panjabi Bagh, Delhi 💯 Call Us 🔝9953056974 🔝 Escort Service
9953056974 Low Rate Call Girls In Saket, Delhi NCR
 
Corporate Presentation Probe May 2024.pdf
Corporate Presentation Probe May 2024.pdfCorporate Presentation Probe May 2024.pdf
Corporate Presentation Probe May 2024.pdf
Probe Gold
 

Dernier (20)

Best investment platform in india-Falcon Invoice Discounting
Best investment platform in india-Falcon Invoice DiscountingBest investment platform in india-Falcon Invoice Discounting
Best investment platform in india-Falcon Invoice Discounting
 
Collective Mining | Corporate Presentation - May 2024
Collective Mining | Corporate Presentation - May 2024Collective Mining | Corporate Presentation - May 2024
Collective Mining | Corporate Presentation - May 2024
 
Dattawadi ( Call Girls ) Pune 6297143586 Hot Model With Sexy Bhabi Ready Fo...
Dattawadi ( Call Girls ) Pune  6297143586  Hot Model With Sexy Bhabi Ready Fo...Dattawadi ( Call Girls ) Pune  6297143586  Hot Model With Sexy Bhabi Ready Fo...
Dattawadi ( Call Girls ) Pune 6297143586 Hot Model With Sexy Bhabi Ready Fo...
 
B2 Interpret the brief.docxccccccccccccccc
B2 Interpret the brief.docxcccccccccccccccB2 Interpret the brief.docxccccccccccccccc
B2 Interpret the brief.docxccccccccccccccc
 
Diligence Checklist for Early Stage Startups
Diligence Checklist for Early Stage StartupsDiligence Checklist for Early Stage Startups
Diligence Checklist for Early Stage Startups
 
VVIP Pune Call Girls Parvati Gaon WhatSapp Number 8005736733 With Elite Staff...
VVIP Pune Call Girls Parvati Gaon WhatSapp Number 8005736733 With Elite Staff...VVIP Pune Call Girls Parvati Gaon WhatSapp Number 8005736733 With Elite Staff...
VVIP Pune Call Girls Parvati Gaon WhatSapp Number 8005736733 With Elite Staff...
 
Collective Mining | Corporate Presentation - May 2024
Collective Mining | Corporate Presentation - May 2024Collective Mining | Corporate Presentation - May 2024
Collective Mining | Corporate Presentation - May 2024
 
VIP Call Girls Kheda 7001035870 Whatsapp Number, 24/07 Booking
VIP Call Girls Kheda 7001035870 Whatsapp Number, 24/07 BookingVIP Call Girls Kheda 7001035870 Whatsapp Number, 24/07 Booking
VIP Call Girls Kheda 7001035870 Whatsapp Number, 24/07 Booking
 
ITAU EQUITY_STRATEGY_WARM_UP_20240505 DHG.pdf
ITAU EQUITY_STRATEGY_WARM_UP_20240505 DHG.pdfITAU EQUITY_STRATEGY_WARM_UP_20240505 DHG.pdf
ITAU EQUITY_STRATEGY_WARM_UP_20240505 DHG.pdf
 
AMG Quarterly Investor Presentation May 2024
AMG Quarterly Investor Presentation May 2024AMG Quarterly Investor Presentation May 2024
AMG Quarterly Investor Presentation May 2024
 
Indapur - Virgin Call Girls Pune | Whatsapp No 8005736733 VIP Escorts Service...
Indapur - Virgin Call Girls Pune | Whatsapp No 8005736733 VIP Escorts Service...Indapur - Virgin Call Girls Pune | Whatsapp No 8005736733 VIP Escorts Service...
Indapur - Virgin Call Girls Pune | Whatsapp No 8005736733 VIP Escorts Service...
 
Western Copper and Gold - May 2024 Presentation
Western Copper and Gold - May 2024 PresentationWestern Copper and Gold - May 2024 Presentation
Western Copper and Gold - May 2024 Presentation
 
VIP Call Girls Junagadh 7001035870 Whatsapp Number, 24/07 Booking
VIP Call Girls Junagadh 7001035870 Whatsapp Number, 24/07 BookingVIP Call Girls Junagadh 7001035870 Whatsapp Number, 24/07 Booking
VIP Call Girls Junagadh 7001035870 Whatsapp Number, 24/07 Booking
 
Balaji Nagar ( Call Girls ) Pune 6297143586 Hot Model With Sexy Bhabi Ready...
Balaji Nagar ( Call Girls ) Pune  6297143586  Hot Model With Sexy Bhabi Ready...Balaji Nagar ( Call Girls ) Pune  6297143586  Hot Model With Sexy Bhabi Ready...
Balaji Nagar ( Call Girls ) Pune 6297143586 Hot Model With Sexy Bhabi Ready...
 
Call Girls in Panjabi Bagh, Delhi 💯 Call Us 🔝9953056974 🔝 Escort Service
Call Girls in Panjabi Bagh, Delhi 💯 Call Us 🔝9953056974 🔝 Escort ServiceCall Girls in Panjabi Bagh, Delhi 💯 Call Us 🔝9953056974 🔝 Escort Service
Call Girls in Panjabi Bagh, Delhi 💯 Call Us 🔝9953056974 🔝 Escort Service
 
SME IPO Opportunity and Trends of May 2024
SME IPO Opportunity and Trends of May 2024SME IPO Opportunity and Trends of May 2024
SME IPO Opportunity and Trends of May 2024
 
Corporate Presentation Probe May 2024.pdf
Corporate Presentation Probe May 2024.pdfCorporate Presentation Probe May 2024.pdf
Corporate Presentation Probe May 2024.pdf
 
VVIP Pune Call Girls Handewadi WhatSapp Number 8005736733 With Elite Staff An...
VVIP Pune Call Girls Handewadi WhatSapp Number 8005736733 With Elite Staff An...VVIP Pune Call Girls Handewadi WhatSapp Number 8005736733 With Elite Staff An...
VVIP Pune Call Girls Handewadi WhatSapp Number 8005736733 With Elite Staff An...
 
VVIP Pune Call Girls Sopan Baug WhatSapp Number 8005736733 With Elite Staff A...
VVIP Pune Call Girls Sopan Baug WhatSapp Number 8005736733 With Elite Staff A...VVIP Pune Call Girls Sopan Baug WhatSapp Number 8005736733 With Elite Staff A...
VVIP Pune Call Girls Sopan Baug WhatSapp Number 8005736733 With Elite Staff A...
 
Teekay Corporation Q1-24 Earnings Results
Teekay Corporation Q1-24 Earnings ResultsTeekay Corporation Q1-24 Earnings Results
Teekay Corporation Q1-24 Earnings Results
 

Twitter Q3 2015 Financial Results

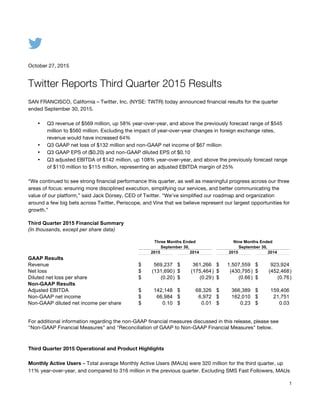
  • 1. 1     October 27, 2015 Twitter Reports Third Quarter 2015 Results SAN FRANCISCO, California – Twitter, Inc. (NYSE: TWTR) today announced financial results for the quarter ended September 30, 2015. • Q3 revenue of $569 million, up 58% year-over-year, and above the previously forecast range of $545 million to $560 million. Excluding the impact of year-over-year changes in foreign exchange rates, revenue would have increased 64% • Q3 GAAP net loss of $132 million and non-GAAP net income of $67 million • Q3 GAAP EPS of ($0.20) and non-GAAP diluted EPS of $0.10 • Q3 adjusted EBITDA of $142 million, up 108% year-over-year, and above the previously forecast range of $110 million to $115 million, representing an adjusted EBITDA margin of 25% “We continued to see strong financial performance this quarter, as well as meaningful progress across our three areas of focus: ensuring more disciplined execution, simplifying our services, and better communicating the value of our platform,” said Jack Dorsey, CEO of Twitter. “We’ve simplified our roadmap and organization around a few big bets across Twitter, Periscope, and Vine that we believe represent our largest opportunities for growth.” Third Quarter 2015 Financial Summary (In thousands, except per share data) Three Months Ended Nine Months Ended September 30, September 30, 2015 2014 2015 2014 GAAP Results Revenue $ 569,237 $ 361,266 $ 1,507,559 $ 923,924 Net loss $ (131,690) $ (175,464) $ (430,795) $ (452,468) Diluted net loss per share $ (0.20) $ (0.29) $ (0.66) $ (0.76) Non-GAAP Results Adjusted EBITDA $ 142,148 $ 68,326 $ 366,389 $ 159,406 Non-GAAP net income $ 66,984 $ 6,972 $ 162,010 $ 21,751 Non-GAAP diluted net income per share $ 0.10 $ 0.01 $ 0.23 $ 0.03 For additional information regarding the non-GAAP financial measures discussed in this release, please see "Non-GAAP Financial Measures" and "Reconciliation of GAAP to Non-GAAP Financial Measures" below. Third Quarter 2015 Operational and Product Highlights Monthly Active Users – Total average Monthly Active Users (MAUs) were 320 million for the third quarter, up 11% year-over-year, and compared to 316 million in the previous quarter. Excluding SMS Fast Followers, MAUs
  • 2. 2     were 307 million for the third quarter, up 8% year-over-year, and compared to 304 million in the previous quarter. Mobile MAUs represented approximately 80% of total MAUs. Consumer Products – Twitter launched Highlights on Android, Music on Vine, and landscape view and web profiles for Periscope. We introduced an updated version of the logged-out Twitter.com desktop home page. We also removed the 140-character limit on direct messages. Advertising Products – Twitter launched video auto-play on all devices, expanded its self-service ads platform to over 200 countries and territories, and extended the offerings of the Twitter Audience Platform (formerly the Twitter Publisher Network) to include additional targeted objectives and new creative formats. For performance marketers, Twitter introduced new optimization and bidding enhancements. Twitter also introduced event targeting as well as ads editor, a new tool that enables advertisers to seamlessly create and edit numerous campaigns at once. Partnerships – Twitter announced commerce partnerships with platforms that power e-commerce sites, including Bigcommerce, Demandware, and Shopify, and retailers and brands such as Best Buy, Adidas, and PacSun. These commerce partnerships are powered by Stripe Relay. Twitter partnered with Square to enable U.S. political donations through Tweets. Twitter also extended its existing agreement with Bloomberg to bring more Twitter data to financial professionals. Third Quarter 2015 Financial Highlights Revenue – Revenue for the third quarter of 2015 totaled $569 million, an increase of 58% compared to $361 million in the same period in 2014. Excluding the impact of year-over-year changes in foreign exchange rates, revenue would have increased 64%. • Advertising revenue totaled $513 million, an increase of 60% year-over-year. Excluding the impact of year-over-year changes in foreign exchange rates, advertising revenue would have increased 67%. • Mobile advertising revenue was 86% of total advertising revenue. • Data licensing and other revenue totaled $56 million, an increase of 37% year-over-year. • U.S. revenue totaled $370 million, an increase of 54% year-over-year. • International revenue totaled $199 million, an increase of 65% year-over-year. Net loss – GAAP net loss was $132 million for the third quarter of 2015 compared to $175 million in the same period in 2014. GAAP net loss for the third quarter of 2015 included $166 million of stock-based compensation expense. Adjusted EBITDA – Adjusted EBITDA was $142 million for the third quarter of 2015, an increase of 108% compared to $68 million in the same period in 2014. Non-GAAP net income – Non-GAAP net income was $67 million for the third quarter of 2015 compared to $7 million in the same period in 2014. EPS – Basic and diluted GAAP EPS was ($0.20) for the third quarter of 2015 compared to ($0.29) in the same period in 2014.
  • 3. 3     Non-GAAP diluted EPS – Non-GAAP diluted EPS was $0.10 for the third quarter of 2015 compared to $0.01 in the same period in 2014. Capital expenditures – Purchases of property and equipment for the third quarter of 2015 were $106 million. Additionally, $14 million of equipment purchases were financed through capital leases during the third quarter of 2015. Cash, cash equivalents, and marketable securities – As of September 30, 2015, cash, cash equivalents, and marketable securities were approximately $3.5 billion, compared to $3.6 billion as of June 30, 2015. Outlook Twitter's outlook for the fourth quarter of 2015 is as follows: • Revenue is projected to be in the range of $695 million to $710 million. • Adjusted EBITDA is projected to be in the range of $155 million to $175 million. • GAAP expenses are projected to include the vast majority of the $5 million to $15 million of total restructuring charges expected from corporate restructuring activities. These charges are projected to be $10 million to $20 million in cash expenditures. GAAP expenses are lower than cash restructuring costs due to a credit related to non-cash stock-based compensation expense reversals for unvested stock awards. • Capital expenditures are projected to be no more than $110 million. • Stock-based compensation expense is projected to be in the range of $170 million to $180 million, excluding the impact of equity awards that may be granted in connection with potential future acquisitions. Note that Twitter's outlook for the fourth quarter of 2015 reflects foreign exchange rates as of October 15, 2015. Webcast and Conference Call Details Twitter will host a conference call today, Tuesday, October 27, 2015, at 2:00 p.m. Pacific Time (5:00 p.m. Eastern Time) to discuss financial results. The company will be following the conversation on Twitter about the earnings announcement. Tweet to @TwitterIR or use #TWTRearnings or $TWTR to have your questions considered during the Q&A portion of the conference call along with those submitted by conference call participants. Watch a live broadcast of the call on Periscope from the @TwitterIR account or tune in to a live webcast on the company’s Investor Relations page at investor.twitterinc.com. The Investor Relations website will also have the company’s financial results, supplemental slides, and an archived replay of the webcast. Twitter has used, and intends to continue to use, its Investor Relations website and the Twitter accounts of @jack, @twitter, and @TwitterIR as means of disclosing material non-public information and for complying with its disclosure obligations under Regulation FD. About Twitter, Inc. Twitter (NYSE: TWTR) is a global platform for public self-expression and conversation in real time. By developing a fundamentally new way for people to consume, create, distribute, and discover content, Twitter enables any voice to echo around the world instantly and unfiltered. The service can be accessed at Twitter.com, on a variety of mobile devices, and via SMS. Available in more than 35 languages, Twitter has 320 million monthly active
  • 4. 4     users. For more information, visit about.twitter.com or follow @twitter. Forward Looking Statements This press release contains forward-looking statements within the meaning of Section 27A of the Securities Act of 1933 and Section 21E of the Securities Exchange Act of 1934. Forward-looking statements generally relate to future events or Twitter's future financial or operating performance. In some cases, you can identify forward- looking statements because they contain words such as "may," "will," "should," "expects," "plans," "anticipates," "could," "intends," "target," "projects," "contemplates," "believes," "estimates," "predicts," "potential" or "continue" or the negative of these words or other similar terms or expressions that concern Twitter's expectations, strategy, plans or intentions. Forward-looking statements in this press release include, but are not limited to, Twitter's strategies and business plans, Twitter's expectations regarding its revenue, adjusted EBITDA, capital expenditures and stock-based compensation expense for the fourth quarter 2015. Twitter's expectations and beliefs regarding these matters may not materialize, and actual results in future periods are subject to risks and uncertainties that could cause actual results to differ materially from those projected. These risks include the possibility that: Twitter's user base and engagement do not continue to grow; Twitter's new products and product features do not meet expectations; advertisers reduce or discontinue their spending on Twitter; data partners reduce or discontinue their purchases of data licenses from Twitter; and Twitter experiences expenses that exceed its expectations. The forward-looking statements contained in this press release are also subject to other risks and uncertainties, including those more fully described in Twitter's Annual Report on Form 10-K for the fiscal year ended December 31, 2014 and Quarterly Report on Form 10-Q for the quarter ended June 30, 2015 filed with the Securities and Exchange Commission. Additional information will also be set forth in Twitter's Quarterly Report on Form 10-Q for the quarter ended September 30, 2015. The forward-looking statements in this press release are based on information available to Twitter as of the date hereof, and Twitter disclaims any obligation to update any forward-looking statements, except as required by law. Non-GAAP Financial Measures To supplement Twitter's financial information presented in accordance with generally accepted accounting principles in the United States, or GAAP, Twitter considers certain financial measures that are not prepared in accordance with GAAP, including revenue excluding foreign exchange effect, advertising revenue excluding foreign exchange effect, adjusted EBITDA, non-GAAP net income, adjusted EBITDA margin and non-GAAP diluted EPS. Twitter defines adjusted EBITDA as net loss adjusted to exclude stock-based compensation expense, depreciation and amortization expense, interest and other expenses, net and provision (benefit) for income taxes; and Twitter defines non-GAAP net income as net loss adjusted to exclude stock-based compensation expense, amortization of acquired intangible assets, non-cash interest expense related to convertible notes, non-cash expense related to acquisitions and the income tax effects related to acquisitions. Adjusted EBITDA margin is calculated by dividing adjusted EBITDA by revenue. Twitter uses the non-GAAP financial measures of adjusted EBITDA, non-GAAP net income, adjusted EBITDA margin and non-GAAP diluted EPS in evaluating its operating results and for financial and operational decision- making purposes. Twitter believes that adjusted EBITDA, non-GAAP net income, adjusted EBITDA margin and non-GAAP diluted EPS help identify underlying trends in its business that could otherwise be masked by the effect of the expenses that we exclude in adjusted EBITDA, non-GAAP net income, adjusted EBITDA margin and non-GAAP diluted EPS. Twitter also believes that adjusted EBITDA, non-GAAP net income, adjusted EBITDA margin and non-GAAP diluted EPS provide useful information about its operating results, enhance the overall understanding of Twitter's past performance and future prospects and allow for greater transparency with respect to key metrics used by Twitter's management in its financial and operational decision-making. Twitter
  • 5. 5     uses these measures to establish budgets and operational goals for managing its business and evaluating its performance. Twitter translated revenue and advertising revenue for the quarter and nine months ended September 30, 2015 using the prior year's monthly exchange rates for its settlement currencies other than the U.S. dollar, which Twitter believes is a useful metric that facilitates comparison to its historical performance. Twitter is presenting these non-GAAP financial measures to assist investors in seeing Twitter's operating results through the eyes of management, and because it believes that these measures provide an additional tool for investors to use in comparing Twitter's core business operating results over multiple periods with other companies in its industry. These non-GAAP financial measures should not be considered in isolation from, or as a substitute for, financial information prepared in accordance with GAAP. These non-GAAP financial measures are not based on any standardized methodology prescribed by GAAP and are not necessarily comparable to similarly-titled measures presented by other companies. For future periods, Twitter is unable to provide a reconciliation of adjusted EBITDA to net loss as a result of the uncertainty regarding, and the potential variability of, depreciation and amortization expense, interest and other expenses, net and provision (benefit) for income taxes, that are expected to be incurred in the future. Contacts Investors: Dave Rivinus ir@twitter.com Press: Jim Prosser jprosser@twitter.com
  • 6. 6     TWITTER, INC. CONDENSED CONSOLIDATED BALANCE SHEETS (In thousands) (Unaudited)       September 30, December 31, 2015 2014 Assets Current assets: Cash and cash equivalents $ 876,432 $ 1,510,724 Short-term investments 2,612,762 2,111,154 Accounts receivable, net 536,788 418,454 Prepaid expenses and other current assets 237,577 215,521 Total current assets 4,263,559 4,255,853 Property and equipment, net 699,502 557,019 Intangible assets 147,286 105,011 Goodwill 1,123,121 622,570 Other assets 55,596 42,629 Total assets $ 6,289,064 $ 5,583,082 Liabilities and stockholders’ equity Current liabilities: Accounts payable $ 40,100 $ 53,241 Accrued and other current liabilities 294,057 228,233 Capital leases, short-term 93,621 112,320 Total current liabilities 427,778 393,794 Convertible notes 1,434,968 1,376,020 Capital leases, long-term 73,525 118,950 Deferred and other long-term tax liabilities, net 32,958 24,706 Other long-term liabilities 45,672 43,209 Total liabilities 2,014,901 1,956,679 Stockholders’ equity: Common stock 3 3 Additional paid-in capital 6,311,697 5,208,870 Accumulated other comprehensive loss (34,296) (10,024) Accumulated deficit (2,003,241) (1,572,446) Total stockholders’ equity 4,274,163 3,626,403 Total liabilities and stockholders’ equity $ 6,289,064 $ 5,583,082    
  • 7. 7     TWITTER, INC. CONDENSED CONSOLIDATED STATEMENTS OF OPERATIONS (In thousands, except per share data) (Unaudited)       Three Months Ended Nine Months  Ended September 30, September 30, 2015 2014 2015 2014 Revenue $ 569,237 $ 361,266 $ 1,507,559 $ 923,924 Costs and expenses Cost of revenue 200,195 124,166 511,293 309,696 Research and development 207,937 183,342 596,590 509,828 Sales and marketing 208,797 164,015 594,302 410,511 General and administrative 57,545 51,174 188,231 134,602 Total costs and expenses 674,474 522,697 1,890,416 1,364,637 Loss from operations (105,237) (161,431) (382,857) (440,713) Interest expense (25,239) (6,079) (73,995) (11,835) Other income (expense), net 1,948 (7,795) 10,378 (4,138) Loss before income taxes (128,528) (175,305) (446,474) (456,686) Provision (benefit) for income taxes 3,162 159 (15,679) (4,218) Net loss $ (131,690) $ (175,464) $ (430,795) $ (452,468) Net loss per share: Basic and diluted $ (0.20) $ (0.29) $ (0.66) $ (0.76) Weighted-average shares used to compute net loss per share:   Basic and diluted 670,604 614,395 655,721 596,722    
  • 8. 8     TWITTER, INC. CONDENSED CONSOLIDATED STATEMENTS OF CASH FLOWS (In thousands) (Unaudited)       Three Months Ended Nine Months Ended September 30, September 30, 2015 2014 2015 2014 Cash flows from operating activities Net loss $ (131,690) $ (175,464) $ (430,795) $ (452,468) Adjustments to reconcile net loss to net cash provided by (used in) operating activities:   Depreciation and amortization 81,464 60,155 225,377 145,737 Stock-based compensation expense 165,921 169,602 523,869 454,382 Amortization of discount on convertible notes 17,495 2,411 51,139 2,411 Provision for bad debt (2,985) 1,508 360 2,944 Deferred income tax 86 (2,000) (24,220) (9,737) Other adjustments 10,524 9,074 5,327 9,740 Changes in assets and liabilities, net of assets acquired and liabilities assumed from acquisitions:   Accounts receivable (61,542) (40,620) (105,486) (77,833) Prepaid expenses and other assets (4,823) (123,481) (12,684) (140,710) Accounts payable 1,926 3,891 (9,511) 5,298 Accrued and other liabilities 25,292 9,022 60,452 98,714 Net cash provided by (used in) operating activities 101,668 (85,902) 283,828 38,478 Cash flows from investing activities Purchases of property and equipment (106,476) (38,762) (266,816) (132,839) Purchases of marketable securities (850,507) (578,401) (3,086,004) (1,617,415) Proceeds from maturities of marketable securities 883,118 512,656 2,225,255 1,522,582 Proceeds from sales of marketable securities 24,556 30 359,817 168,168 Changes in restricted cash 957 687 (2,840) (11,029) Business combinations, net of cash acquired (25,344) (30,981) (51,644) (163,477) Purchases of cost method investments and others (5,430) (1,300) (12,430) (1,700) Net cash used in investing activities (79,126) (136,071) (834,662) (235,710) Cash flows from financing activities Proceeds from issuance of convertible notes — 1,800,000 — 1,800,000 Convertible notes initial issuance discount — (27,475) — (27,475) Purchases of convertible note hedges — (387,450) — (387,450) Proceeds from issuance of warrants — 275,130 — 275,130 Taxes paid related to net share settlement of equity awards (2,398) — (8,878) (16,168) Repayments of capital lease obligations (28,431) (32,190) (91,365) (75,076) Proceeds from exercise of stock options 1,488 9,120 8,450 25,027 Proceeds from issuances of common stock under employee stock purchase plan   — — 21,600 21,224 Other financing activities 1,983 (1,500) 1,983 (2,662) Net cash provided by (used in) financing activities (27,358) 1,635,635 (68,210) 1,612,550 Net increase (decrease) in cash and cash equivalents (4,816) 1,413,662 (619,044) 1,415,318 Foreign exchange effect on cash and cash equivalents (2,059) (5,843) (15,248) (3,533) Cash and cash equivalents at beginning of period 883,307 844,976 1,510,724 841,010 Cash and cash equivalents at end of period $ 876,432 $ 2,252,795 $ 876,432 $ 2,252,795 Supplemental disclosures of non-cash investing and financing activities Common stock issued in connection with acquisitions $ — $ 96,112 $ 516,538 $ 147,958 Equipment purchases under capital leases $ 13,692 $ 62,670 $ 24,236 $ 110,409 Changes in accrued equipment purchases $ (13,467) $ (29,252) $ (4,380) $ 14,345    
  • 9. 9     TWITTER, INC. RECONCILIATION OF GAAP TO NON-GAAP FINANCIAL MEASURES (In thousands, except per share data) (Unaudited)       Three Months Ended Nine Months  Ended September 30, September 30, 2015 2014 2015 2014 Non-GAAP net income and net income per share: Net loss $ (131,690) $ (175,464) $ (430,795) $ (452,468) Stock-based compensation expense 165,921 169,602 523,869 454,382 Amortization of acquired intangible assets 14,481 11,869 39,241 26,144 Non-cash interest expense related to convertible notes 17,495 2,411 51,139 2,411 Non-cash expense related to acquisitions - — 926 — Income tax effects related to acquisitions 777 (1,446) (22,370) (8,718) Non-GAAP net income $ 66,984 $ 6,972 $ 162,010 $ 21,751 GAAP diluted shares 670,604 614,395 655,721 596,722 Dilutive equity awards (1)   29,474 68,672 38,916 86,465 Non-GAAP diluted shares 700,078 683,067 694,637 683,187 Non-GAAP diluted net income per share $ 0.10 $ 0.01 $ 0.23 $ 0.03 Adjusted EBITDA: Net loss $ (131,690) $ (175,464) $ (430,795) $ (452,468) Stock-based compensation expense 165,921 169,602 523,869 454,382 Depreciation and amortization expense 81,464 60,155 225,377 145,737 Interest and other expense, net 23,291 13,874 63,617 15,973 Provision (benefit) for income taxes 3,162 159 (15,679) (4,218) Adjusted EBITDA $ 142,148 $ 68,326 $ 366,389 $ 159,406 Stock-based compensation expense by function: Cost of revenue $ 8,973 $ 13,596 $ 32,345 $ 37,296 Research and development 100,673 93,973 306,830 264,784 Sales and marketing 37,889 42,884 120,154 108,232 General and administrative 18,386 19,149 64,540 44,070 Total stock-based compensation expense $ 165,921 $ 169,602 $ 523,869 $ 454,382 Amortization of acquired intangible assets by function: Cost of revenue $ 9,558 $ 8,855 $ 28,104 $ 18,749 Research and development 64 512 192 792 Sales and marketing 4,859 2,502 10,945 6,603 General and administrative — — — — Total amortization of acquired intangible assets $ 14,481 $ 11,869 $ 39,241 $ 26,144 (1) Gives effect to potential common stock instruments such as stock options, RSUs, unvested restricted stock and warrant.       There is no dilutive effect of the notes nor the related hedge and warrant transactions.      
  • 10. 10       TWITTER, INC. RECONCILIATION OF GAAP REVENUE TO NON-GAAP CONSTANT CURRENCY REVENUE (In millions) (Unaudited)       Three Months Ended Nine Months Ended September 30, September 30, 2015 2014 2015 2014 Revenue and advertising revenue excluding foreign exchange effect: Revenue $ 569 $ 361 $ 1,508 $ 924 Foreign exchange effect on 2015 revenue using 2014 rates 23 61 Revenue excluding foreign exchange effect $ 592 $ 1,569 Revenue year-over-year change percent 58% 63% Revenue excluding foreign exchange effect year-over-year change percent 64% 70% Advertising revenue $ 513 $ 320 $ 1,353 $ 824 Foreign exchange effect on 2015 advertising revenue using 2014 rates 23 61 Advertising revenue excluding foreign exchange effect $ 536 $ 1,414 Advertising revenue year-over-year change percent 60% 64% Advertising revenue excluding foreign exchange effect year-over-year change percent 67% 72%