SlideShare une entreprise Scribd logo
1  sur  22
1. OBJECTIVE
To determine the suspended solid in water sample.
2. INTRODUCTION
The term total suspended solid can be referred to materials which are not dissolved in
water and are non-filterable in nature. It is defined as residue upon evaporation of non-
filterable sample on a filter paper.
3. MATERIAL AND APPARATUS
1. Filter flask.
2. Rubber filter cone.
3. Buchner funnel.
4. Vacuum pump.
5. Silicon vacuum tubing.
6. Grooch crucible.
7. Filter.
8. Cylinder.
9. Oven.
10. Analytical balance.
4. PROCEDURE
1. Place filtration apparatus with weighted filter in flask.
2. Mix sample well and pour into a graduated cylinder to the selected volume.
3. Apply suction to flask and seat filter with a small amount of distilled water.
4. Pour selected volume into filtration apparatus.
5. Draw sample through filter into filter flask.
6. Rinse graduated cylinder into filtration apparatus with three successive 10 ml
portions of distilled water, allowing complete drainage between each rinsing.
7. Continue suction for three minutes after filtration of final rinse is complete.
8. Dry filter in an oven at 103°- 105° for at least 1 hour.
9. Cool filter in desiccator to room temperature.
10. When cool, weigh the filter and support.
5. RESULT AND DISCUSSION
IN
Description Weight (g)
Weight of the clean filter paper (g) W
(B)
0.48 0.48 0.48
Weight of the filter paper and the residue
(g)
W² 101.58 96.72 99.72
Weight of residue (g) W³ 101.10 96.25 99.26
Weight of the filter paper and the
residue-dry (g)
W 101.85 100.02 97.15
Weight of the filter paper (g) W
(A)
0.50 0.51 0.50
Volume of the sample (ml) V 30ml 30ml 30ml
Total suspended solid (mg/L) TSS 666.67 1000 666.67
Average TTS (mg/L) 1888.89
OUT
Description Weight (g)
Weight of the clean filter paper (g) W
(B)
0.48 0.48 0.48
Weight of the filter paper and the residue
(g)
W² 146.24 153.26 146.38
Weight of residue (g) W³ 96.24 104.26 96.38
Weight of the filter paper and the
residue-dry (g)
W 96.68 104.71 96.83
Weight of the filter paper (g) W
(A)
0.50 0.51 0.50
Volume of the sample (ml) V 30ml 30ml 30ml
Total suspended solid (mg/L) TSS 1000 1000 1000
Average TTS (mg/L) 1000
6. CALCULATION
In
𝑇𝑜𝑡𝑎𝑙 𝑠𝑢𝑠𝑝𝑒𝑛𝑑𝑒𝑑 𝑠𝑜𝑙𝑖𝑑 (
𝑚𝑔
𝐿
) , 𝑺𝟏 =
( 𝐴 − 𝐵 ) × 1000
𝑆𝑎𝑚𝑝𝑙𝑒 𝑉𝑜𝑙𝑢𝑚𝑒
=
( 0.50− 0.48 )× 1000
0.03
= 666.67
𝑚𝑔
𝐿
Average TSS =
666.67+1000+666.67
3
= 1888.89 mg/L
Out
𝑇𝑜𝑡𝑎𝑙 𝑠𝑢𝑠𝑝𝑒𝑛𝑑𝑒𝑑 𝑠𝑜𝑙𝑖𝑑 (
𝑚𝑔
𝐿
) , 𝑺𝟏 =
( 𝐴−𝐵 )×1000
𝑆𝑎𝑚𝑝𝑙𝑒 𝑉𝑜𝑙𝑢𝑚𝑒
=
( 0.50− 0.48 )× 1000
0.03
= 1000
𝑚𝑔
𝐿
Average TSS =
1000+ 1000+ 1000
3
= 1000 mg/L
7. DISCUSSION
7.1 Suggest some possible causes of high levels of total suspended solids.
Total suspendedsolids(TSS) include all particlessuspendedinwaterwhichwillnotpass
througha filter.Suspendedsolidsare presentinsanitarywastewaterandmanytypesof
industrial wastewater.There are alsononpointsourcesof suspendedsolids,suchassoil
erosionfromagricultural andconstructionsites.Aslevelsof TSSincrease,awaterbody
beginstolose itsabilitytosupporta diversityof aquaticlife.Suspendedsolidsabsorbheat
fromsunlight,whichincreaseswatertemperature andsubsequentlydecreaseslevelsof
dissolvedoxygen(warmerwaterholdslessoxygenthancoolerwater).Some coldwater
species,suchastrout and stoneflies,are especiallysensitive tochangesindissolvedoxygen.
Photosynthesisalsodecreases,since lesslight penetratesthe water.Aslessoxygenis
producedbyplantsand algae,there isa furtherdropindissolvedoxygenlevels.TSScanalso
destroyfishhabitatbecause suspendedsolidssettletothe bottomandcan eventually
blanketthe riverbed.Suspendedsolidscansmotherthe eggsof fishandaquaticinsects,
and can suffocate newly-hatchedinsectlarvae.Suspendedsolidscanalsoharmfishdirectly
by clogginggills,reducinggrowthrates,andloweringresistance todisease.Changestothe
aquaticenvironmentmayresultinadiminishedfoodsources,andincreaseddifficultiesin
findingfood.Natural movementsandmigrationsof aquaticpopulationsmaybe disrupted.
7.2 What undesirable effects could result from high levels of total suspended
solids?
Total SuspendedSolids(TSS) are solidsinwaterthatcan be trappedby a filter.TSScan
include awide varietyof material,suchassilt,decayingplantandanimal matter,industrial
wastes,andsewage.Highconcentrationsof suspendedsolidscancause manyproblemsfor
streamhealthandaquatic life.
7.3 How are these particles removed in water treatment?
Water purification is the process of removing undesirable chemicals, biological
contaminants, suspended solids and gases from contaminated water. The goal is to
produce water fit for a specific purpose. Most water is disinfected for human
consumption (drinking water), but water purification may also be designed for a
variety of other purposes, including fulfilling the requirements of medical,
pharmacological, chemical and industrial applications. The methods used include
physical processes such as filtration, sedimentation, and distillation; biological
processes such as slow sand filters or biologically active carbon; chemical processes
such as flocculation and chlorination and the use of electromagnetic radiation such as
ultraviolet light.Purifying water may reduce the concentration of particulate matter
including suspended particles, parasites, bacteria, algae, viruses, fungi, as well as
reducing the amount of a range of dissolved and particulate material derived from the
surfaces that come from runoff due to rain.
The standards for drinking water quality are typically set by governments or by
international standards. These standards usually include minimum and maximum
concentrations of contaminants, depending on the intended purpose of water use.
Visual inspection cannot determine if water is of appropriate quality. Simple
procedures such as boiling or the use of a household activated carbon filter are not
sufficient for treating all the possible contaminants that may be present in water from
an unknown source. Even natural spring water – considered safe for all practical
purposes in the 19th century – must now be tested before determining what kind of
treatment, if any, is needed. Chemical and microbiological analysis, while expensive,
are the only way to obtain the information necessary for deciding on the appropriate
method of purification.
8. CONCLUSIONS
Based on the experiment, the average for IN is 1888.89 mg/L which is in class V (
range > 300 ). The uses for this class is none of the above. Meanwhile, the average for
OUT is 1000 mg/L which is in class v ( range > 300 ) and the uses is none of the
above.
BIOCHEMICAL OXYGEN DEMAND (BOD)
1. OBJECTIVE
To determine the suspended solid in water sample
2. INTRODUCTION
In the presence of free oxygen, aerobic bacteria use the organic matter found in
wastewater as “food”. The BOD test is an estimate of the “food” available in the sample.
The more “food” present in the waste, the more Dissolved Oxygen (DO) will be required.
The BOD test measures the strength of the wastewater by measuring the amount of
oxygen used by the bacteria as they stabilize the organic matter under controlled
conditions of time and temperature.
When a measurement is made of all oxygen consuming materials in sample, the
result is termed “Total Biochemical Oxygen Demand” (TBOD), or often just simply
“Biochemical Oxygen Demand” (BOD). Because the test is performed over a five day
period, it is often referred to as a “Five Day BOD”, or a BOD5.
In many biological treatment plants, the facility effluent contains large numbers of
nitrifying organism which are developed during the treatment process. These organism
can exert an oxygen demand as they convert nitrogenous compounds (ammonia and
organic nitrogen) to more stable forms (nitrites and nitrates).
Sometimes it is advantageous to measure just the oxygen demand exerted by
organic (carbonaceous) compounds, excluding the oxygen demand exerted by the
nitrogenous compounds. To accomplish this, the nitrifying organisms can be inhibited
from using oxygen by the addition of a nitrification inhibitor to the samples. The result is
termed “Carbonaceous Biochemical Oxygen Demand”, or CBOD.
The BOD test is used to measure waste loads to treatment plants, determine plant
efficiency (in term of BOD removal), and control plant processes. It is also used to
determine the effect of discharges on receiving waters. A major disadvantage of the BOD
test is the amount of time (5 days) required to obtain the results.
Aerobic: A condition in which “free” or dissolved oxygen is present in an aquatic
environment.
Anaerobic: A condition in which “free” or dissolved oxygen is not present in an aquatic
environment.
Blank: A preliminary in analysis omitting only the sample to provide an unbiased
reference point or baseline for comparison.
Nitrification: An aerobic process in which bacteria change ammonia and organic
nitrogen in wastewater into oxidized nitrogen (usually nitrate). The second-stage BOD is
sometimes referred to as the “nitrification stage”. (The first stage is called the
“carbonaceous stage”.)
Nutrient: Any substance used by living things that promotes growth.
Respiration: The process in which an organism uses oxygen for its life processes and
gives off carbon dioxide.
Seeding: The process of adding live bacteria to a sample.
3. SAFETY AND HYGIENE
When testing for BOD, the concerns for safety involve wastewater hazards and exposure to
chemicals. Precautions to follow include the following:
1. Cover all abrasions and water good quality latex gloves when in direct contact with raw
wastewater.
2. Wash hands frequently, and always wash hands prior to eating or smoking.
3. Clean up all spills of wastewater or buffers immediately.
4. Wear a protective smock, apron, or lab coat, and surgical or rubber gloves when working
in the laboratory to protect clothes and skin.
5. Read all labels carefully and know what to do in case of a spill.
6. Always use a pipette bulb. NEVER pipette anything by mouth.
7. Always pour acids or bases into water, never add water to the acid or base. Mixing
concentrated acids or bases with water can create a significant amount of heat.
8. Use care when handling sharps (broken glass etc.).
4. MATERIAL AND APPARATUS
1. BOD meterwithprobe formeasurementof dissolvedoxygenin300 mL BOD bottles
2. 300 mL BOD bottles
3. Incubator,capable of maintaining20=/- 1°C
4. 250 mL graduatedcylinders
5. 100 mL graduatedcylinders
6. 25 mL measuringpipettes(wide-mouth)
7. 10 mL measuringpipettes(wide-mouth)
8. 100 mL beaker
9. 1000 mL beaker
10. 250 mL Erlenmeyerflask
11. Burette graduatedto0.1 mL
12. Dilutionwaterbottle of suitable
13. Pipette bulb
14. EquipmentforpHmeasurement
15. Magneticstirrerand stirringbars
5. PROCEDURE
1. Completely fill three BOD bottles with dilution water
2. Into additional BOD bottles, partially filled with dilution water, carefully measure out the
proper volume of sample. Add dilution water until the bottles are completely filled.
3. Stopper each bottle taking care to avoid trapping air bubbles inside the bottles as the
bottle stopper are inserted.
4. Fill the top of each bottle neck around the stopper with dilution water.
5. Determine the initial DO content on one of each set of duplicate bottles, including the
dilution water blank by one of the approved methods and record data on the lab sheet.
6. Place the remaining bottles in the incubator at 20°C and incubate for five days.
7. At the end exactly five days(+/-3 hours), testthe DO content of the incubated bottles.
8. Calculate the BOD for each dilution. The most accurate BOD will be obtained from those
dilutions that have a depletion of a least 2mg/L DO and least 1.0 mg/L residual. If three is
more than one dilution that meets these criteria, the BOD results should be averaged to
obtain a final BOD value.
9. The dilution water blanks are used only to check quality of the dilution water. If the
quality of the water is good and free from impurities, the depletion of DO should be less
than 0.2mg/L. In any event, do not use the depletion obtained as a blank correction.
10. If nitrification inhibition is used, the BOD test must also be performed an a series of
sample dilutions which have not been imhibited.
6. RESULT AND DISCUSSION
INFLUENT
Bottle n ( dilution factor ) Initial DO
(mg/L)
Final DO
(mg/L)
Depletion
(mg/L)
1 0.01 0.88 0.78 10
2 0.01 0.88 0.78 10
3 0.01 0.88 0.78 10
AVRG 10
EFFLUENT
Bottle n ( dilution factor ) Initial DO
(mg/L)
Final DO
(mg/L)
Depletion
(mg/L)
1 0.01 0.88 0.78 10
2 0.01 0.88 0.78 10
3 0.01 0.88 0.78 10
AVRG 10
7. CALCULATION
𝐶𝑎𝑙𝑐𝑢𝑙𝑎𝑡𝑒 𝐵𝑂𝐷5 =
𝑖𝑛𝑖𝑡𝑖𝑎𝑙 𝐷𝑂 − 𝐹𝑖𝑛𝑎𝑙 𝐷𝑂
𝑛
𝑛 =
𝑠𝑎𝑚𝑝𝑙𝑒 𝑣𝑜𝑙𝑢𝑚𝑒
𝐵𝑂𝐷 𝑣𝑜𝑙𝑢𝑚𝑒
=
3
300
= 0.01
𝐵𝑂𝐷5 =
10− 10
0.01
= - 990
*Domestic waste dilution 1 :100 – 1 : 500
8. EXERCISE
a. Why must a dilution water blank be included with each series of BOD tests?
 To check the quality of the dilution water.
b. What is the accepted temperature range and time of incubation for the BOD test?
 20 +/- ° C and 5 days
c. What is being measured when nitrification is used in the BOD test?
 Carbonaceous BOD ( CBOD )
d. What are the criteria for most valid resultd of the BOD test
 Use dilutions which deplete at least 0.2mg/L after 5 days and have at least
1.0mg/L
 DO remaining in the dilution.
9. CONCLUSION
While precission is sometimes tough with the BOD test, a check of dilution water quality, seed
effectiveness, and analytical technique can be made using a glucose-glutamic acid solution. A
2% dilution (6 mL BOD bottle) should yield 200 +/-37 mg/L BOD, after five days incubation at
20ºC . To ensure valid result for this “standard” check, the glucose-glutamic acid dilutions must
be seeded since the solution is essentially sterile and does not contain any microorganisms.
The BOD test is a biological test, dependent on the actions of the microorganisms founds in the
waste water and, as such, is subject to a number of variations. These variations can be caused by
a number of factors, including changes in temperature, weather, composition of incoming
sewage, in-plant operations, and sampling points. Result can vary widely from day to day , or
even hour to hour. One of the major disadvantages of the BOD test is the time lag between the
collection of samples and the final calculation of results. This makes the BOD test a poor test for
determining whether or not operational changes are needed.
In addition, the rate and degree that organic matter in waste water is decomposed (or oxidizer )
by the normal bacteria present in a sample is largely dependent on the characteristics of the
organic metter . For example, some organic matter (like sugars or starches) are oxidized very
easily and rapidly, and will almost always resul in measurable ‘BOD’. Other organic metter,
however, is sometimes resistant to biological oxidation, and may require special “acclimated”
bacteria to oxidize the material and to show a “BOD”. Although this is what actually happens in
nature , it causes significant variation in “BOD” result from sample to sample.
Some common ranges of BOD results are as follows, in mg/L :
Influent 150-400
Primary 60-160
Secondary Effluent 10-60
Digester Supernant 1000-4000+
Industrial Wastes 100-3000+
Determine Suspended Solids and BOD Levels

Contenu connexe

Tendances

determination of flakiness index test.
determination of flakiness index test. determination of flakiness index test.
determination of flakiness index test. YASMINE HASLAN
 
Proktor compaction
Proktor compactionProktor compaction
Proktor compactionNatalie Ulza
 
Softening point of bitumious
Softening point of bitumiousSoftening point of bitumious
Softening point of bitumiousTaha Samir
 
DCC3113 DETERMINATION OF AGGREGATE IMPACT VALUE.
DCC3113 DETERMINATION OF AGGREGATE IMPACT VALUE.DCC3113 DETERMINATION OF AGGREGATE IMPACT VALUE.
DCC3113 DETERMINATION OF AGGREGATE IMPACT VALUE.YASMINE HASLAN
 
Penetration Test for Bitumen
Penetration Test for BitumenPenetration Test for Bitumen
Penetration Test for BitumenShweta Sagar
 
Lab5 determination of hardness of water
Lab5 determination of hardness of waterLab5 determination of hardness of water
Lab5 determination of hardness of waterAnas Maghayreh
 
Determination of elongation index
Determination of elongation indexDetermination of elongation index
Determination of elongation indexYASMINE HASLAN
 
Biochemical Oxygen Demand (BOD)
Biochemical Oxygen Demand (BOD)Biochemical Oxygen Demand (BOD)
Biochemical Oxygen Demand (BOD)pratik kulkarni
 
Lec 4 solids environment
Lec 4 solids environmentLec 4 solids environment
Lec 4 solids environmentMalika khalil
 
Density, (relative density) specific gravity & absorption of coarse aggre...
Density, (relative density) specific gravity & absorption of coarse aggre...Density, (relative density) specific gravity & absorption of coarse aggre...
Density, (relative density) specific gravity & absorption of coarse aggre...Muhammad Saleem
 
Sieve analysis of coarse and fine aggregate - Report
Sieve analysis of coarse and fine aggregate - ReportSieve analysis of coarse and fine aggregate - Report
Sieve analysis of coarse and fine aggregate - ReportSarchia Khursheed
 

Tendances (20)

EPC - Lab Report One
EPC - Lab Report OneEPC - Lab Report One
EPC - Lab Report One
 
determination of flakiness index test.
determination of flakiness index test. determination of flakiness index test.
determination of flakiness index test.
 
Proktor compaction
Proktor compactionProktor compaction
Proktor compaction
 
Probe machintosh
Probe machintoshProbe machintosh
Probe machintosh
 
Softening point of bitumious
Softening point of bitumiousSoftening point of bitumious
Softening point of bitumious
 
DCC3113 DETERMINATION OF AGGREGATE IMPACT VALUE.
DCC3113 DETERMINATION OF AGGREGATE IMPACT VALUE.DCC3113 DETERMINATION OF AGGREGATE IMPACT VALUE.
DCC3113 DETERMINATION OF AGGREGATE IMPACT VALUE.
 
Penetration Test for Bitumen
Penetration Test for BitumenPenetration Test for Bitumen
Penetration Test for Bitumen
 
Jkr Probe Test
Jkr Probe TestJkr Probe Test
Jkr Probe Test
 
Lab5 determination of hardness of water
Lab5 determination of hardness of waterLab5 determination of hardness of water
Lab5 determination of hardness of water
 
Determination of elongation index
Determination of elongation indexDetermination of elongation index
Determination of elongation index
 
Biochemical Oxygen Demand (BOD)
Biochemical Oxygen Demand (BOD)Biochemical Oxygen Demand (BOD)
Biochemical Oxygen Demand (BOD)
 
Understanding sieve analysis of sand
Understanding sieve analysis of sand Understanding sieve analysis of sand
Understanding sieve analysis of sand
 
Lec 4 solids environment
Lec 4 solids environmentLec 4 solids environment
Lec 4 solids environment
 
Density, (relative density) specific gravity & absorption of coarse aggre...
Density, (relative density) specific gravity & absorption of coarse aggre...Density, (relative density) specific gravity & absorption of coarse aggre...
Density, (relative density) specific gravity & absorption of coarse aggre...
 
Sieve analysis of coarse and fine aggregate - Report
Sieve analysis of coarse and fine aggregate - ReportSieve analysis of coarse and fine aggregate - Report
Sieve analysis of coarse and fine aggregate - Report
 
Exp 4
Exp  4Exp  4
Exp 4
 
Sand replacement
Sand replacementSand replacement
Sand replacement
 
Cube test report
Cube test reportCube test report
Cube test report
 
Sieve test
Sieve testSieve test
Sieve test
 
L 17 coagulation and flocculation
L 17 coagulation and flocculationL 17 coagulation and flocculation
L 17 coagulation and flocculation
 

Similaire à Determine Suspended Solids and BOD Levels

Industrial waste water purification procedure
Industrial waste water purification procedureIndustrial waste water purification procedure
Industrial waste water purification procedurepasindulaksara1
 
Exp. 4 & 5 COD and BOD..pptx
Exp. 4 & 5 COD and BOD..pptxExp. 4 & 5 COD and BOD..pptx
Exp. 4 & 5 COD and BOD..pptxssuserb2c0be
 
Biochemical oxygen demand
Biochemical oxygen demandBiochemical oxygen demand
Biochemical oxygen demandutpal sharma
 
Chapter one and two, Intoduction and Wastewater characteristics.PPt.pptx
Chapter one and two, Intoduction and Wastewater characteristics.PPt.pptxChapter one and two, Intoduction and Wastewater characteristics.PPt.pptx
Chapter one and two, Intoduction and Wastewater characteristics.PPt.pptxManamnoBeza1
 
Determination+of+solids
Determination+of+solidsDetermination+of+solids
Determination+of+solidsMohammadDashen
 
ce_332 Environmental Engineering- Lab I.pdf
ce_332 Environmental Engineering- Lab I.pdfce_332 Environmental Engineering- Lab I.pdf
ce_332 Environmental Engineering- Lab I.pdfAli Al-naqa
 
207960699 ee-lab-manual
207960699 ee-lab-manual207960699 ee-lab-manual
207960699 ee-lab-manualhomeworkping8
 
0.0 EXPERIMENT ON DETERMINATION OF DISSOLVED OXYGEN
0.0 EXPERIMENT ON DETERMINATION OF DISSOLVED OXYGEN0.0 EXPERIMENT ON DETERMINATION OF DISSOLVED OXYGEN
0.0 EXPERIMENT ON DETERMINATION OF DISSOLVED OXYGENTye Rausch
 
Treatment of distilleries and breweries spent wash wastewater
Treatment of distilleries and breweries spent wash wastewaterTreatment of distilleries and breweries spent wash wastewater
Treatment of distilleries and breweries spent wash wastewatereSAT Publishing House
 
Treatment of distilleries and breweries spent wash wastewater
Treatment of distilleries and breweries spent wash wastewaterTreatment of distilleries and breweries spent wash wastewater
Treatment of distilleries and breweries spent wash wastewatereSAT Publishing House
 
Treatment of distilleries and breweries spent wash wastewater
Treatment of distilleries and breweries spent wash wastewaterTreatment of distilleries and breweries spent wash wastewater
Treatment of distilleries and breweries spent wash wastewatereSAT Journals
 
lecture on characterization 2015
lecture on characterization 2015lecture on characterization 2015
lecture on characterization 2015Manish Goyal
 
pharmaceutical waste treatment and disposal procedure
pharmaceutical waste treatment and disposal procedurepharmaceutical waste treatment and disposal procedure
pharmaceutical waste treatment and disposal proceduremaria grace
 

Similaire à Determine Suspended Solids and BOD Levels (20)

Waste_Water_testing[1].pdf
Waste_Water_testing[1].pdfWaste_Water_testing[1].pdf
Waste_Water_testing[1].pdf
 
Bio componets proposalc14123361t
Bio componets proposalc14123361tBio componets proposalc14123361t
Bio componets proposalc14123361t
 
Industrial waste water purification procedure
Industrial waste water purification procedureIndustrial waste water purification procedure
Industrial waste water purification procedure
 
Exp. 4 & 5 COD and BOD..pptx
Exp. 4 & 5 COD and BOD..pptxExp. 4 & 5 COD and BOD..pptx
Exp. 4 & 5 COD and BOD..pptx
 
Biochemical oxygen demand
Biochemical oxygen demandBiochemical oxygen demand
Biochemical oxygen demand
 
Chapter one and two, Intoduction and Wastewater characteristics.PPt.pptx
Chapter one and two, Intoduction and Wastewater characteristics.PPt.pptxChapter one and two, Intoduction and Wastewater characteristics.PPt.pptx
Chapter one and two, Intoduction and Wastewater characteristics.PPt.pptx
 
Determination+of+solids
Determination+of+solidsDetermination+of+solids
Determination+of+solids
 
BIOLOGICAL_ETP.pptx
BIOLOGICAL_ETP.pptxBIOLOGICAL_ETP.pptx
BIOLOGICAL_ETP.pptx
 
ce_332 Environmental Engineering- Lab I.pdf
ce_332 Environmental Engineering- Lab I.pdfce_332 Environmental Engineering- Lab I.pdf
ce_332 Environmental Engineering- Lab I.pdf
 
207960699 ee-lab-manual
207960699 ee-lab-manual207960699 ee-lab-manual
207960699 ee-lab-manual
 
0.0 EXPERIMENT ON DETERMINATION OF DISSOLVED OXYGEN
0.0 EXPERIMENT ON DETERMINATION OF DISSOLVED OXYGEN0.0 EXPERIMENT ON DETERMINATION OF DISSOLVED OXYGEN
0.0 EXPERIMENT ON DETERMINATION OF DISSOLVED OXYGEN
 
Treatment of distilleries and breweries spent wash wastewater
Treatment of distilleries and breweries spent wash wastewaterTreatment of distilleries and breweries spent wash wastewater
Treatment of distilleries and breweries spent wash wastewater
 
Treatment of distilleries and breweries spent wash wastewater
Treatment of distilleries and breweries spent wash wastewaterTreatment of distilleries and breweries spent wash wastewater
Treatment of distilleries and breweries spent wash wastewater
 
Treatment of distilleries and breweries spent wash wastewater
Treatment of distilleries and breweries spent wash wastewaterTreatment of distilleries and breweries spent wash wastewater
Treatment of distilleries and breweries spent wash wastewater
 
PH, COD AND TSS
PH, COD AND TSSPH, COD AND TSS
PH, COD AND TSS
 
lecture on characterization 2015
lecture on characterization 2015lecture on characterization 2015
lecture on characterization 2015
 
pharmaceutical waste treatment and disposal procedure
pharmaceutical waste treatment and disposal procedurepharmaceutical waste treatment and disposal procedure
pharmaceutical waste treatment and disposal procedure
 
Drinking water
Drinking waterDrinking water
Drinking water
 
Exp 7
Exp 7Exp 7
Exp 7
 
Water recycling
Water recyclingWater recycling
Water recycling
 

Plus de YASMINE HASLAN

lab report structure continuous beam
lab report structure continuous beamlab report structure continuous beam
lab report structure continuous beamYASMINE HASLAN
 
lab report structure deflection of cantilever
lab report structure deflection of cantileverlab report structure deflection of cantilever
lab report structure deflection of cantileverYASMINE HASLAN
 
LAB REPORT SHEAR FORCE IN A BEAM
LAB REPORT SHEAR FORCE IN A BEAMLAB REPORT SHEAR FORCE IN A BEAM
LAB REPORT SHEAR FORCE IN A BEAMYASMINE HASLAN
 
PAST YEAR DCC5183; project management and practices DISEMBER2015
PAST YEAR DCC5183; project management and practices DISEMBER2015PAST YEAR DCC5183; project management and practices DISEMBER2015
PAST YEAR DCC5183; project management and practices DISEMBER2015YASMINE HASLAN
 
PRESENTATION MINI PROJECT STATISTIC SEMESTER 3 POLITEKNIK
PRESENTATION MINI PROJECT STATISTIC SEMESTER 3 POLITEKNIK PRESENTATION MINI PROJECT STATISTIC SEMESTER 3 POLITEKNIK
PRESENTATION MINI PROJECT STATISTIC SEMESTER 3 POLITEKNIK YASMINE HASLAN
 
MINI PROJECT STATISTIC SEMESTER 3 POLITEKNIK
MINI PROJECT STATISTIC SEMESTER 3 POLITEKNIKMINI PROJECT STATISTIC SEMESTER 3 POLITEKNIK
MINI PROJECT STATISTIC SEMESTER 3 POLITEKNIKYASMINE HASLAN
 
engineering survey 1 report levelling
engineering survey 1 report levellingengineering survey 1 report levelling
engineering survey 1 report levellingYASMINE HASLAN
 
SLUMP TEST REPORT DCC 2042
SLUMP TEST REPORT DCC 2042 SLUMP TEST REPORT DCC 2042
SLUMP TEST REPORT DCC 2042 YASMINE HASLAN
 
Softhening point REPORT DCC2042
Softhening point REPORT DCC2042 Softhening point REPORT DCC2042
Softhening point REPORT DCC2042 YASMINE HASLAN
 
Soalan peperiksaan akhir jun 2015
Soalan peperiksaan akhir jun 2015Soalan peperiksaan akhir jun 2015
Soalan peperiksaan akhir jun 2015YASMINE HASLAN
 
Soalan peperiksaan akhir politeknik dbm1013 dis 2015
Soalan peperiksaan akhir  politeknik dbm1013  dis 2015Soalan peperiksaan akhir  politeknik dbm1013  dis 2015
Soalan peperiksaan akhir politeknik dbm1013 dis 2015YASMINE HASLAN
 
Peperiksaan akhir dis2014 dbm1013
Peperiksaan akhir dis2014 dbm1013Peperiksaan akhir dis2014 dbm1013
Peperiksaan akhir dis2014 dbm1013YASMINE HASLAN
 
Carpentry labsheet polimas
Carpentry labsheet  polimasCarpentry labsheet  polimas
Carpentry labsheet polimasYASMINE HASLAN
 
Garden chair cutting list
Garden chair  cutting listGarden chair  cutting list
Garden chair cutting listYASMINE HASLAN
 
Cause of accident and prevention in construction industry
Cause of accident and prevention in construction industryCause of accident and prevention in construction industry
Cause of accident and prevention in construction industryYASMINE HASLAN
 
past year politeknik Pengajian malaysia jun 2016
past year politeknik Pengajian malaysia jun 2016past year politeknik Pengajian malaysia jun 2016
past year politeknik Pengajian malaysia jun 2016YASMINE HASLAN
 
E folio pengajian malaysia- tun abdul razak
E folio pengajian malaysia- tun abdul razakE folio pengajian malaysia- tun abdul razak
E folio pengajian malaysia- tun abdul razakYASMINE HASLAN
 

Plus de YASMINE HASLAN (20)

lab report structure continuous beam
lab report structure continuous beamlab report structure continuous beam
lab report structure continuous beam
 
lab report structure deflection of cantilever
lab report structure deflection of cantileverlab report structure deflection of cantilever
lab report structure deflection of cantilever
 
LAB REPORT SHEAR FORCE IN A BEAM
LAB REPORT SHEAR FORCE IN A BEAMLAB REPORT SHEAR FORCE IN A BEAM
LAB REPORT SHEAR FORCE IN A BEAM
 
PAST YEAR DCC5183; project management and practices DISEMBER2015
PAST YEAR DCC5183; project management and practices DISEMBER2015PAST YEAR DCC5183; project management and practices DISEMBER2015
PAST YEAR DCC5183; project management and practices DISEMBER2015
 
PRESENTATION MINI PROJECT STATISTIC SEMESTER 3 POLITEKNIK
PRESENTATION MINI PROJECT STATISTIC SEMESTER 3 POLITEKNIK PRESENTATION MINI PROJECT STATISTIC SEMESTER 3 POLITEKNIK
PRESENTATION MINI PROJECT STATISTIC SEMESTER 3 POLITEKNIK
 
MINI PROJECT STATISTIC SEMESTER 3 POLITEKNIK
MINI PROJECT STATISTIC SEMESTER 3 POLITEKNIKMINI PROJECT STATISTIC SEMESTER 3 POLITEKNIK
MINI PROJECT STATISTIC SEMESTER 3 POLITEKNIK
 
Silt test
Silt testSilt test
Silt test
 
engineering survey 1 report levelling
engineering survey 1 report levellingengineering survey 1 report levelling
engineering survey 1 report levelling
 
SLUMP TEST REPORT DCC 2042
SLUMP TEST REPORT DCC 2042 SLUMP TEST REPORT DCC 2042
SLUMP TEST REPORT DCC 2042
 
Softhening point REPORT DCC2042
Softhening point REPORT DCC2042 Softhening point REPORT DCC2042
Softhening point REPORT DCC2042
 
Soalan peperiksaan akhir jun 2015
Soalan peperiksaan akhir jun 2015Soalan peperiksaan akhir jun 2015
Soalan peperiksaan akhir jun 2015
 
Soalan peperiksaan akhir politeknik dbm1013 dis 2015
Soalan peperiksaan akhir  politeknik dbm1013  dis 2015Soalan peperiksaan akhir  politeknik dbm1013  dis 2015
Soalan peperiksaan akhir politeknik dbm1013 dis 2015
 
Peperiksaan akhir dis2014 dbm1013
Peperiksaan akhir dis2014 dbm1013Peperiksaan akhir dis2014 dbm1013
Peperiksaan akhir dis2014 dbm1013
 
Report kayu
Report kayuReport kayu
Report kayu
 
Carpentry labsheet polimas
Carpentry labsheet  polimasCarpentry labsheet  polimas
Carpentry labsheet polimas
 
Lukisan bangunan
Lukisan bangunanLukisan bangunan
Lukisan bangunan
 
Garden chair cutting list
Garden chair  cutting listGarden chair  cutting list
Garden chair cutting list
 
Cause of accident and prevention in construction industry
Cause of accident and prevention in construction industryCause of accident and prevention in construction industry
Cause of accident and prevention in construction industry
 
past year politeknik Pengajian malaysia jun 2016
past year politeknik Pengajian malaysia jun 2016past year politeknik Pengajian malaysia jun 2016
past year politeknik Pengajian malaysia jun 2016
 
E folio pengajian malaysia- tun abdul razak
E folio pengajian malaysia- tun abdul razakE folio pengajian malaysia- tun abdul razak
E folio pengajian malaysia- tun abdul razak
 

Dernier

POINT- BIOCHEMISTRY SEM 2 ENZYMES UNIT 5.pptx
POINT- BIOCHEMISTRY SEM 2 ENZYMES UNIT 5.pptxPOINT- BIOCHEMISTRY SEM 2 ENZYMES UNIT 5.pptx
POINT- BIOCHEMISTRY SEM 2 ENZYMES UNIT 5.pptxSayali Powar
 
Kisan Call Centre - To harness potential of ICT in Agriculture by answer farm...
Kisan Call Centre - To harness potential of ICT in Agriculture by answer farm...Kisan Call Centre - To harness potential of ICT in Agriculture by answer farm...
Kisan Call Centre - To harness potential of ICT in Agriculture by answer farm...Krashi Coaching
 
Activity 01 - Artificial Culture (1).pdf
Activity 01 - Artificial Culture (1).pdfActivity 01 - Artificial Culture (1).pdf
Activity 01 - Artificial Culture (1).pdfciinovamais
 
Sports & Fitness Value Added Course FY..
Sports & Fitness Value Added Course FY..Sports & Fitness Value Added Course FY..
Sports & Fitness Value Added Course FY..Disha Kariya
 
Student login on Anyboli platform.helpin
Student login on Anyboli platform.helpinStudent login on Anyboli platform.helpin
Student login on Anyboli platform.helpinRaunakKeshri1
 
CARE OF CHILD IN INCUBATOR..........pptx
CARE OF CHILD IN INCUBATOR..........pptxCARE OF CHILD IN INCUBATOR..........pptx
CARE OF CHILD IN INCUBATOR..........pptxGaneshChakor2
 
1029-Danh muc Sach Giao Khoa khoi 6.pdf
1029-Danh muc Sach Giao Khoa khoi  6.pdf1029-Danh muc Sach Giao Khoa khoi  6.pdf
1029-Danh muc Sach Giao Khoa khoi 6.pdfQucHHunhnh
 
Measures of Dispersion and Variability: Range, QD, AD and SD
Measures of Dispersion and Variability: Range, QD, AD and SDMeasures of Dispersion and Variability: Range, QD, AD and SD
Measures of Dispersion and Variability: Range, QD, AD and SDThiyagu K
 
Mastering the Unannounced Regulatory Inspection
Mastering the Unannounced Regulatory InspectionMastering the Unannounced Regulatory Inspection
Mastering the Unannounced Regulatory InspectionSafetyChain Software
 
Advanced Views - Calendar View in Odoo 17
Advanced Views - Calendar View in Odoo 17Advanced Views - Calendar View in Odoo 17
Advanced Views - Calendar View in Odoo 17Celine George
 
Presentation by Andreas Schleicher Tackling the School Absenteeism Crisis 30 ...
Presentation by Andreas Schleicher Tackling the School Absenteeism Crisis 30 ...Presentation by Andreas Schleicher Tackling the School Absenteeism Crisis 30 ...
Presentation by Andreas Schleicher Tackling the School Absenteeism Crisis 30 ...EduSkills OECD
 
Beyond the EU: DORA and NIS 2 Directive's Global Impact
Beyond the EU: DORA and NIS 2 Directive's Global ImpactBeyond the EU: DORA and NIS 2 Directive's Global Impact
Beyond the EU: DORA and NIS 2 Directive's Global ImpactPECB
 
Call Girls in Dwarka Mor Delhi Contact Us 9654467111
Call Girls in Dwarka Mor Delhi Contact Us 9654467111Call Girls in Dwarka Mor Delhi Contact Us 9654467111
Call Girls in Dwarka Mor Delhi Contact Us 9654467111Sapana Sha
 
SOCIAL AND HISTORICAL CONTEXT - LFTVD.pptx
SOCIAL AND HISTORICAL CONTEXT - LFTVD.pptxSOCIAL AND HISTORICAL CONTEXT - LFTVD.pptx
SOCIAL AND HISTORICAL CONTEXT - LFTVD.pptxiammrhaywood
 
The basics of sentences session 2pptx copy.pptx
The basics of sentences session 2pptx copy.pptxThe basics of sentences session 2pptx copy.pptx
The basics of sentences session 2pptx copy.pptxheathfieldcps1
 
Interactive Powerpoint_How to Master effective communication
Interactive Powerpoint_How to Master effective communicationInteractive Powerpoint_How to Master effective communication
Interactive Powerpoint_How to Master effective communicationnomboosow
 
Measures of Central Tendency: Mean, Median and Mode
Measures of Central Tendency: Mean, Median and ModeMeasures of Central Tendency: Mean, Median and Mode
Measures of Central Tendency: Mean, Median and ModeThiyagu K
 
Disha NEET Physics Guide for classes 11 and 12.pdf
Disha NEET Physics Guide for classes 11 and 12.pdfDisha NEET Physics Guide for classes 11 and 12.pdf
Disha NEET Physics Guide for classes 11 and 12.pdfchloefrazer622
 

Dernier (20)

POINT- BIOCHEMISTRY SEM 2 ENZYMES UNIT 5.pptx
POINT- BIOCHEMISTRY SEM 2 ENZYMES UNIT 5.pptxPOINT- BIOCHEMISTRY SEM 2 ENZYMES UNIT 5.pptx
POINT- BIOCHEMISTRY SEM 2 ENZYMES UNIT 5.pptx
 
Kisan Call Centre - To harness potential of ICT in Agriculture by answer farm...
Kisan Call Centre - To harness potential of ICT in Agriculture by answer farm...Kisan Call Centre - To harness potential of ICT in Agriculture by answer farm...
Kisan Call Centre - To harness potential of ICT in Agriculture by answer farm...
 
Activity 01 - Artificial Culture (1).pdf
Activity 01 - Artificial Culture (1).pdfActivity 01 - Artificial Culture (1).pdf
Activity 01 - Artificial Culture (1).pdf
 
Sports & Fitness Value Added Course FY..
Sports & Fitness Value Added Course FY..Sports & Fitness Value Added Course FY..
Sports & Fitness Value Added Course FY..
 
Student login on Anyboli platform.helpin
Student login on Anyboli platform.helpinStudent login on Anyboli platform.helpin
Student login on Anyboli platform.helpin
 
CARE OF CHILD IN INCUBATOR..........pptx
CARE OF CHILD IN INCUBATOR..........pptxCARE OF CHILD IN INCUBATOR..........pptx
CARE OF CHILD IN INCUBATOR..........pptx
 
1029-Danh muc Sach Giao Khoa khoi 6.pdf
1029-Danh muc Sach Giao Khoa khoi  6.pdf1029-Danh muc Sach Giao Khoa khoi  6.pdf
1029-Danh muc Sach Giao Khoa khoi 6.pdf
 
Measures of Dispersion and Variability: Range, QD, AD and SD
Measures of Dispersion and Variability: Range, QD, AD and SDMeasures of Dispersion and Variability: Range, QD, AD and SD
Measures of Dispersion and Variability: Range, QD, AD and SD
 
Mastering the Unannounced Regulatory Inspection
Mastering the Unannounced Regulatory InspectionMastering the Unannounced Regulatory Inspection
Mastering the Unannounced Regulatory Inspection
 
Código Creativo y Arte de Software | Unidad 1
Código Creativo y Arte de Software | Unidad 1Código Creativo y Arte de Software | Unidad 1
Código Creativo y Arte de Software | Unidad 1
 
Advanced Views - Calendar View in Odoo 17
Advanced Views - Calendar View in Odoo 17Advanced Views - Calendar View in Odoo 17
Advanced Views - Calendar View in Odoo 17
 
Presentation by Andreas Schleicher Tackling the School Absenteeism Crisis 30 ...
Presentation by Andreas Schleicher Tackling the School Absenteeism Crisis 30 ...Presentation by Andreas Schleicher Tackling the School Absenteeism Crisis 30 ...
Presentation by Andreas Schleicher Tackling the School Absenteeism Crisis 30 ...
 
Beyond the EU: DORA and NIS 2 Directive's Global Impact
Beyond the EU: DORA and NIS 2 Directive's Global ImpactBeyond the EU: DORA and NIS 2 Directive's Global Impact
Beyond the EU: DORA and NIS 2 Directive's Global Impact
 
Call Girls in Dwarka Mor Delhi Contact Us 9654467111
Call Girls in Dwarka Mor Delhi Contact Us 9654467111Call Girls in Dwarka Mor Delhi Contact Us 9654467111
Call Girls in Dwarka Mor Delhi Contact Us 9654467111
 
SOCIAL AND HISTORICAL CONTEXT - LFTVD.pptx
SOCIAL AND HISTORICAL CONTEXT - LFTVD.pptxSOCIAL AND HISTORICAL CONTEXT - LFTVD.pptx
SOCIAL AND HISTORICAL CONTEXT - LFTVD.pptx
 
The basics of sentences session 2pptx copy.pptx
The basics of sentences session 2pptx copy.pptxThe basics of sentences session 2pptx copy.pptx
The basics of sentences session 2pptx copy.pptx
 
Interactive Powerpoint_How to Master effective communication
Interactive Powerpoint_How to Master effective communicationInteractive Powerpoint_How to Master effective communication
Interactive Powerpoint_How to Master effective communication
 
Measures of Central Tendency: Mean, Median and Mode
Measures of Central Tendency: Mean, Median and ModeMeasures of Central Tendency: Mean, Median and Mode
Measures of Central Tendency: Mean, Median and Mode
 
Disha NEET Physics Guide for classes 11 and 12.pdf
Disha NEET Physics Guide for classes 11 and 12.pdfDisha NEET Physics Guide for classes 11 and 12.pdf
Disha NEET Physics Guide for classes 11 and 12.pdf
 
Advance Mobile Application Development class 07
Advance Mobile Application Development class 07Advance Mobile Application Development class 07
Advance Mobile Application Development class 07
 

Determine Suspended Solids and BOD Levels

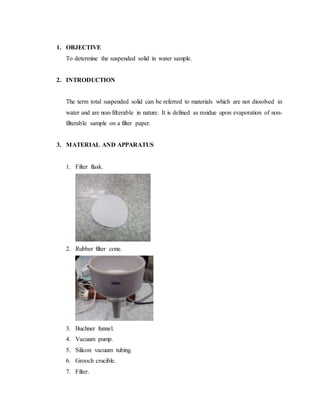
  • 1. 1. OBJECTIVE To determine the suspended solid in water sample. 2. INTRODUCTION The term total suspended solid can be referred to materials which are not dissolved in water and are non-filterable in nature. It is defined as residue upon evaporation of non- filterable sample on a filter paper. 3. MATERIAL AND APPARATUS 1. Filter flask. 2. Rubber filter cone. 3. Buchner funnel. 4. Vacuum pump. 5. Silicon vacuum tubing. 6. Grooch crucible. 7. Filter.
  • 2. 8. Cylinder. 9. Oven. 10. Analytical balance.
  • 3. 4. PROCEDURE 1. Place filtration apparatus with weighted filter in flask. 2. Mix sample well and pour into a graduated cylinder to the selected volume. 3. Apply suction to flask and seat filter with a small amount of distilled water.
  • 4. 4. Pour selected volume into filtration apparatus. 5. Draw sample through filter into filter flask. 6. Rinse graduated cylinder into filtration apparatus with three successive 10 ml portions of distilled water, allowing complete drainage between each rinsing. 7. Continue suction for three minutes after filtration of final rinse is complete. 8. Dry filter in an oven at 103°- 105° for at least 1 hour. 9. Cool filter in desiccator to room temperature. 10. When cool, weigh the filter and support.
  • 5. 5. RESULT AND DISCUSSION IN Description Weight (g) Weight of the clean filter paper (g) W (B) 0.48 0.48 0.48 Weight of the filter paper and the residue (g) W² 101.58 96.72 99.72 Weight of residue (g) W³ 101.10 96.25 99.26 Weight of the filter paper and the residue-dry (g) W 101.85 100.02 97.15 Weight of the filter paper (g) W (A) 0.50 0.51 0.50 Volume of the sample (ml) V 30ml 30ml 30ml Total suspended solid (mg/L) TSS 666.67 1000 666.67 Average TTS (mg/L) 1888.89 OUT Description Weight (g) Weight of the clean filter paper (g) W (B) 0.48 0.48 0.48 Weight of the filter paper and the residue (g) W² 146.24 153.26 146.38
  • 6. Weight of residue (g) W³ 96.24 104.26 96.38 Weight of the filter paper and the residue-dry (g) W 96.68 104.71 96.83 Weight of the filter paper (g) W (A) 0.50 0.51 0.50 Volume of the sample (ml) V 30ml 30ml 30ml Total suspended solid (mg/L) TSS 1000 1000 1000 Average TTS (mg/L) 1000 6. CALCULATION In 𝑇𝑜𝑡𝑎𝑙 𝑠𝑢𝑠𝑝𝑒𝑛𝑑𝑒𝑑 𝑠𝑜𝑙𝑖𝑑 ( 𝑚𝑔 𝐿 ) , 𝑺𝟏 = ( 𝐴 − 𝐵 ) × 1000 𝑆𝑎𝑚𝑝𝑙𝑒 𝑉𝑜𝑙𝑢𝑚𝑒 = ( 0.50− 0.48 )× 1000 0.03 = 666.67 𝑚𝑔 𝐿 Average TSS = 666.67+1000+666.67 3 = 1888.89 mg/L Out 𝑇𝑜𝑡𝑎𝑙 𝑠𝑢𝑠𝑝𝑒𝑛𝑑𝑒𝑑 𝑠𝑜𝑙𝑖𝑑 ( 𝑚𝑔 𝐿 ) , 𝑺𝟏 = ( 𝐴−𝐵 )×1000 𝑆𝑎𝑚𝑝𝑙𝑒 𝑉𝑜𝑙𝑢𝑚𝑒 = ( 0.50− 0.48 )× 1000 0.03
  • 7. = 1000 𝑚𝑔 𝐿 Average TSS = 1000+ 1000+ 1000 3 = 1000 mg/L 7. DISCUSSION 7.1 Suggest some possible causes of high levels of total suspended solids. Total suspendedsolids(TSS) include all particlessuspendedinwaterwhichwillnotpass througha filter.Suspendedsolidsare presentinsanitarywastewaterandmanytypesof industrial wastewater.There are alsononpointsourcesof suspendedsolids,suchassoil erosionfromagricultural andconstructionsites.Aslevelsof TSSincrease,awaterbody beginstolose itsabilitytosupporta diversityof aquaticlife.Suspendedsolidsabsorbheat fromsunlight,whichincreaseswatertemperature andsubsequentlydecreaseslevelsof dissolvedoxygen(warmerwaterholdslessoxygenthancoolerwater).Some coldwater species,suchastrout and stoneflies,are especiallysensitive tochangesindissolvedoxygen. Photosynthesisalsodecreases,since lesslight penetratesthe water.Aslessoxygenis producedbyplantsand algae,there isa furtherdropindissolvedoxygenlevels.TSScanalso destroyfishhabitatbecause suspendedsolidssettletothe bottomandcan eventually blanketthe riverbed.Suspendedsolidscansmotherthe eggsof fishandaquaticinsects, and can suffocate newly-hatchedinsectlarvae.Suspendedsolidscanalsoharmfishdirectly by clogginggills,reducinggrowthrates,andloweringresistance todisease.Changestothe aquaticenvironmentmayresultinadiminishedfoodsources,andincreaseddifficultiesin findingfood.Natural movementsandmigrationsof aquaticpopulationsmaybe disrupted. 7.2 What undesirable effects could result from high levels of total suspended solids?
  • 8. Total SuspendedSolids(TSS) are solidsinwaterthatcan be trappedby a filter.TSScan include awide varietyof material,suchassilt,decayingplantandanimal matter,industrial wastes,andsewage.Highconcentrationsof suspendedsolidscancause manyproblemsfor streamhealthandaquatic life. 7.3 How are these particles removed in water treatment? Water purification is the process of removing undesirable chemicals, biological contaminants, suspended solids and gases from contaminated water. The goal is to produce water fit for a specific purpose. Most water is disinfected for human consumption (drinking water), but water purification may also be designed for a variety of other purposes, including fulfilling the requirements of medical, pharmacological, chemical and industrial applications. The methods used include physical processes such as filtration, sedimentation, and distillation; biological processes such as slow sand filters or biologically active carbon; chemical processes such as flocculation and chlorination and the use of electromagnetic radiation such as ultraviolet light.Purifying water may reduce the concentration of particulate matter including suspended particles, parasites, bacteria, algae, viruses, fungi, as well as reducing the amount of a range of dissolved and particulate material derived from the surfaces that come from runoff due to rain. The standards for drinking water quality are typically set by governments or by international standards. These standards usually include minimum and maximum concentrations of contaminants, depending on the intended purpose of water use. Visual inspection cannot determine if water is of appropriate quality. Simple procedures such as boiling or the use of a household activated carbon filter are not sufficient for treating all the possible contaminants that may be present in water from an unknown source. Even natural spring water – considered safe for all practical purposes in the 19th century – must now be tested before determining what kind of treatment, if any, is needed. Chemical and microbiological analysis, while expensive,
  • 9. are the only way to obtain the information necessary for deciding on the appropriate method of purification.
  • 10. 8. CONCLUSIONS Based on the experiment, the average for IN is 1888.89 mg/L which is in class V ( range > 300 ). The uses for this class is none of the above. Meanwhile, the average for OUT is 1000 mg/L which is in class v ( range > 300 ) and the uses is none of the above.
  • 11. BIOCHEMICAL OXYGEN DEMAND (BOD) 1. OBJECTIVE To determine the suspended solid in water sample 2. INTRODUCTION In the presence of free oxygen, aerobic bacteria use the organic matter found in wastewater as “food”. The BOD test is an estimate of the “food” available in the sample. The more “food” present in the waste, the more Dissolved Oxygen (DO) will be required. The BOD test measures the strength of the wastewater by measuring the amount of oxygen used by the bacteria as they stabilize the organic matter under controlled conditions of time and temperature. When a measurement is made of all oxygen consuming materials in sample, the result is termed “Total Biochemical Oxygen Demand” (TBOD), or often just simply “Biochemical Oxygen Demand” (BOD). Because the test is performed over a five day period, it is often referred to as a “Five Day BOD”, or a BOD5. In many biological treatment plants, the facility effluent contains large numbers of nitrifying organism which are developed during the treatment process. These organism can exert an oxygen demand as they convert nitrogenous compounds (ammonia and organic nitrogen) to more stable forms (nitrites and nitrates). Sometimes it is advantageous to measure just the oxygen demand exerted by organic (carbonaceous) compounds, excluding the oxygen demand exerted by the nitrogenous compounds. To accomplish this, the nitrifying organisms can be inhibited from using oxygen by the addition of a nitrification inhibitor to the samples. The result is termed “Carbonaceous Biochemical Oxygen Demand”, or CBOD. The BOD test is used to measure waste loads to treatment plants, determine plant efficiency (in term of BOD removal), and control plant processes. It is also used to determine the effect of discharges on receiving waters. A major disadvantage of the BOD test is the amount of time (5 days) required to obtain the results. Aerobic: A condition in which “free” or dissolved oxygen is present in an aquatic environment.
  • 12. Anaerobic: A condition in which “free” or dissolved oxygen is not present in an aquatic environment. Blank: A preliminary in analysis omitting only the sample to provide an unbiased reference point or baseline for comparison. Nitrification: An aerobic process in which bacteria change ammonia and organic nitrogen in wastewater into oxidized nitrogen (usually nitrate). The second-stage BOD is sometimes referred to as the “nitrification stage”. (The first stage is called the “carbonaceous stage”.) Nutrient: Any substance used by living things that promotes growth. Respiration: The process in which an organism uses oxygen for its life processes and gives off carbon dioxide. Seeding: The process of adding live bacteria to a sample. 3. SAFETY AND HYGIENE When testing for BOD, the concerns for safety involve wastewater hazards and exposure to chemicals. Precautions to follow include the following: 1. Cover all abrasions and water good quality latex gloves when in direct contact with raw wastewater. 2. Wash hands frequently, and always wash hands prior to eating or smoking. 3. Clean up all spills of wastewater or buffers immediately. 4. Wear a protective smock, apron, or lab coat, and surgical or rubber gloves when working in the laboratory to protect clothes and skin. 5. Read all labels carefully and know what to do in case of a spill. 6. Always use a pipette bulb. NEVER pipette anything by mouth. 7. Always pour acids or bases into water, never add water to the acid or base. Mixing concentrated acids or bases with water can create a significant amount of heat. 8. Use care when handling sharps (broken glass etc.).
  • 13. 4. MATERIAL AND APPARATUS 1. BOD meterwithprobe formeasurementof dissolvedoxygenin300 mL BOD bottles 2. 300 mL BOD bottles 3. Incubator,capable of maintaining20=/- 1°C 4. 250 mL graduatedcylinders 5. 100 mL graduatedcylinders 6. 25 mL measuringpipettes(wide-mouth) 7. 10 mL measuringpipettes(wide-mouth) 8. 100 mL beaker 9. 1000 mL beaker 10. 250 mL Erlenmeyerflask 11. Burette graduatedto0.1 mL 12. Dilutionwaterbottle of suitable 13. Pipette bulb 14. EquipmentforpHmeasurement 15. Magneticstirrerand stirringbars 5. PROCEDURE 1. Completely fill three BOD bottles with dilution water 2. Into additional BOD bottles, partially filled with dilution water, carefully measure out the proper volume of sample. Add dilution water until the bottles are completely filled.
  • 14. 3. Stopper each bottle taking care to avoid trapping air bubbles inside the bottles as the bottle stopper are inserted. 4. Fill the top of each bottle neck around the stopper with dilution water.
  • 15. 5. Determine the initial DO content on one of each set of duplicate bottles, including the dilution water blank by one of the approved methods and record data on the lab sheet. 6. Place the remaining bottles in the incubator at 20°C and incubate for five days. 7. At the end exactly five days(+/-3 hours), testthe DO content of the incubated bottles. 8. Calculate the BOD for each dilution. The most accurate BOD will be obtained from those dilutions that have a depletion of a least 2mg/L DO and least 1.0 mg/L residual. If three is more than one dilution that meets these criteria, the BOD results should be averaged to obtain a final BOD value. 9. The dilution water blanks are used only to check quality of the dilution water. If the quality of the water is good and free from impurities, the depletion of DO should be less than 0.2mg/L. In any event, do not use the depletion obtained as a blank correction. 10. If nitrification inhibition is used, the BOD test must also be performed an a series of sample dilutions which have not been imhibited.
  • 16. 6. RESULT AND DISCUSSION INFLUENT Bottle n ( dilution factor ) Initial DO (mg/L) Final DO (mg/L) Depletion (mg/L) 1 0.01 0.88 0.78 10 2 0.01 0.88 0.78 10 3 0.01 0.88 0.78 10 AVRG 10 EFFLUENT Bottle n ( dilution factor ) Initial DO (mg/L) Final DO (mg/L) Depletion (mg/L) 1 0.01 0.88 0.78 10 2 0.01 0.88 0.78 10 3 0.01 0.88 0.78 10 AVRG 10
  • 17. 7. CALCULATION 𝐶𝑎𝑙𝑐𝑢𝑙𝑎𝑡𝑒 𝐵𝑂𝐷5 = 𝑖𝑛𝑖𝑡𝑖𝑎𝑙 𝐷𝑂 − 𝐹𝑖𝑛𝑎𝑙 𝐷𝑂 𝑛 𝑛 = 𝑠𝑎𝑚𝑝𝑙𝑒 𝑣𝑜𝑙𝑢𝑚𝑒 𝐵𝑂𝐷 𝑣𝑜𝑙𝑢𝑚𝑒 = 3 300 = 0.01 𝐵𝑂𝐷5 = 10− 10 0.01 = - 990 *Domestic waste dilution 1 :100 – 1 : 500
  • 18. 8. EXERCISE a. Why must a dilution water blank be included with each series of BOD tests?  To check the quality of the dilution water. b. What is the accepted temperature range and time of incubation for the BOD test?  20 +/- ° C and 5 days c. What is being measured when nitrification is used in the BOD test?  Carbonaceous BOD ( CBOD ) d. What are the criteria for most valid resultd of the BOD test  Use dilutions which deplete at least 0.2mg/L after 5 days and have at least 1.0mg/L  DO remaining in the dilution. 9. CONCLUSION While precission is sometimes tough with the BOD test, a check of dilution water quality, seed effectiveness, and analytical technique can be made using a glucose-glutamic acid solution. A 2% dilution (6 mL BOD bottle) should yield 200 +/-37 mg/L BOD, after five days incubation at 20ºC . To ensure valid result for this “standard” check, the glucose-glutamic acid dilutions must be seeded since the solution is essentially sterile and does not contain any microorganisms. The BOD test is a biological test, dependent on the actions of the microorganisms founds in the waste water and, as such, is subject to a number of variations. These variations can be caused by a number of factors, including changes in temperature, weather, composition of incoming sewage, in-plant operations, and sampling points. Result can vary widely from day to day , or
  • 19. even hour to hour. One of the major disadvantages of the BOD test is the time lag between the collection of samples and the final calculation of results. This makes the BOD test a poor test for determining whether or not operational changes are needed. In addition, the rate and degree that organic matter in waste water is decomposed (or oxidizer ) by the normal bacteria present in a sample is largely dependent on the characteristics of the organic metter . For example, some organic matter (like sugars or starches) are oxidized very easily and rapidly, and will almost always resul in measurable ‘BOD’. Other organic metter, however, is sometimes resistant to biological oxidation, and may require special “acclimated” bacteria to oxidize the material and to show a “BOD”. Although this is what actually happens in nature , it causes significant variation in “BOD” result from sample to sample. Some common ranges of BOD results are as follows, in mg/L : Influent 150-400 Primary 60-160 Secondary Effluent 10-60 Digester Supernant 1000-4000+ Industrial Wastes 100-3000+