1. Mathematical Theory and Modeling www.iiste.org
ISSN 2224-5804 (Paper) ISSN 2225-0522 (Online)
Vol.2, No.8, 2012
Microfinance Intervention and Enterprises Growth: An
Application of Structural Equation Modelling
Severine S. A. Kessy,
University of Dar es Salaam Business School, P.O. Box 35046, Dar es Salaam, Tanzania
Email: severinesk@udbs.udsm.ac.tz
Abstract
The purpose of this paper was to assess the impact of microfinance services on growth of micro and small
enterprises structural equation modelling (SEM) in Tanzania. Specifically, sales revenue, assets levels and
number of employees were used as indicators of MSEs growth. On the other hand loan received, loan invested,
interest rate and repayment time were used as indicators of microfinance services. Through the use of SEM, the
findings revealed that while the loan amount (i.e. amount received and amount invested affected growth
positively, loan conditions (interest rate and repayment time) affect growth negatively. It is thus recommended
that microfinance institutions (MFIs) should find proper conditions that will not hinder the growth of enterprises
owned by their clients.
Introduction
Different writers have devoted their efforts to defining impact assessment (Roche, 1999; Barnes and Sebstad,
2000, and Afrane, 2002). For example, Roche (1999) defined impact assessment as a systematic analysis of the
lasting or significant changes - positive or negative, intended or not, brought about by a given action or a series
of actions. Barnes and Sebstad (2000) also define impact assessment as a study to identify changes that result
from a programme. Thus impact assessment aims at establishing a plausible association between changes
experienced and participation in the programme. It is a management mechanism aimed at measuring the effects
of projects on the intended beneficiaries (Afrane, 2002). With respect to credit intervention it includes the effects
of the project on the change in sales revenue, assets level or a number of employees of an enterprise. These
definitions suggest that the results of assessment can match or differ from the original objectives of the actions
taken. For example, if the objective of a microfinance project is to provide loans to poor people in order to
improve their standard of living, then the impact assessment study will reveal whether the standard of living of
the targeted group has improved or not. Likewise, if the objective of microfinance providers is to facilitate the
growth of enterprises, impact assessment will show whether the growth of these enterprises has been realised or
not.
Basing on these definitions, the impact can be conducted within the programme itself or to the beneficiaries.
The two focuses are termed as the intermediary school of thought and intended beneficiary school of though
respectively (Hulme, 2000). Under intermediary school of thought, the positive changes will be observed within
the programme if MFIs are financially sustainable and are able to reach and provide services to more people in
especially remote areas. It focuses purely on the beginning of the chain and in particular on changes in the MFI
and its operations. The school concerns itself with the health of the financial organisation in terms of its
sustainability (both operational and financial) and judges the social benefit of this intervention in terms of its
outreach to numbers of poor people and their poverty profile (Johnson, 1998). Accordingly, if both outreach
and sustainability have been enhanced, then the intervention is judged to have a beneficial impact as it has
widened the financial market in a sustainable fashion (Hulme, 2000).
On the side of intended beneficiary school of though, the positive impact will be realised if the programme
has changed the lives of their clients in a positive way. Specifically, the realisation of financial sustainability and
wider outreach at the level MFIs, and improved standards of living at the level of beneficiaries are considered as
positive impact. The negative impact of microfinance will therefore mean that either microfinance providers
and/or clients have not achieved the intended objectives of the provided services. The impact assessment on
users therefore, assumes that the intervention will change behaviour and practice in ways that lead to the
achievement (or raise the probability of achievement) of the desired outcomes.
The choice between these two schools depends on one hand on the strength, weakness and usefulness of the
school and on the other hand the inclination to the study objectives. The intended beneficiary school can
distinguish ‘who’ benefits and ‘how’ (Hulme, 2000), and therefore enable the assessor to gain an in-depth
understanding of the impact of the services on clients. It is however more demanding in terms of methodology
and resources as it focuses on people and their enterprises as units of analysis (Manroth, 2001). The intermediary
school usefully incorporates notions of financial and operational sustainability, and largely use pre-existing data
to assess the impact of microfinance services. It is however considered to be very weak to reveal ‘who’ benefits
47
2. Mathematical Theory and Modeling www.iiste.org
ISSN 2224-5804 (Paper) ISSN 2225-0522 (Online)
Vol.2, No.8, 2012
and ‘how’ (Hulme, 2000). The school lacks the information about the impact at the clients end (Manroth, 2001).
Given the strengths and weaknesses of each school of thought, together with the focus of this study (focuses on
impact on users), the intended beneficiary school of thought was adopted for this study to examine the extent to
which the programmes interventions have led to enterprises growth.
Conceptualization of Impact Assessment
In the conceptualisation of impact assessment, there are a number of variables that the assessors can consider.
These present a complex set of links among the variables of the study because the casual effect among the
variables may be influenced by different factors. For example, Hulme (2000) observed the following in impact
assessment;
“……. in a conventional microfinance project a package of technical assistance and capital, changes
the behaviour (and products) of a microfinance institution. The MFI subsequently provides different
services to a client, most commonly in the form of a loan. These services lead to the client modifying
her/his enterprise activities which in turn lead to increased or decreased enterprise income. The
change in enterprise income causes changes in household income which in turn leads to greater or
lesser household economic security. The modified level of household economic security leads to
changes in the morbidity and mortality of household members, in educational and skill levels and in
future economic and social opportunities” (pp 81 – 82).
Hulme’s view suggests that there are different variables and units of analysis in conducting impact
assessment on microfinance services. In this study the intended beneficiary school of thought and MSEs as units
of analysis were used. This being the case, the model that is appropriate for the study should focus on the users’
impact and not the service providers’ impact. Specifically, it should build and use the assumption that the
services of microfinance programmes may or may not lead to the client modifying her/his MSE activities, which
in turn leads to the growth of MSEs. Credit is assumed to provide a large and more predictable base of working
capital for low income earners who could not save their income for investment. It reduces cost by allowing
clients to purchase fairly bulk inputs which provide alternatives to the higher cost suppliers. It is therefore
considered to be a tool that improves productivity and produces more outcomes to the MSEs activities (Sebstad
et al, 1995). All these suggest that credit creates a better chance for MSEs growth.
Also theories related to enterprises growth like resource based theory and production theory suggest that
access to resources lead to growth of enterprises. In this regard, the rational actor models of traditional
economic theories (such as neo-classical and microeconomic theories) contend that entrepreneurs will expand
their firms willingly to some optimal size determined by the level of market demand for their output (Glancey,
1998). The central idea of this view is based on the fact that if there is enough demand, then the only task of
firms’ owners/managers is to produce and supply more to the available market. This will enable the firm to make
more profit and therefore the main assumption is that firm’s motive is profit maximization (Glancey, 1998;
Mansfield, 1996 and Jensen, 2000). In this perspective the distinctive role of the owner/manager is to make
strategic decisions on how to allocate the scarce resources in the pursuit of profit opportunities (Glancey, 1998).
Under this argument, it is often presumed that there is a most profitable size (Penrose, 1959) and firms should
make every effort to reach that size. In order to reach this level, economists accentuate the importance of factors
of production in creating wealth and hence growth of the firm (Reekie and Crook, 1995).
According to the production theory, these factors are raw materials (natural capital), labour services (human
capital), capital goods, and land. Sometimes a fifth category is added, entrepreneurial and management skills, as
a subcategory of labour services. The factors are converted to wealth and hence growth of the firm through
production process. The employment of an additional input will result to the increase in output, however the
augmentation of factor inputs will reach a point whereby the output will increase at a decreasing rate, which is
also known as a point of diminishing return (Mansfield, 1996 and Jensen, 2000). This process evidenced that the
additional resources to the process will result to an increase in the output which further resulted into the growth
of particular firm. Like the quantity produced in production process, the growth of the MSEs depends on various
factors like labour in the form of human capital, financial capital and raw materials. The fact that financial
capital is limited to most of MSEs in developing countries, MFIs are considered to be critical elements in
providing financial capital to MSEs, which enable them to build their assets and adding up their income for
growth (Kuzilwa, 2005). Although the production theory explains how additional inputs create outputs and
hence growth of the firm, this theory mistakenly assumes that all resources have equal weights on their
contributions towards the firms’ growth. This assumption created the need to discuss the resources based view in
order to show the importance of critical (strategic) resources on growth of the firm.
The resources based view describes how business owners build their business from the resources and
capabilities that they currently possess or can acquire (Dollinger, 1999). The resources based theory posits that
the long term competitiveness of a firm depends on its endowment resources (Rangone, 1999). In this case,
48
3. Mathematical Theory and Modeling www.iiste.org
ISSN 2224-5804 (Paper) ISSN 2225-0522 (Online)
Vol.2, No.8, 2012
resources are considered valuable when they enable a firm to conceive or implement strategies that improve
performance, exploit market opportunities or neutralise impending threats (Barney, 1995). As excess resources
can provide service at zero marginal cost, they motivate entrepreneurs to apply them to new activities,
engendering endogenous innovation and thereafter realise the growth of their enterprises (Pitelis, 2005).
According to this view, competitive advantage and hence growth emerge through processes of resources
accumulation and deployment, leading to idiosyncratic endowments of proprietary assets (Olomi, 2001). The
resources are harnessed into strength and weaknesses by firms and in so doing lead to competitive advantage.
The services yielded by resources are a function of the way in which they are used, same resources when used
for different purposes or in different ways and in combination with different types or amounts of other resources
provide a different service or set of services (Penrose, 1959). This indicates that the quality of product produced
from a bundle of resources depends on particular ingredients used and the way in which they are combined. It is
from this point Penrose (1959) argues that it is never resources themselves, but only the goods and services that
the resource can render.
In order to explain how resources affect the output of enterprises Mishina, Pollock and Porac (2004)
conducted a study to examine how the nature and availability of resources influence the effectiveness of growth
strategies pursued by management. In achieving their objective, they focused on resource slack, rather than the
absolute amount of resources. Their findings revealed that financial and human slack resources interact with
growth strategies in different ways to influence growth. The data suggest that pursuing product expansion was
facilitated by financial slack but inhibited by human resource slack, and that pursuing market expansion was
facilitated by human resource slack. They concluded that market expansion and product expansion imply
different degrees of complexity and uncertainty, and that this difference is important for how each type of
expansion utilizes human and financial resources. From this conclusion it is clear that resources play important
roles in facilitating the growth of enterprises, but combination of resources is required to achieve higher level of
growth.
In line with resource based view, the financial resources are considered as one of the core resources of any
enterprise because they are medium of exchange to other resources. For example, economists who are the
founders of resources based theory (i.e. Penrose, 1959) treat finance as a very important factor among the
corporate factors of production. Irrespective of the firm size and age, finance is normally required for three
standard uses, that is for capital investment (start-up or expansion), financing working capital during start-up or
while expanding and purchase of operating materials (Kuzilwa, 2005). In respect of this reality, the issue of
finance availability to firms (especially MSEs) has garnered world-wide concern (Berger and Udell, 2002).
Without adequate financing, the growth potential will be constrained and at worst, the survival of the business
could even be threatened. It is from this argument we hypothesised that the credit service has positive influences
on the growth of MSEs owned by MFIs clients.
Methods
In order to test the above hypothesis, a survey was conducted to different MSEs supported by MFIs in Tanzania.
Specifically the survey covered a total of 225 respondents from four different regions; Dar es Salaam (92),
Mwanza (52), Arusha (47) and Mbeya (34). In assessing the growth of enterprises, three different measures i.e.
sales revenue, number of employees and assets level were used. Additionally, loan received, loan invested,
interest rate and repayment time were used as indicators of microfinance services. Specifically, amount received
and amount invested were used to measure loan amount while interest rate and repayment time were used to loan
conditions. In testing whether credit facilities lead to the growth of MSEs or not, SEM was used because it
provides a straightforward method of dealing with multiple relationships simultaneously while providing
statistical efficiency (Hair et al, 1998). The model is also considered to be powerful because it accommodates the
analysis of relationships in a situation of multiple latent independent variables even if each variable is measured
by multiple indicators. It also allows the analysis of one or more latent dependent variables whereby each
variable is measured by multiple indicators.
FINDINGS
Using of Structural Equation Modelling
Before using SEM for impact assessment, it is important to examine the normality and linearity of collected data.
This is based on the fact that SEM assumes a linear relationship and normal distribution of the data (Hair et al,
1998). In the process of examining linearity, the data were plotted into scatter diagrams in order to see whether
there were possibilities of connecting the values (points) of the coordinates by using straight lines. In other
words, the scatter diagrams were used to assess whether linear functions could be used to join the points of the
coordinates. After the examination, the scatter diagrams evidenced types of exponential functions which could
not be used for hypothesis testing. Again in testing whether the collected data follow normal distribution; the
49
4. Mathematical Theory and Modeling www.iiste.org
ISSN 2224-5804 (Paper) ISSN 2225-0522 (Online)
Vol.2, No.8, 2012
histograms were used to evaluate the skewness of data distribution. Some of the variables evidenced a symmetric
distribution, while others were either right or left skewed. Given the findings of data diagnosis, the data were
required to be transformed into linear forms and also normal distribution.
A natural logarithm was applied to all variables (indicators of both independent and dependent variables) in
order to transform them into linear forms before using them for testing. This was based on the fact that if the
relationship of data follows an exponential curve of the form z = λe bx , then this relationship can be converted
into a linear function by using logarithmic rules. By applying logarithmic rules this relationship will be the same
as ln( z ) = ln(λe bx ) = ln(λ ) + ln(e bx ) = ln(λ ) + bx ln(e) = ln(λ ) + bx . The logarithmic equation of
the above exponential equation is therefore presented as ln(z ) = ln(λ ) + bx . Given that ln(λ ) is a constant it
can be represented by a, and if ln(z ) is represented by y then the relationship will be y = a + bx which is
a linear function. Apart from using logarithms, it is statistically argued that when sample size is large (i.e.
n ≥ 30 ) then it tends to normal distribution (Baradyana and Ame, 2005). Given this consensus, the normality of
data can be assumed, because the sample size was far higher than the provided cutting point of n ≥ 30 . The
transformation of data into logarithmic form also reduces the level of deviation of observations from the average
which reduces the values of skewness and kurtosis. The assurance of normality and linearity creates a way
forward for testing by using SEM.
Although this model has generally been recognised as a powerful multivariate tool (Hair et al, 1998 and
Ullman, 2007), its usefulness depends on whether the produced model fits the data used. In this regard, the
discussion on the measures of the SEM output model fit is presented in order to highlight the criteria for
appropriate use of SEM output for testing and making decisions and conclusion. This assists the researchers to
answer an important question: “is it a good model to use?” The objective of answering this question is to
determine whether the associations among the measured and latent variables in the estimated model adequately
reflect the observed associations in the data (Weston and Gore, 2006). To achieve this objective, multiple indices
are available to assess the model fit. These include absolute fit measures, incremental fit measures and
parsimonious fit measures (Hair et al, 1998).
Absolute fit measures assess the difference between the observed and model-specified covariances, whereas
incremental fit measures assess the proportionate improvement in the fit by comparing a target model with a
more restricted nested baseline model (Tsigilis, Koustelios and Togia, 2004). On the other hand the parsimonious
fit measures adjust the measures of the fit to provide a comparison between models with differing numbers of
estimated coefficients in order to determine the amount of fit achieved by each estimated coefficient (Hair et al,
1998). Although the intention of this section is not to discuss these groups, the following measure indices are
2
discussed in order to show how they can be used to test the overall model fit. The chi-square ( χ ) test is
normally used as a first step to measuring the model fit. Because the null hypothesis for the overall model fit
states that the model fits the data, the probability ( p ) value of χ 2 should be insignificant. The postulate of the
null hypothesis reflects the specification that the model is valid for the given data. The p value associated with
χ2 represents the likelihood of obtaining a χ2 value that exceeds the critical region value when the null
hypothesis is true. In this regard, if the p value of χ 2 is below the conventional cutting point of 0.05 then the
model is rejected, otherwise it is accepted. However, with large samples, trivial differences between the sample
and the estimated population covariance matrices are often significant because the minimum of the function is
multiplied by N −1 (Ullman, 2007). It is therefore argued that the significance of χ2 may be caused merely
by the sample size, making the retention of the null hypothesis for large samples almost impossible (Smith and
McMillan, 2001).
2
This criticism leads to the application of an alternative method for overall model fit by using χ . It is
2
therefore proposed that the researchers can alternatively use the ratio between χ value and its degrees of
freedom which is also known as the normed chi-square (Hair et al, 1998). Kline (1998) articulates the model will
be fit if the normed χ2 is 3. However, Ullman (2007) emphasised that the good-fitting model can be achieved
2
when the ratio of χ value to its degrees of freedom is less than 2. Due to alternative ways of using χ 2 to
reach the decision of accepting or rejecting the model, researchers have universally used χ2 to evaluate the
50
5. Mathematical Theory and Modeling www.iiste.org
ISSN 2224-5804 (Paper) ISSN 2225-0522 (Online)
Vol.2, No.8, 2012
2
model fit (Martens, 2005) despite its limitations. These limitations and criticisms of χ , dictate the discussion of
other commonly used indices to test the model fit. Other indices that are commonly used for model fit include
the Goodness of Fit Index – GFI (Bentler, 1990), the Root Mean Square Error of Approximation – RMSEA
(Browne and Cudeck, 1993), the Normed Fit Index – NFI, the Tucker-Lewis Index – TLI (Bentler and Bonett,
1980), the Relative Fit Index – RFI and the Incremental Fit Index – IFI (Bollen, 1989). The Root Mean Squire
Residual – RMR, the Adjusted Goodness of Fit Index – AGFI, and the Parsimony Goodness of Fit Index – PGFI
(Ullman, 2007) are also measure indices which are widely used. Although there is a number of other indices that
can be used to decide whether the model fits the data used or not, the study is restricted to the above measures
because they are the ones which are recommended and used for most analyses in social sciences and business
related researches (Ame, 2005 and Ullman, 2007).
Among these indices, RMSEA and CFI are the most reported, used and preferred indices especially when
sample size is not small (Ullman, 2007). In order to make a decision using RMSEA, Browne and Cudeck (1993)
proposed that when the RMSEA value is less than 0.08 it indicates an acceptable fit. Later on, Hu and Bentler
(1999) recommend for RMSEA values below 0.06. It is also established that any value which is greater than
0.10 is indicative of poor fitting models (Browne and Cudeck, 1993). On the other hand CFI values greater than
0.95 indicate good fitting models (Hu and Bentler, 1999). The values of other indices that assure the good model
fit are NFI, IFI and TLI all with values greater than 0.95; RFI, GFI, AGFI, and PGFI all with values close to 1,
and small values of RMR (Tanaka and Huba, 1989; Bentler and Bonett, 1980; Ullman, 2007; Hu and Bentler,
1999 and Bentler, 1989). Due to the availability of different indices for measuring models fit, Ullman (2007)
argues that if the results of the fit indices are inconsistent, the model should probably be re-examined; if the
inconsistency can not be resolved, consider reporting multiple indices. In this case, few indices that accept the
model fits can be used for analysis; however the selected indices should be used with justification. After
identifying and explaining the criteria used to evaluate whether the SEM output can be used for further analysis
without any modification, the next section discusses the application of these criteria in testing the posed
hypothesis.
Relationship Between Credit Services and the Growth of MSEs
The hypothesis states that the credit service has positive influences on the growth of MSEs owned by MFIs
clients. The objective of testing this hypothesis was to assess the effect of the received credit on the growth of
MSEs owned by MFIs clients. In order to assess the goodness of fit of SEM output produced to the used data, the
same procedures as discussed above were used. The process started by examining the values of indices for the
overall model fit. The ( p ) value of χ 2 was 0.08 which is greater than the cutting point of 0.05. This value
leads to the conclusion that the null hypothesis that the model produced fits the data used was insignificant. In
this regard, the null hypothesis that model produced fits the data used could not be rejected, and therefore the
derived conclusion was that the model fits the data used. In using the ratio of χ 2 to its degrees of freedom
2
(normed χ ), the value of the SEM output was 1.60 (Table 1). This value is less that 3 which is the maximum
values provided by Kline (1998), and also 2 which is a maximum value provided by Ullman (2007) for overall
model to be fit. From these results, it can be concluded that both criteria recommended when using χ2 to
assess the overall model fit, suggest that the model can be used for further analysis because it fits the used data.
Table 1: Summary of the SEM Model Fit for H1
CMIN
Model NPAR CMIN DF P CMIN/DF
Default model 15 20.80 13 .08 1.60
Saturated model 28 .00 0
Independence model 7 571.11 21 .00 27.20
51
6. Mathematical Theory and Modeling www.iiste.org
ISSN 2224-5804 (Paper) ISSN 2225-0522 (Online)
Vol.2, No.8, 2012
RMR, GFI
Model RMR GFI AGFI PGFI
Default model .24 .97 .94 .45
Saturated model .00 1.00
Independence model 1.31 .53 .37 .40
Baseline Comparisons
Model NFIDelta1 RFI rho1 IFI Delta2 TLI rho2 CFI
Default model .96 .94 .99 .98 .99
Saturated model 1.00 1.00 1.00
Independence model .00 .00 .00 .00 .00
RMSEA
Model RMSEA LO 90 HI 90 PCLOSE
Default model .05 .00 .09 .43
Independence model .34 .32 .37 .00
From table 1, the RMSEA index which is 0.05 indicates that the model produced fits the data that were used.
This is according to the cut off point provided by Browne and Cudeck (1993) which recommended the RMSEA
value less than 0.08, and that of Hu and Bentler (1999) which recommended for a RMSEA value below 0.06.
Other indices as provided in table 1 revealed that CFI, NFI, IFI and TLI all have values greater than 0.95, RFI
value is close to 1, also the GFI, AGFI, and PGFI values are all close to 1. The values of these indices according
to different writers like Tanaka and Huba (1989), Bentler and Bonett (1980), Ullman (2007), Hu and Bentler
(1999) and Bentler (1989), suggest that the associations between credit and growth of MSEs in the estimated
model adequately reflect the observed associations in the data. In this regard it can be concluded that the overall
fit measures provide a good picture supporting the adequacy of the model in explaining the relationship between
credit and growth of MSEs, whereby the results of the model can be used for further analysis. Although the
evaluation of model fits allows the use of the produced results for further analysis, it is equally important to
assess the usefulness of individual indicators to the study analysis. This assessment is based on the results
presented in table 2. Table 2 shows the results of the level of significance for regression weights. In this regard,
all probabilities of getting critical ratios for all regression weights were approaching zero. This implies that the
regression weights for independent variables in the prediction of dependent variables were significantly different
from zero at 0.05 level of significance (two-tailed). These results lead to the conclusion that all regression
weights explain the observed relationships between independent variables and dependent variables. After
ascertaining the usefulness of regression weights, the SEM output in the path diagram in figure 1 was used to test
hypothesis.
Table 2: Regression Weights: (Group number 1 - Default model)
Estimate S.E. C.R. P Label
Growth <--- Loan Amount 1.00
Growth <--- Condtn -.10 .10 -1.03 .003 par_4
AvRev <--- Growth .67 .06 10.29 *** par_1
NoEmploy <--- Growth 1.65 .20 8.10 *** par_2
Aset <--- Growth 1.00
LoanRec <--- Loan Amount 1.00
LonInv <--- Loan Amount 1.04 .07 15.66 *** par_3
InterestR <--- Condtn .97 1.03 .94 .005 par_5
RepayTm <--- Condtn 1.00
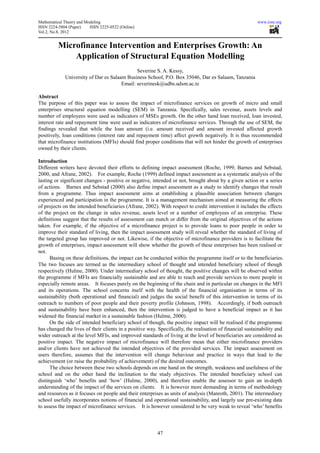
From figure 1, the assessment of credit which was measured by the received loan and the conditions that are
applicable for the credit revealed opposing results. In this case the loan amount evidenced a positive relationship
52
7. Mathematical Theory and Modeling www.iiste.org
ISSN 2224-5804 (Paper) ISSN 2225-0522 (Online)
Vol.2, No.8, 2012
with growth. The value of 0.93 shows that there is a positive relationship between the received loan and the
growth of enterprises. Specifically, this value means that when loan goes up by a unit of standard deviation, the
growth of MSEs goes up by 0.93 standard deviations. The squared multiple correlations for the received loan and
the invested loan which were the measures of loan amount, evidenced very high values. These values were 76
percent and 74 percent for the received loan and the invested loan respectively. This means that the indicators of
the received loan explain 76 percent of the variance of the received loan, while the remaining part which is 24
percent is explained by error variance. On the other hand the indicators of the invested loan explain its variance
by 74 percent while the remaining part is explained by the variance of the error terms.
Figure 1: Path Diagram for Credit and Growth of MSEs
.76 .55
e1 LoanRec .87 Aset e6
Loan Amount .74
.74 .86 .43
.93
e2 LonInv .88 .66 AvRev e7
.81 Growth
e4 .90 -.06
InterestR .54 .29
Condtn NoEmploy e8
.44 .67
e5 RepayTm
d1
Standardized estimates
Chi-squire = 20.797
Df = 13
p = .077
The results have also revealed a negative relationship between the conditions applicable to the credit and the
growth of MSEs owned by MFIs clients. The findings of this test revealed that the regression weight of credit
conditions to the MSEs growth was -0.06. The value implies that when the conditions for growth are tightened
the growth possibilities are limited. The unit change of standard deviation of credit conditions in strictness
direction, will lead to the decrease in the growth by 0.06 units of standard deviations. Additionally, the squared
multiple correlations for the measures of credit conditions revealed a differed result. While that of the interest
charged on credit was 81 percent, the squared multiple correlation for the repayment time was 44 percent. This
result leads to the conclusion that the indicators of the charged interest rates explain 81 percent of variance of the
charged interest, while the remaining part which is 19 percent is explained by error variance. Likewise the
indicators of the repayment period explain its variance by 44 percent while the remaining part is explained by the
variance of the error terms.
In assessing the overall variability of growth as a result of variability of the loan amount and conditions of
accessing credit, the squared multiple correlation of growth has been examined. When looking at the squared
multiple correlation of growth, the result shows a very high value which means that both the loan amount and
credit conditions explain the variability in the dependent variable which is the growth of MSEs. The values of
the squared multiple correlation for the MSEs growth was 88 percent. This means that loan amount and
conditions of credit explain 88 percent of growth variance. In other words the percentage of growth variance
explained by other factors (error terms) is only 12. This value articulates that both the loan amount and
conditions of getting credit explain properly the existing relationship with the growth of MSEs which
experienced microfinance interventions.
Furthermore, by introducing another latent variable named microfinance credit, that combines the effect of
indicators of both the loan amount and credit conditions, the SEM output produced a positive relationship
between microfinance credit and the growth of MSEs. The regression weight of the latent variable was 0.84.
This value means that a unit increase of a standard deviation of microfinance credit (combining both the loan
amount and credit conditions) leads to 0.84 increases in standard deviation of MSEs growth. The positive
regression weight was based on the fact that the loan amount had higher regression weight than the credit
conditions in magnitude. Due to this reasoning, it is clear that the regression weight of the loan amount outweigh
the negative value of credit conditions. The aggregate therefore produced a positive relationship between credit
53
8. Mathematical Theory and Modeling www.iiste.org
ISSN 2224-5804 (Paper) ISSN 2225-0522 (Online)
Vol.2, No.8, 2012
service and the growth of MSEs. In this regard, the study results lead to the acceptance of the hypothesis that
“the credit service has positive influences on the growth of MSEs owned by MFIs clients.”
Discussion
The results of the study as compared to other theoretical and empirical findings emphasised that credit is very
important in triggering the growth of enterprises owned by MFIs clients. The resources based view for example
emphasized how available resources can be used to create competitive advantages and subsequently the growth
of a firm. According to this view, credit is considered to be an important resource that can create a competitive
advantage for firms and therefore take advantage of the available opportunities. It was established empirically
that access to credit enables entrepreneurs to take different advantages including cost minimisation through
discounts gained from bulk purchases, ability to finance different activities of the businesses and smooth
financing of unexpected events (Kuzilwa, 2005, Berger and Udell, 2002 and ILO/UNDP, 2000). Credit is
therefore considered to be an important resource especially for MSEs in Tanzania and other developing countries
because it enables these MSEs to acquire inputs for their operations.
Same results were observed by Kessy and Urio (2006) as one of the respondent in their study admitted that
“the money I got from PTz has assisted me to expand the restaurant and to open a new hotel business. I am now
returning the loan of 1,000,000/= and I believe I will keep on expanding”. Other empirical evidences like Mead
and Liedholm (1998), Mosley (2001), Kuzilwa (2005), Chijoriga and Olomi (2004) and Chijoriga and Cassimon
(1999) also come out with the same conclusion which support the proposition that credit is very important for
growth realisation. The conclusion reached by these writers is based on the fact that the owners of MSEs have
very limited capacities of financing their businesses internally. However access to credit creates the capacity and
opportunity for MSEs owners to purchase stocks, to invest in new technology, to expand the market and enables
them to take advantages of the suppliers’ discount (Chijoriga and Cassimon, 1999, 1999; ILO/UNDP, 2000 and
Kuzilwa, 2005). The result also shows a negative relationship between the conditions of credit and the growth
of enterprises. More stringent credit conditions therefore weaken the growth of enterprises owned by the MFIs
clients. Credit conditions are therefore creating an unfavourable environment which limits the existence, survival
and growth of the enterprises. Responses from interviews regarding the effect of MFIs conditions on their
businesses also show negative effects on growth.
“… first of all the interest rate charged is very high, so we feel like the MFIs are exploiting us but
there is no alternative that is why we are still taking loans regardless of high interest rate. ……..the
repayment period is also very short, just one week. Sometimes you may have not yet invested the
received loan, but you are required start the repayment. Therefore we are using the same money to
repay the loan in the first week”1
Kessy and Urio (2006) also established that the amount of loan that was offered is an exasperating condition to
customers as one respondent of their study admitted that “when I joined PTz, I thought I will be able to get any
amount I needed, but that was not the case, as a new member has to start from the stage of 50,000/= and keep
graduating until the level of 5,000,000/=.This takes so long to get enough funds for big loan seekers.” The
conditions, and especially the requirement of collateral, constrained the growth of enterprises owned by MFIs
clients. They argued that with a condition of collateral only those with immovable assets can access big loans.
This is a limiting factor because most of the MFIs clients operate their businesses in rented premises and
therefore do not have immovable assets to put as collaterals. Consequently, these clients were not able to access
large loans for expanding their businesses.
Conclusion and Implications
The findings of the study revealed that credit is positively related to growth. This means that the access to credit
appears to trigger growth. Therefore the higher the credit the higher the growth achieved by the enterprises.
Furthermore, it was established that the conditions of credit had a negative relationship to the growth of the
enterprises. These conditions were observed to have an adverse impact on the enterprises operations and they
include a short grace period for loan repayment and high interest rates. The loan condition which requires the
enterprises owner to start with small loan amounts and thereafter graduating to higher loans after repayment was
also considered to be a limiting factor for rapid growth of the enterprises.
These results call for special attention that can address the problems that hinder the growth of MSEs. The MFIs
should therefore consider the possibility of increasing the grace period and reducing the frequency of repayment
in order to attract businesses like farming which have a long term payback period. In line with efforts from the
1
Interview with one MFIs client in Arusha
54
9. Mathematical Theory and Modeling www.iiste.org
ISSN 2224-5804 (Paper) ISSN 2225-0522 (Online)
Vol.2, No.8, 2012
side of MFIs, MFIs clients are also required to utilise the available resources in a non-fungible manner because
the study found that fungibility is one of the limiting factors for MSEs growth. Therefore proper utilisation of the
received loans will enable the businesses owned by MFIs clients to grow and contribute towards economic
development in terms of income generation and the creation of employment opportunities. This will enable the
achievement of the Millennium Development Goals and the Tanzania National Strategy for Growth and
Reduction of Poverty, both of which have the objectives of growth and poverty reduction in the country.
References
Afrane, S. (2002). “Impact Assessment of Microfinance Interventions in Ghana and South Africa; A Synthesis of
Major Impacts and Lessons”, Journal of Microfinance, 4 (1), 37 – 58
Ame, A. M. (2005). The effect of quality and Satisfaction and its Consequences on Customers’ Behavioural
intentions: A study of selected Service Firms in Tanzania, Unpublished PhD. Thesis, University of Dar es
Salaam.
Baradyana, J. S. & A. M. Ame (2005). Quantitative Techniques for Business Decisions, Dar es Salaam, Mkuki na
Nyota Publishers ltd
Barnes, C., & J. Sebstad (2000). Guidelines for microfinance impact assessments, Washington DC, Management
Systems International
Barney, J. B. (1995). “Looking Inside for Competitive Advantage”, Academy of Management Executive, 9 (4),
49-61.
Bentler, P. M. (1989 ). EQS structural equations program manual, Los Angeles, BMDP Statistical Software.
Bentler, P. M. (1990). Comparative fit indices in structural models. Psychological Bulletin, 107, 238-246.
Bentler, P. M., & Bonett, D. G. (1980). Significance tests and goodness-of-fit in the analysis of covariance
structures, Psychological Bulletin, 88, 588 – 606
Berger, A. N. & G. F. Udell (2002). Small Business Credit Availability and Relationship Lending: The
Importance of Bank Organisational Structure, The Economic Journal, 112, 32 – 53
Bollen, K. A. (1989). Structural equations with latent variables. NY: Wiley. A leading, readable text on structural
modeling.
Browne, M.W. & R. Cudeck (1993), “Alternative ways of assessing model fit,” in Testing Structural Equation
Models, ed. K.A. Bollen and Long. S., Newbury Park CA: Sage, 136–162
Chijoriga, M. & D. Cassimon (1999). Micro Enterprise Financing: Is there a Best Model?: in Rutashobya L. K.
and Olomi, D. R.(eds), African Entrepreneurship and Small Business Development, Dar es Salaam, DUP
(1996) Ltd
Chijoriga, M. & D. R. Olomi (2004). Good Practices in the Revolving Loan Fund Component of the Project on
Promoting Gender Equality and Decent Work Throughout all Stages of Life, A Paper Submitted to ILO,
December.
Dollinger, M. J. (1999). Entrepreneurship Strategies and Resources, Upper Saddle River, NJ: Prentice Hall.
Glancey K. (1998). Determinants of Growth and Profitability in Small Entrepreneurial Firms, International
Journal of Entrepreneurial Behaviour & Research, 4 (1), 18-27.
Hair, J. F., R. E. Anderson, R. L. Tatham & W. C. Black (1998). Multivariate Data Analysis, New Jersey,
Prentice Hall
Hu, L. & P. M. Bentler (1999). Cutoff criteria for fit indexes in covariance structure analysis: Conventional
criteria versus new alternatives. Structural Equation Modeling 6(1): 1-55.
Hulme, D. (2000). Impact Assessment Methodologies for Microfinance: Theory, Experience and Better Practice,
World Development, 28 (1), 79 – 98.
ILO/UNDP (2000). Micro and Small enterprises Development & Poverty Alleviation in Thailand, International
Best Practice in Micro and Small Enterprises Development Working Paper No. 2, Edited by Gerry Finnegan.
Jensen, M. C. (2000). A Theory of the Firm: Governance, Residual Claims, and Organisation Forms, London:
Harvard University Press.
Johnson, S. (1998). Programme Impact Assessment in Microfinance: the need for analysis of real markets, IDS
Bulletin October 1998, University of Bath.
Kessy, S. A. & F. Urio (2006). The Contribution of Microfinance Institutions to Poverty Reduction in Tanzania,
Research Report No. 06.3 – REPOA, Mkuki na Nyota Publishers, Dar es Salaam.
Kline, R. B. (1998). Principles and practice of structural equation modeling, New York, Guilford Press
Kuzilwa, J. A. (2005) The Role of Credit for Small Business Success: A Study of the National Entrepreneurship
Development Fund in Tanzania, The Journal of Entrepreneurship, 14 (2), 131 – 161
Manroth, A. (2001). How effective is Microfinance in the CEEC and the NIS? A discussion of impact analysis to
date, Masters, The London School of Economics and Political Science, The European Institute.
Mansfield, E. (1996). Managerial Economics: Theory, Applications, and Cases, 3rd Ed., NY, Norton.
55
10. Mathematical Theory and Modeling www.iiste.org
ISSN 2224-5804 (Paper) ISSN 2225-0522 (Online)
Vol.2, No.8, 2012
Martens, M. P. (2005). The use of structural equation modeling in counseling psychology research. The
Counseling Psychologist, 33, 269-298.
Mead, D. C, and C. Liedholm (1998). The Dynamics of Micro and Small Enterprises in Developing Countries,
World Development, 26 (1), 61 – 74.
Mishina, Y., Pollock, T. & Porac, J. (2004). Are More Resources Always Better for Growth? Resource Stickiness
in Market and Product Expansion, Strategic Management Journal, 25, 1179 – 1197
Mosley, P. (2001). Microfinance and Poverty in Bolivia, Journal of Development Studies, 37 (4), 101-132.
Olomi, D. R. (2001). Entrepreneurial Motivation in a Developing Country Context-Incidence-Antecedents, and
consequences of Growth-seeking Behaviour Among Tanzanian Owner-manager, PhD. Thesis, University of
Dar es Salaam.
Penrose, E. (1959). The Theory of the Growth of the Firm, NY: Blackwell.
Pitelis, C. (2005). Edith Penrose, Organisational Economics and Business Strategy: An Assessment and
Extension, Managerial and Decision Economics, 26, 67 – 82
Rangone, A. (1999). A Resource-Based Approach to Strategy Analysis in Small-Medium Sized Enterprises,
Small Business Economics, 12, 233–248.
Reekie, D. & J. N. Crook (1995). Managerial Economics: a European Text, 4th Ed, NY: Prentice Hall.
Roche, C. (1999). Impact Assessment for Development Agencies: Learning to Value Change, Development
Guidelines, Oxford, Oxfam.
Smith, T. D. & B. F. McMillan (2001). A primer of Model Fit Indices in Structural Equation Modeling, A paper
presented at the annual meeting of the Southwest Education Research Association, February 1 – 3, New
Orleans, Retrieved on 20th May 2009 from
http://www.eric.ed.gov/ERICDocs/data/ericdocs2sql/content_storage_01/0000019b/80/16/cc/b3.pdf
Tanaka, J. S., & Huba, G. J. (1989). A general coefficient of determination for covariance structure models under
arbitrary GLS estimation. British Journal of Mathematical and Statistical Psychology, 42, 233-239.
Tsigilis N., A. & Koustelios, A. Togia (2004). Multivariate Relationship and Discriminant Validity Between Job
Satisfaction and Burnout, Journal of Managerial Psychology, 19 (19), 666 – 675
Ullman, J. E. (2007). Structural Equation Modeling, in Tabachnick, B. G., and Fidell, L. S. (2007). Using
Multivariate Statistics, 5th ed., Boston, Allyn and Bacon
Weston, R. & Gore, P. A. (2006). A brief Guideline to Structural Equation Modeling, The Counselling
Psychologist, 34 (5), 719 – 751
Mailing Information
Dr. Severine S. A. Kessy, University of Dar es Salaam Business School P. O. Box 35046, Dar es Salaam,
TanzaniaTel: +255713 370208E-mail: severinesk@udbs.udsm.ac.tz or severinesk@yahoo.com
About the Author
Dr. Severine S. A. Kessy is a Lecturer at the University of Dar Es Salaam Business School in the Department of
General Management. He completed B.A - Statistics (Hons) and MBA (Finance) at the University of Dar es
Salaam (UDSM). In 2007, he completed a Licentiate of Philosophy degree at Umeå University in Sweden and a
PhD (Business Administration) at the UDSM in 2010. Kessy has a vast experience in the areas of Microfinance
Institutions, Growth of Micro and Small Enterprises. Since 2000, he has been engaged in research, training and
consultancies in these areas.
56
11. This academic article was published by The International Institute for Science,
Technology and Education (IISTE). The IISTE is a pioneer in the Open Access
Publishing service based in the U.S. and Europe. The aim of the institute is
Accelerating Global Knowledge Sharing.
More information about the publisher can be found in the IISTE’s homepage:
http://www.iiste.org
The IISTE is currently hosting more than 30 peer-reviewed academic journals and
collaborating with academic institutions around the world. Prospective authors of
IISTE journals can find the submission instruction on the following page:
http://www.iiste.org/Journals/
The IISTE editorial team promises to the review and publish all the qualified
submissions in a fast manner. All the journals articles are available online to the
readers all over the world without financial, legal, or technical barriers other than
those inseparable from gaining access to the internet itself. Printed version of the
journals is also available upon request of readers and authors.
IISTE Knowledge Sharing Partners
EBSCO, Index Copernicus, Ulrich's Periodicals Directory, JournalTOCS, PKP Open
Archives Harvester, Bielefeld Academic Search Engine, Elektronische
Zeitschriftenbibliothek EZB, Open J-Gate, OCLC WorldCat, Universe Digtial
Library , NewJour, Google Scholar