ICAR - Indian Institute of Soil and Water Conservation (Dehradun)
•Télécharger en tant que PPTX, PDF•
4 j'aime•3,204 vues

Fifth Asian Soil Partnership workshop 26 February - 1 March 2019, New Delhi, India Prabhat R. Ojasvi

Recommandé
Contenu connexe
Tendances
Tendances (20)
Similaire à ICAR - Indian Institute of Soil and Water Conservation (Dehradun)
Similaire à ICAR - Indian Institute of Soil and Water Conservation (Dehradun) (20)
Plus de ExternalEvents
Plus de ExternalEvents (20)
Dernier
Dernier (20)
ICAR - Indian Institute of Soil and Water Conservation (Dehradun)
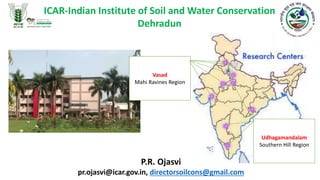
- 1. ICAR-Indian Institute of Soil and Water Conservation Dehradun P.R. Ojasvi pr.ojasvi@icar.gov.in, directorsoilcons@gmail.com Dehradun Himalayan Region Chandigarh Shiwalik Hills Region Agra Yamuna Ravines Region Kota Chambal Ravines Region Vasad Mahi Ravines Region Datia Dry Aravali Plateaus Koraput Shifting Cultivation Ballari Black Cotton Soil Region Udhagamandalam Southern Hill Region
- 2. Vision Conservation and management of soil and water resources of the country for sustainable production. Mission To develop technologies for controlling land degradation and enhancing productivity on sustainable basis for ensuring food, environmental, economic and livelihood security of stakeholders. Mandate • Research for management of land degradation and rehabilitation of degraded lands in different agro-ecological regions of the country. • Co-ordinate research network for developing location-specific technologies in the area of soil and water conservation. • Centre for training in research methodologies and updated technology in soil and water conservation and watershed management.
- 3. Knowledge Base: land degradation due to soil erosion by water; Assess and prioritize erosion risk areas for effective planning and implementation of conservation programmes Mass Erosion Control Rainwater Harvesting and Water Conservation Conservation Agriculture Agroforestry and Horticulture for Resource Conservation Watershed Management Socio-economic Analysis and Policy Measures for Watershed Management Collaborations & Linkages with National and International Institutions Human Resource Development and Technology Transfer Major Activities
- 4. Runoff plot of grass land Runoff plot of Araucaria forest Runoff plot of Citrus orchardOveral view of the watershed
- 5. Mono-block H. flume and Coshocton wheel at the watershed outlet Tipping bucket type runoff and sediment sampler
- 6. The gross erosion of the country is 5.11 Gt/ yr or 1559 t /sq km/ yr 34.1 % deposited in the reservoirs, 22.9 % is discharged outside the country (mainly to oceans), 43.0 % is displaced within the river basins The river basins of northern India contribute about 81% of the total sediment yield from landmass, while the share of southern river basins is 19% Status of Erosion and Soil Budget of Country Source: Sharda and Ojasvi, 2016
- 7. India has 4937 reservoirs with 300 Gm3 storage capacity average annual percentage capacity loss due to sediment deposition is 1.04% or 3 Gm3 Sediment deposit varies from 0.8% to >2% Per year in smaller dams (1–50 Mcum capacity) and from <0.5% to 0.8% in larger dams (51 to >1000 Mcum capacity). Siltation of smaller dams poses a serious threat to their ecosystem services as they cater to a wider population for domestic, agricultural, and industrial purposes. Status of Erosion and Siltation in Reservoirs
- 8. 0 50 100 150 200 250 300 SD(Mt/yr) Arunachal Tripura Sikkim Manipur Punjab Goa Meghalaya J&K Assam WB Bihar Uttarakhand Chhattisgarh TamilNadu Kerala Jharkhand Rajasthan HP UP Orissa MP Gujarat Karnataka AP Maharashtra Total sediment deposition in reservoirs (Mt/yr) Maharashtra looses 304 Mm3 storage capacity every year = Annual water demand of Pune City.
- 9. Modelling Erosion-Yield Relationships • There are empirical and process-based models to estimate erosion-induced changes in crop yields. • Simple correlations, pedotransfer functions, and multivariate analyses are commonly used statistical tools to assess erosion vs. yield relationships. • Principal component analysis (PCA) is another approach to identify the most sensitive soil parameters affecting crop yields. • Geostatistics and remote sensing are useful to evaluate soil erosion impacts across large fields. 0 5 10 15 20 25 30 35 40 0 0.5 1 1.5 2 Soil Loss (t/ha) YieldLoss(%) Grain Stover Yield loss of pearlmillet due to erosion from mild sloping land (0.5-3%) in semi-arid rainfall region 0 50 100 150 200 250 300 350 Runoff Soil Loss 8% slpoe Contour Cultivation Graded Bunding Contour Bunding Bench Terracing Maize and Wheat Rotation 3864 3833 3871 4219 3600 3700 3800 3900 4000 4100 4200 4300 Contour Cultivation Graded Bunding Contour Bunding Bench TerracingMaizeequivalentyield(Kg/ha) 8%
- 10. • Production and monetary losses due to water erosion were computed for 27 major cereal, oilseed and pulse (COP) crops cultivated in the rainfed areas of Indian states (Sharda and Dogra, 2013) • The country as a whole loses 15.7% of its total production of COP crops • Which is equivalent to ₹ 292.03 billion in monetary terms as per the MSP • Out of the total production and monetary losses at national level, the cereals are the major contributors (66% and 44%, respectively), followed by oilseeds (21% and 32%, respectively) and pulses (13% and 24%, respectively) • Paddy is most affected among all the crops in terms of production (4.3 million t) loss followed by maize, soybean, groundnut, sorghum and other pulses Soil Erosion and Food Security
- 11. Projected Change in Sediment yield from baseline to mid century for modeled part of the Ghagra basin Modelling Impacts of Climate Change
- 12. Percentage increase or decrease in water demand in 2020, 2050, and 2080 as compared to 2005 Modelling Impacts of Climate Change Case of Sharda Sahayak Command Area Temperature Change Change in ET
- 13. Existing to Developed Watershed -16.7 9.6 11.7 25.5 -30.0 -20.0 -10.0 0.0 10.0 20.0 30.0 1 PercentChangeinwater availability jul-sep oct-dec jan-mar apr-jun Existing to Degraded Watershed 21.1 -18.8 -12.2 -32.3 -40.0 -30.0 -20.0 -10.0 0.0 10.0 20.0 30.0 40.0 1 PercentChange jul-sep oct-dec jan-mar apr-jun Percent change in quarter-wise water availability under the landuse change Water availability under deficit rainfall during droughts 0 100 200 300 400 500 600 700 jul-sep oct-dec jan-mar apr-jun Thousands Wateravailability(Cu.m.) Normal 20% Decrease 40% Decrease 60% Decrease The quarter-wise water availability under deficit rainfall conditions during low, moderate and severe droughts WATER AVAILABILTY
- 14. IISWC Trench cum bund: Eastern Ghats region of Odisha – increases crop yield by 15-20%. In-situ water harvesting for subsistence of horticultural crop (Mango) in semi-arid areas of Gujarat -Survival improved up to 92% Jalkund for dry uphill slopes Gujarat region ARABLE LANDS
- 15. IISWC Compartmental bunding for in-situ rainwater conservation and sorghum crop Jhola kundi with traditional water lifting devices and Krishak Bandhu pump
- 16. Enhancing Rainwater productivity under farmpond through Solar powered for small farmers Region- Karnataka (by IISWC, RC Bellary) Crops grown Area covered (Acre) Yield (Kg) Net income (Rs) BC ratio Chilli 1.75 1750 122500 3.3 Tomato 1.25 2500 15000 1.4 137500 Crops grown Area covered (Acre) Yield (Kg) Net income (Rs) BC ratio Chilli 1.75 2275 183750 5.2 Tomato 1.25 3000 30000 2 213750 Economics of vegetable cultivation with surface irrigation using diesel pump (pre-scenario). Economics of vegetable cultivation with drip irrigation using solar pump Energy saving in solar pump = 545 kWh Saving in cost of energy = Rs 7603 CO2 emission avoided = 357 Kg
- 17. IISWC Recommended Domain Seasonal streams, Red soils of Bundelkhand region The surface runoff generated from sloping lands during rainy season is harvested and stored into a dug out pond Water harvesting- Dugout Pond Yield of soybean increased by 40% with one supplemental irrigation Yield of toria increased by 180% with one supplemental irrigation Yield of mustard increased by 130 and 400% with two supplemental irrigation Cost:benefit ratio- 1: 2.3
- 18. IISWC Water is diverted from perennial streams or springs stored in a low-cost pond and utilized through gravity-fed micro irrigation system to grow vegetable crops in hilly terraces Water harvesting- Perennial stream flow/ Low discharge springs Low-cost water harvesting pond Capacity : 10 m3 (cost Rs.16000) Lining material: Silpaulin sheet (200 GSM) Drip irrigation system Inline drip tape, Mainline, Screen Filter Small low cost water harvesting pond for gravity fed micro irrigation A view of tomato with gravity-fed drip irrigation Low cost drip irrigation for sloping broad based terraces Domain: Terrace cultivation of high value vegetable crops
- 19. IISWC Water harvesting- High discharge springs Water conveyance system- Underground pipe line with risers Tanks capacity 70,000 & 50,000 Litres Length of pipeline 5.3 km Risers (Nos.) 45 Discharge 12 (litr/sec) Number of beneficiaries 44 Command area (ha) 25 Total cost Rs.19,20,000
- 20. IISWC Karanj Based Silvipastoral System: for Effective Utilization of Chambal Ravines B: C ratio 1.32:1 Kinnow Mandarin For Degraded In Doon Valley B:C ratio of 5.0:1 NON-ARABLE (Degraded) LANDS
- 21. IISWC Mango Based Agri-horticultural System For Degraded Lands - North Western Himalayas B:C ratio - 3.5:1 Aonla Based Agri-horticultural System For Sloppy Lands In Doon Valley B:C ratio – 4.0:1 Application of jute geo-textiles for slope stabilization and vegetation establishment
- 22. Staggered Contour Trenching for horti-pastoral land use in medium- deep ravines of Chambal Create additional surface storage capacity of 33.3 mm/ha Conserve runoff by 87.3% Retain sediment yields of 9.5 t/ha/year The system yields 7.2 t/ha of Aonla, 23 numbers of bamboo clums/ha and 8.5 ton grass/ha annually Development phase: 25 years B: C Ratio of 3.05 Masonry spillways for drainage line treatment in shallow and medium ravine system Masonry spillways are constructed at gully head Increase in-situ moisture in field, and crop yield (89% in case of mustard). It gives an average benefits of Rs 90000/year
- 24. Watershed Treatment Drainage line Treatment Particulars Before treatment (1983) After treatment (1996) Debris outflow, t/ha/yr 550 6 Monsoon runoff, % 57 37 Water quality Not potable Potable Lean period flow, days 60 240 Vegetation cover, % <10 >90 Before After After
- 25. P R Ojasvi IISWC • Out of 4000 Bm3 of rainfall in our country, ~60% or 2400 Bm3 available as overland runoff/soil storage is the core objective of integrated watershed development • About 60 M ha area has been claimed to be treated under various IWM programmes funded by Three ministries- MoA&FW, DoLR and MoEF • There is an increased need to demonstrate the outcomes of these development projects and programs • Advanced computation tools are employed to analyse and document the region-specific impacts • The assessments and evaluation of conservation practices should be carried out at • field, watershed and landscape scale Integrated Watershed Management Programme in India
- 26. Field-scale and Watershed-scale Rainwater Productivity
- 27. Impact of Watershed Development Impact of watershed development work (2008-2014) (location in different agro-ecological regions of the country) Objective / Parameter Impact Reduction in runoff and soil loss Reduction in runoff (field scale) – 80% Reduction in soil loss (field scale) – 84% Creation of storage for harvested water 0.43 – 24.2 ha-m Increase in cropping intensity – 11% Inducing groundwater storage Average rise in water table – 0.18-4.0 m (Summer) 12.8-18.3 m (Post monsoon) Increasing crop and water productivity Increase in crop productivity- 28-83% (various crops) Increase in water use efficiency- 15-26% (kharif crops) 22-32% (Rabi crops) Increase in soil quality – 6.7-11.5 % Crop diversification through vegetable crops, horticulture and agro-forestry Increased area under horticulture/agroforestry-5- 24 ha Reduction in fallow area – 13% Overall environmental sustainability through DLT and bio-engineering measures Reduction in runoff (watershed scale) – 40% Reduction in soil loss (watershed scale) – 17% Average rate of silt deposition- 13.6 t ha-1 yr-1 Overall increase in vegetation cover- 4-9% Livelihood support through income generating activities. Income earned by SHG’s – Rs. 11500-50400 per year Overall increase in income- 5-13%
- 28. P R Ojasvi CSWCRTI Soil conservation and sediment control programmes • Gross erosion in river basins is most prominently influenced by land-use factors • Erosion rates across the basins has negative correlation with increasing agriculture area • attributed to adoption of appropriate conservation measures, & irrigation • Where in the catchment change has occurred?
- 29. ARTIFICIAL INTELLIGENCE (AI) For Understanding Watershed Dynamics P R Ojasvi CSWCRTI KG-4 WATERSHED 6-9-1 Fold 1 Training y = 0.5776x R2 = 0.1481 0 5 10 15 20 25 30 35 40 0 10 20 30 40 6-9-1 Fold 2 Training y = 0.5883x R2 = 0.2839 0 5 10 15 20 25 30 35 40 0 10 20 30 40 6-9-1 Fold 3 Training y = 0.593x R2 = 0.2181 0 5 10 15 20 25 30 35 40 0 10 20 30 40 6-9-1 Fold 4 Training y = 0.583x R2 = 0.3698 0 5 10 15 20 25 30 35 40 0 10 20 30 40
- 30. B A B B A A Before Treatment After TreatmentA B Sainji Watershed Before treatment 2001-2003 (3 years) After Treatment 2004-2008 (5 years) Choe Watershed Before treatment 1964-65 After Treatment 1965-2003 (38 years) Each point denote 5 years epoch Watershed Behaviour Before and After Treatment in Budyko Space Aridity Index EvaporativeIndex
- 31. THANK YOU