Fishery Development in Africa – Countries (2009)
•Télécharger en tant que PPTX, PDF•
1 j'aime•807 vues

1) Fish consumption in Africa is lower than the world average, with inland countries consuming far less than coastal and island nations. However, Africa sees a greater importance of fish as part of total animal protein consumption. 2) The largest fish producers in Africa are Egypt, Nigeria, and Morocco, with the largest aquaculture industries located in Egypt and Nigeria. However, many African fisheries are overexploited. 3) By 2030, population and income growth are expected to increase demand for fish in Africa beyond available supply, potentially leading to a shortage of 7 million tonnes unless fisheries management and governance are improved.

Recommandé
Recommandé
Contenu connexe
Tendances
Tendances (20)
Similaire à Fishery Development in Africa – Countries (2009)
Similaire à Fishery Development in Africa – Countries (2009) (20)
Plus de FAO
Plus de FAO (20)
Dernier
Dernier (20)
Fishery Development in Africa – Countries (2009)
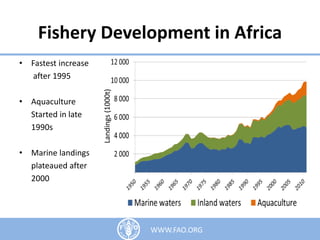
- 1. Fishery Development in Africa 1WWW.FAO.ORG • Fastest increase after 1995 • Aquaculture Started in late 1990s • Marine landings plateaued after 2000 Landings(1000t)
- 2. Fish Consumption in African Countries (2009) 2WWW.FAO.ORG • Average consumption Africa – 9.5kg/person World - 18.5kg/person (red line) • Highest consumption in mid-west coastal countries • Uneven distribution: - Mid-west coastal & island countries >> world average - Inland countries << world average
- 3. Percentage of Fish in Total Animal Protein Consumption in Africa (2009) 3WWW.FAO.ORG • Africa sees a greater importance of fish in animal protein consumption: World average=16.8% (red line) Africa average=19% • Mid-latitude countries have a much higher % than low and high latitude countries
- 4. Fish Consumption (kg/person) and % of Fish in Total Animal Protein Consumption in Africa (1961-2009) 4WWW.FAO.ORG • Stable between 1980-2003 in fish consumption, increasing prior to 1980 • Little variation in % of fish in animal protein consumption after 1975 • Increased fish production counteracted by human population increase
- 5. Geographic Distribution of Marine, Inland and Aquaculture Production in Africa (2011) 5WWW.FAO.ORG • Largest fish production in: Egypt, Nigeria & Morocco • Largest Marine production: Morocco, S Africa, Namibia • Largest aquaculture: Egypt, Nigeria
- 6. WWW.FAO.ORG Geographic Distribution of top Freshwater Brackishwater and Marine Aquaculture Production in Africa (2011) 6WWW.FAO.ORG • Largest Freshwater production: Nigeria, Egypt & Uganda • Largest Brackishwater production: Egypt, Tunisia & Côte d'Ivoire • Largest Marine production: Madagascar, South Africa & Morocco
- 7. WWW.FAO.ORG Regional per capita food fish supply (kg/capita/year) 0 5 10 15 20 25 30 2000 2001 2002 2003 2004 2005 2006 2007 2008 2009 Oceania Northern America Europe Asia World Average L.A. & C. Africa (kg/capita/year) 2009 Africa 9.5 Asia 20.6 Europe 21.9 L.A. & C. 10.1 Northern A. 24.0 Oceania 26.0 World 18.5 Source: FAOSTATS Food Balance Sheets WWW.FAO.ORG
- 8. WWW.FAO.ORG Total food fish supply (million tonnes) 0 20 40 60 80 100 120 140 2000 2001 2002 2003 2004 2005 2006 2007 2008 2009 Oceania L.A. & C. Northern America Africa Europe Asia (million tonnes) 2009 Africa 8.8 Asia 83.3 Europe 16.2 L.A. & C. 5.6 Northern A. 8.2 Oceania 0.7 World 122.9 Source: FAOSTATS Food Balance Sheets WWW.FAO.ORG
- 9. WWW.FAO.ORG Fish demand driven by population and income growth Per capita supply 2007 [kg/cap/yr] (baseline) Total supply 2007 [million tonnes] (baseline) Population Growth projection Population Growth & Income Growth Projection Per capita food fish demand [kg/cap/yr]1 Total fish demand [million tonnes]2 Per capita food fish demand [kg/cap/yr]3 Total fish demand [million tonnes]2 2030 2030 2030 2030 Africa 8.6 9.0 8.5 14.0 11.5 18.7 Asia 19.6 86.4 18.3 96.3 37.0 186.3 Europe 22.2 19.4 22.6 19.9 27.3 23.4 L.A. & C. 9.6 15.2 9.5 16.4 12.2 18.3 Northern A. 24.5 9.1 24.5 10.7 29.8 12.9 Oceania 25.2 1.1 24.9 1.4 31.9 1.8 World 17.8 140.3 16.6 158.8 29.1 261.2 WWW.FAO.ORG 1 Each country’s per capita food fish demand assumed to be equal to the level in 2007. 2 Based on population trends estimated by UN. Including both food and nonfood fish. Demand for nonfood fish in each country assumed to be equal to the level in 2007. 3 Preliminary estimation that considers the impact of income growth on per capita fish demand.
- 10. WWW.FAO.ORG Fish supply-demand gaps • Per capita fish demand in 2020 estimated based on assumptions: – GDP per capita projection by IMF – Prices unchanged – Preference unchanged • Total fish demand in 2030 estimated based on: – Estimated per capita demand in 2020. – UN population projection in 2030. – Non-food fish demand unchanged • Results: – Supply < Demand • 51 mt shortage – S-D gaps decline in all regions • Largest insufficiency in Asia S-D gap (mt) Supply 2030 Demand 2030 S-D gap 2030 Africa 11.7 18.7 -7.0 Asia 156.5 186.3 -29.8 Europe 18.6 23.4 -4.8 L.A. & C. 16.2 18.3 -2.1 Northern A. 6.2 12.9 -6.6 Oceania 1.5 1.8 -0.3 World 210.7 261.2 -50.6 Source: Estimation of FI Department WWW.FAO.ORG
- 11. The State of Fish Resources in Waters Surrounding Africa (2009) 11WWW.FAO.ORG • The most overexploited - Mediterranean (37) • The least overexploited - South West India Ocean (51) • Three areas (34,37,47) are worse overfished than world average • Area 51 at world average
- 12. Improved Fisheries Governance CC-EAF Fisheries Management Enforcement & Compliance Catch statistics, Fleet information Total allowable catch or Equivalent decision Stock Assessment 50 bill. USD Poverty alleviation TAC-setting Rules WWW.FAO.ORG
Notes de l'éditeur
- Western Sahara is occupied by Morocco and has no specific data
- Population growth mainly in Asia and Africa, where per capita fish consumption lower than other regions. Thus, world per capita fish demand would decline from 17.8 kg in 2007 to 16.6 kg in 2030 even if every country maintains its per capita consumption in 2007.
- The first of these pentagrams is the 5 things we have to do as part of fisheries governance, namely: Carrying out some form of Stock assessment. Making a Total allowable catch or some equivalent decision on the basis of some rules that translate our science into catch. Using this science as the basis for designing our fisheries management system, Implementing some Enforcement & compliance, and Collecting catch statistics and fleet information.