Industry profile - Europe’s feed statistics updated
•
0 j'aime•191 vues

This document summarizes statistics from FEFAC's Statistical Yearbook 2014 on the European feed industry. It reports that Europe produced 220 million tonnes of compound feed in 2014, with 155.8 million tonnes produced in the EU-28. The value of the compound feed industry in the EU-28 fell slightly to €52 billion in 2014. The number of feed production units in the EU declined to 3831 in 2014, concentrated in fewer, larger production facilities.

Recommandé
Recommandé
Contenu connexe
En vedette
En vedette (19)
Similaire à Industry profile - Europe’s feed statistics updated
Similaire à Industry profile - Europe’s feed statistics updated (20)
Plus de Milling and Grain magazine
Plus de Milling and Grain magazine (20)
Dernier
Dernier (20)
Industry profile - Europe’s feed statistics updated
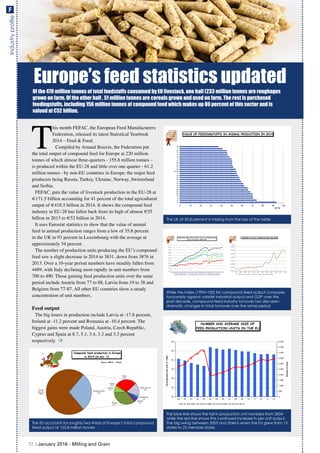
- 1. Industryprofile T his month FEFAC, the European Feed Manufacturers Federation, released its latest Statistical Yearbook 2014 – Feed & Food. Compiled by Arnaud Bouxin, the Federation put the total output of compound feed for Europe at 220 million tonnes of which almost three-quarters - 155.8 million tonnes – is produced within the EU-28 and little over one quarter - 61.2 million tonnes - by non-EU countries in Europe; the major feed producers being Russia, Turkey, Ukraine, Norway, Switzerland and Serbia. FEFAC, puts the value of livestock production in the EU-28 at €171.5 billion accounting for 41 percent of the total agricultural output of €418.5 billion in 2014. It shows the compound feed industry in EU-28 has fallen back from its high of almost €55 billion in 2013 to €52 billion in 2014. It uses Eurostat statistics to show that the value of animal feed in animal production ranges from a low of 35.8 percent in the UK to 93 percent in Luxembourg with the average at approximately 54 percent. The number of production units producing the EU’s compound feed saw a slight decrease in 2014 to 3831, down from 3876 in 2013. Over a 10-year period numbers have steadily fallen from 4489, with Italy declining most rapidly in unit numbers from 700 to 490. Those gaining feed production units over the same period include Austria from 77 to 88, Latvia from 19 to 38 and Belgium from 77-87. All other EU countries show a steady concentration of unit numbers. Feed output The big losers in production include Latvia at -17.8 percent, Ireland at -11.2 percent and Romania at -10.4 percent. The biggest gains were made Poland, Austria, Czech Republic, Cyprus and Spain at 8.7, 5.1, 3.4, 3.3 and 3.3 percent respectively. Europe’s feed statistics updated Of the 478 million tonnes of total feedstuffs consumed by EU livestock, one half (233 million tonnes are roughages grown on farm. Of the other half , 51 million tonnes are cereals grown and used on farm. The rest is purchased feedingstuffs, including 156 million tonnes of compound feed which makes up 80 percent of this sector and is valued at €52 billion. 44 EU-28 (incl. EL) 158.8 Russia 21.7 Ukraine 4.7 Serbia 0.9 Turkey 18.0 Other non-EU 10.6 Switzerland 1.6 Norway 3.7 Europe non-EU 61.2 Compound feed production in Europe in 2014 (in mio. t) Source: FEFAC - Alltech The EU accounts for roughly two-thirds of Europe’s total compound feed output at 155.8 million tonnes 15 0 10 20 30 40 50 60 70 80 90 100 LU EL SI PT BE RO HR CZ ES DE LV BU FR EE LT EU-28 HU PL SE DK CY IT NL AT IE MT FI SK (in %) VALUE OF FEEDINGSTUFFS IN ANIMAL PRODUCTION IN 2014 The UK at 35.8 percent is missing from the top of the table 10 90 95 100 105 110 115 120 125 130 135 140 1995 1996 1997 1998 1999 2000 2001 2002 2003 2004 2005 2006 2007 2008 2009 2010 2011 2012 2013 2014 COMPOUND FEED PRODUCTION IN EU-28 PRODUCTION (Index of volume: 1995=100) GDP at market prices Industrial production Food industry Compound feed industry 17 24.000 29.000 34.000 39.000 44.000 49.000 54.000 59.000 1991 1993 1995 1997 1999 2001 2003 2005 2007 2009 2011 2013 TURNOVER OF THE EU COMPOUND FEED INDUSTRY Mio. € (EU-15 from 1994, EU-25 from 2004 - EU-27 from 2007 - Without Greece, Luxembourg and Malta) While the index (1995=100) for compound feed output compares favourably against volatile industrial output and GDP over the past decade, compound feed industry turnover has also seen dramatic changes in total turnover over the same period 19 0 500 1.000 1.500 2.000 2.500 3.000 3.500 4.000 4.500 5.000 20 25 30 35 40 45 50 99 00 01 02 03 04 05 06 07 08 09 10 11 12 13 14 EUproductionperunit,in1000t Numberofunits NUMBER AND AVERAGE SIZE OF FEED PRODUCTION UNITS IN THE EU (EU-15 until 2003, EU-25 from 2004, EU-27 from 2007, EU-28 from 2013) The blue line shows the fall in production unit numbers from 2004 while the red line shows the continued increase in per unit output. The big swing between 2003 and 2044 is when the EU grew from 15 states to 25 member states 72 | January 2016 - Milling and Grain F