An analysis of mortality events of the West Indian manatee
1. Katherine Saalbach GGS430: Research Project
1
A spatiotemporal analysis of watercraft collision related deaths of the
West Indian manatee (Trichechus manatus) in Florida’s coastal waters
Problem statement:
The West Indian manatee (Trichechus manatus) and its subspecies T. m. latirostris reside in the coastal
waters of Florida and the Caribbean. They were classified as “threatened” by the IUCN (International
Union for the Conservation of Nature) in 2007, and their population numbers are continuing to decline.
The most significant cause of pre-mature death in manatees is by watercraft collision, primarily by larger
vessels that do not have skegs in front of their propellers like recreational boats have. The manatee has no
natural predators in the territory that it lives in since manatees inhabit mainly shallow coastal waters out
of reach of traditional large marine predators. However, manatees are naturally curious and docile
creatures, and many shipping routes and port locations intersect with their usual coastal territory. The
large propellers on these boats can be deadly to the animal if they come into contact.
This study aimed to spatially and temporally analyze data of West Indian manatee deaths off of the coast
of Florida from 1974 to 2013. Collision related deaths were isolated and analyzed as to their frequency
and proximity to major Florida shipping ports. Examining the distribution of the data will help to
determine which port locations correlate with the highest number of collision related deaths, and this will
aid in guiding the next steps that need to be taken to protect these placid marine creatures.
Data:
Manatee mortality data was obtained from the Florida Fish and Wildlife Conservation Commission, and
shipping port data was retrieved from the United States Geological Survey. In addition to location, the
manatee mortality data included the day, month, and year of the carcass finding as well as a categorized
description of the cause of death.
A shapefile of the US states from ESRI and a shapefile of the major shipping lanes around the coast from
the EPA were also downloaded to provide a basemap for the project.
Methodology:
The project was started by acquiring a basemap shapefile of the United States from ESRI. The select by
attribute tool was then used to write a query to select the state of Florida, which was then made into its
own layer.
The next step was importing the manatee mortality data set. After examining the attribute table, the
‘deaths caused by watercraft collision’ points (about 2000 out of 9000 data points) were isolated using the
same tool mentioned to create a unique layer for these points. The original layer was kept visible to show
the difference between the original data and its subset.
After isolating these data points, a shapefile of the major shipping ports in Florida was imported into the
map file. However, this file was not in the same projection as the other data so it needed to be converted
from WGS 1984 to the GCS_North_American_1983 geographic coordinate system. This way, the data
would be aligned on the same projection and the maps would overlay correctly.
Once the port data was overlaying the other points, a 10 mile buffer was created around the ports using
the buffer tool. The point of the buffer was to provide a distance range around the ports, and then figure
2. Katherine Saalbach GGS430: Research Project
2
out which data points (of the watercraft collision subset) were contained within the buffer. This was
accomplished using the intersect tool. Both the Florida ports layer and the ship deaths layer were chosen
as inputs, and a new layer was created based on the points that were within the buffer zone. A table was
then created using the weighted sum tool that showed which ports had the greatest number of watercraft
collision related manatee deaths within a ten mile radius of them.
Data from the manatee attribute table was then analyzed using excel to determine a trend line for the
number of deaths per year as well as a histogram to determine to most common cause of death.
Results:
Figure 1: The distribution of all recorded manatee mortality events off the coast of Florida. The red dots
represent deaths related to watercraft collision, and the yellow dots are those of which fall within the 10
mile buffer around the ports (blue triangles).
3. Katherine Saalbach GGS430: Research Project
3
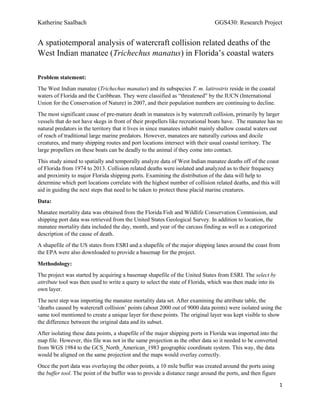
Figure 2: Detailed view of watercraft related deaths within a 10 mile radius of Florida's major shipping
ports. Note that 4 of the 16 ports do not have any intersection.
Figure 3: A snapshot of the data table constructed showing the number of deaths within
a 10 mile radius of each port. 4 of the 16 ports are not shown because they had no
intersection.
4. Katherine Saalbach GGS430: Research Project
4
y = 10.899x + 2.5154
0
100
200
300
400
500
600
700
800
900
1974
1975
1976
1977
1978
1979
1980
1981
1982
1983
1984
1985
1986
1987
1988
1989
1990
1991
1992
1993
1994
1995
1996
1997
1998
1999
2000
2001
2002
2003
2004
2005
2006
2007
2008
2009
2010
2011
2012
2013
Numberofdeaths
Year
Recorded deaths per year
0
500
1000
1500
2000
2500
1 2 3 4 5 6 7 8 9
Frequency
Cause of Death (see key)
Manatee mortality frequency by cause of death
Figure 4: Histogram showing frequency of deaths categorized by the cause of death. The key is shown below.
1 = Human related: watercraft collision
2= Human related: flood gate/canal lock
3= Human related: other
4= Perinatal (<=150cm)
5= Natural: Cold stress
6= Natural: Other (includes Red tides)
7= Verified: Not recovered
8= Undetermined: Too decomposed
9= Undetermined: Other
Figure 5: Bar graph showing the number of reported manatee deaths each year, along with a trend line for the data. The equation for
the trend line has been included.
5. Katherine Saalbach GGS430: Research Project
5
Discussion:
The display of the data confirms that there is a correlation between shipping ports and manatee deaths, but
these mortality events are concentrated around specific ports. This could be because the manatee’s
primary territory and breeding grounds are around these ports.
The graphs also show that watercraft collision is indeed responsible for the highest amount of manatee
deaths, especially because it can be safely assumed that some fraction of the ‘undetermined’ class will
belong to this category as well.
The number of reported manatee deaths has been steadily increasing over the years, with only a recent
decrease starting around 2010. This rising trend could be a result of techniques used to locate and identify
manatee mortality events, but there could also be a relationship to increased shipping traffic in the area.
Florida manatees are a threatened species and scientists are not optimistic about their future given the
current reproduction versus mortality rates. Therefore, measures need to be taken in order to protect these
creatures from their most dominant threat. Different possibilities include installing barriers around the
shipping lanes, or increased monitoring programs. However, these implementations would be costly, and
so the maps from this research will help to determine which areas are of greatest concern and a top
priority.
6. Katherine Saalbach GGS430: Research Project
6
Work Cited
2008 EPA Datasets for Aircraft, Locomotive and Commercial Marine Vessels Sources | US
EPA. (n.d.). Retrieved April 13, 2015, from
http://www.epa.gov/ttnchie1/net/nei08_alm_popup.html
ArcGIS - states_basic. (n.d.). Retrieved April 13, 2015, from
http://www.arcgis.com/home/item.html?id=f7f805eb65eb4ab787a0a3e1116ca7e5
MRGIS GIS Data. (n.d.). Retrieved April 13, 2015, from
http://ocean.floridamarine.org/mrgis/Description_Layers_Marine.htm#marmam
One Million-Scale Data Download. (n.d.). Retrieved April 13, 2015, from
http://nationalmap.gov/small_scale/atlasftp-1m.html?openChapters=chptrans#chptrans
Tripp, K. (n.d.). Manatees: Ancient Marine Mammals in a Modern Coastal Environment. Ocean
Challenge, 16(2).