1. Chapter – 10 Notes Research Methods (KJAN) Summer Quarter 2014
1
Sampling:
Surveys are useful and powerful in finding answers to research questions through data collection and
subsequent analyses. The Process of selecting the right individuals, objects, or events for study is known
as sampling.
Population, Element, Population Frame, Sample, and Subject:
Population: Population refers to the entire group of people, events, or things of interest that the
researcher wishes to investigate.
Element: An element is a single member of the population. If 1,000 blue-collar workers in a particular
organization happen to be the population of interest to a researcher, each blue-collar worker therein is an
element.
Population Frame: The population frame is a listing of all the elements in the population from which the
sample is drawn. For example, the university registry containing a listing of all students, faculty,
administrators, and support staff in the university during a particular academic year or semester could
serve as the population frame for a study of the university population.
Sample: A sample is a subset of the population. It comprises some members selected from it. In other
words, some, but not all, elements of the population would from the sample. If 200 members are drawn
from a population of 1,000 blue-collar workers, these 200 members form the sample for the study.
Sample Unit: The sampling unit is the element or set of elements that is available for selection in some
stage of the sampling process like city blocks, households.
Subject: A subject is a single member of the sample. If 200 members from the total population of 1,000
blue-collar workers formed the sample for the study, then each blue-collar worker in the sample is a
subject.
Sampling: Sampling is the process of selecting a sufficient number of elements from the population, so
that a study of the sample and an understanding of its properties or characteristics would make it possible
for us to generalize such properties or characteristics to the population elements. The characteristics of the
population such as µ (the population mean), σ (the population standard deviation), and σ² (the population
variance) are referred to as its parameters. The central tendencies, the dispersions, and other statistics in
the sample of interest to the research are treated as approximations of the central tendencies, the
dispersions, and other statistics in the sample of interest to the research are treated as approximations of
the central tendencies, dispersions, and other parameters of the population. As such, all conclusions drawn
about the sample under study are generalized to the population.
Reasons for Sampling: The reasons for using a sample, rather than collecting data from the entire
population, are self-evident. In research investigations involving several hundreds and even thousands of
elements, it would be practically impossible to collect data from every element. Even if it were possible, it
would be prohibitive in terms of time, cost, and other human resources.
Representativeness of Samples: The need for choosing the right sample for a research investigation
cannot be overemphasized. We know that rarely will the sample be the exact replica of the population
from which it is drawn. However, if we choose the sample in a scientific way, we can be reasonably sure
2. Chapter – 10 Notes Research Methods (KJAN) Summer Quarter 2014
2
that the sample static (e.g., X, S, or S²) is fairly close to the population parameter (i.e., µ, σ, or σ²). To put
it differently, it is possible to choose the sample in such a way that it is representative of the population.
There is always the slight probability, however, that sample values might fall outside the population
parameters.
Normality of Distributions: Attributes or characteristics of the population are generally normally
distributed. For instance, when attributes such as height and weight are considered, most people will be
clustered around the mean, leaving only a small number at the extreme who are either very tall or very
short, very heavy or very light, and so on, as indicated in Diagram 11.2 (See Chapter 11 of Textbook).
The two important issues in sampling are the sample size (n) and the sampling design. When the
properties of the population are not overrepresented or underrepresented in the sample, we will have a
representative sample. We will now review various types of sampling designs, based on the following
points:
1. Target population of focus to the study
2. What kind of a sampling frame is available?
3. What costs are attached to the sampling design?
4. What is the sample size needed?
5. What exactly are the parameters we are interested in investigating?
SAMPLING PROCESS: PROBABILITY AND NONPROBABILITY
PROBABILITY SAMPLING: When elements in the population have a known chance of being chosen
as subjects in the sample, we resort to a probability sampling design. Probability sampling can be either
unrestricted (simple random sampling) or restricted (complex probability sampling) in nature.
Unrestricted or Simple Random Sampling: In the unrestricted probability sampling design, more
commonly known as simple random sampling, every element in the population has a known and equal
chance of being selected as a subject. The simple random sampling has the least bias and offers the most
Generalizability. However, this sampling process could become cumbersome and expensive.
Restricted or Complex Probability Sampling: As an alternative to the simple random sampling design,
several complex probability sampling (restricted probability) designs can be used that offer a viable and
sometimes more efficient alternative. Efficiency is improved in that more information can be obtained for
a given sample size using some of the complex probability sampling procedures than the simple random
sampling design. The five most common complex probability sampling designs are systematic sampling,
stratified random sampling, cluster sampling, area sampling, and double sampling.
Systematic Sampling: The systematic sampling design involves drawing every nth element in the
population starting with a randomly chosen element between 1 and n. See Example 11.1 in text book.
Stratified Random Sampling: Stratified random sampling involves a process of stratification or
segregation, followed by random selection of subjects from each stratum. The population is first divided
into mutually exclusive groups that are relevant, appropriate, and meaningful in the context of the study.
For instance, if the president of a company is concerned about low motivational levels or high
absenteeism rates among the employees, it makes sense to stratify the population of organizational
members according to their job levels. Stratification is an efficient research sampling design; that is, it
provides more information with a given sample size.
3. Chapter – 10 Notes Research Methods (KJAN) Summer Quarter 2014
3
Proportionate and Disproportionate Stratified Random Sampling: Once the population has been
stratified in some meaningful way, a sample of members from each stratum can be drawn using either a
simple random sampling or a systematic sampling procedure. The subjects drawn from each stratum can
be either proportionate or disproportionate to the number of elements in the stratum. For instance, if an
organization employs 10 top managers, 30 middle managers, 50 lower-level managers, 100 supervisors,
500 clerks, and 20 secretaries, and a stratified sample of about 140 people is needed for some specific
survey, the researcher might decide to include in the sample 20% of members from each stratum. That is,
members represented in the sample from each stratum will be proportionate to the total number of
elements in the respective strata. This would mean that 2 from the top, 6 from the middle, and 10 from the
lower levels of management will be included in the sample. In addition, 20 supervisors, 100 clerks, and 4
secretaries will be represented in the sample, as shown in the third column of Table 11.1. This type of
sampling is called a proportionate stratified random sampling design.
Disproportionate sampling decisions are made either when some stratum or strata are too small or too
large, or when there is more variability suspected within a particular stratum. Disproportionate sampling
is also sometimes done when it is easier, simpler, and less expensive to collect data from one or more
strata than from others.
Table 10.1
Proportionate and Disproportionate Stratified Random Sampling_________________________
Number of Subjects in the sample____
Job Level
Number
of Elements
Proportionate Samplings
(20% of the elements)
Disproportionate
Sampling
Top Management 10 2 7
Middle-level management 30 6 15
Lower-level management 50 10 20
Supervisors 100 20 30
Clerks 500 100 60
Secretaries 20 4 10
Total 710 142 142
Cluster Sampling: When several groups with intra-group heterogeneity and intergroup homogeneity are
found, then a random sampling of the clusters or groups can ideally be done and information gathered
from each of the members in the randomly chosen clusters. The unit costs of cluster sampling are
relatively much lower. However, cluster sampling exposes itself to greater biases and is the least
generalizable of all the probability sampling designs, because most naturally occurring clusters in the
organizational context do not contain heterogeneous elements.
Single-Stage and Multistage Cluster Sampling: We have thus far discussed single-stage cluster
sampling, which involves the division of the population into convenient clusters, randomly choosing the
required number of clusters as sample subjects, and investigating all the elements in each of the randomly
chosen clusters. Cluster sampling can also be done in several stages and is then known as multistage
cluster sampling.
4. Chapter – 10 Notes Research Methods (KJAN) Summer Quarter 2014
4
Area Sampling: The area sampling design constitutes geographical clusters. That is, when the research
pertains to populations within identifiable geographical areas such as counties, city blocks, or particular
boundaries within a locality, area sampling can be done. Thus, area sampling is a form of cluster sampling
within an area.
Double Sampling: This plan is used when further information is needed from a subset of the group from
which some information has already been collected for the same study. A sampling design where initially
a sample is used in a study to collect some preliminary information of interest, and later a subsample of
this primary sample is used to examine the matter in more detail, is called double sampling.
NONPROBABILITY SAMPLING: In non-probability sampling designs, the elements in the population
do not have any probabilities attached to their being chosen as sample subjects. This means that the
findings from the study of the sample cannot be confidently generalized to the population. When
researcher is less concerned about Generalizability and more interested in obtaining some preliminary
information, quickly and inexpensively, they would then use non-probability sampling.
Convenience Sampling: Convenience sampling refers to the collection of information from members of
the population who are conveniently available to provide it. Convenience sampling is most often used
during the exploratory phase of a research project and is perhaps the best way of getting some basic
information quickly and efficiently.
Purposive Sampling: Instead of obtaining information from those readily or conveniently available,
sometimes it becomes necessary to obtain information from specific target groups. The sampling here is
confined to specific types of people who can provide the desired information, either because they are the
only ones who have it, or conform to some criteria set by the researcher. This type of sampling design is
called purposive sampling, and the two major types of purposive sampling are judgment sampling and
quota sampling.
Judgment Sampling: Judgment sampling involves the choice of subjects who are most advantageously
placed or in the best position to provide the information required. For instance, if a researcher wants to
find out what it takes for women managers to make it to the top, the only people who can give firsthand
information are the women who have risen to the top positions. Judgment sampling requires special
efforts to approach the individuals who do have the requisite information.
Quota Sampling: Quota sampling, a second type of purposive sampling, ensures that certain groups are
adequately represented in the study through the assignment of a quota. Generally, the quota fixed for each
subgroup is based on the total numbers of each group in the population. This is a non-probability
sampling plan, so the results are not generalizable to the population. Examples of When Certain Sampling
Designs Would Be Appropriate See Examples at page 281 of text book.
Sampling in Cross-Cultural Research: While engaging in cross-cultural research, it is appropriate here
to point out that, as in instrument development and data collection, one has to be sensitive to the issue of
selecting matched samples in the different countries while conducting cross-cultural research. The nature
and type of organizations studied, whether subjects are from rural or urban areas, and the types of
sampling designs used, should all be similar in the different countries to enable true comparisons.
Issues of Precision and Confidence In Determining Sample Size: A reliable and valid sample should
enable us to generalize the findings from the sample to the population under investigation. in Other
5. Chapter – 10 Notes Research Methods (KJAN) Summer Quarter 2014
5
words, the sample statistics should be reliable estimates and reflect the population parameters as closely
as possible within a narrow margin of error Through the point estimate X may not accurately reflect the
population mean µ an interval estimate can be made within which µ will lie, with probabilities attached –
that is, at particular confidence levels. The issues of confidence interval and confidence level are
important for precision and confidence.
Precision: Precision refers to how close our estimate is to the true population characteristic. Usually, we
would estimate the population parameter to fall within a range, based on the sample estimate. For
example, let us say that from a study of a simple random sample of 50 of the total 300 employees in a
workshop, we find that the average daily production rate per person is 50 pieces of a particular
product(X=50) .We might then be able to say that the true average daily production of the product (µ)
would lie anywhere between 40 and 60 for the population of employees in the workshop. In saying this,
we offer an interval estimate, within which we expect the true population mean production to be
(µ═50±10). The narrower this interval, the greater is the precision. Precision is a function of the range of
variability in the sampling distribution of the sample mean. The smaller the dispersion or variability, the
greater the probability that the sample mean will be closer to the population mean Even if we take only
one sample of 30 subjects from the population, we will be able to estimate the variability is called the
standard error, denoted by SX. The standard error is calculated by the following formula:
SX =
Where S is the standard deviation of the sample, n is the sample size, and SX indicates the standard error
or the extent of precision offered by the sample. Note that the standard error varies inversely with the
square root of the sample size. Hence, if we want to reduce the standard error given a particular standard
deviation in the sample, we need to increase the sample size.
Confidence: Confidence denotes how certain we are that our estimates will really hold true for the
population. In the previous example of production rate, we know we are more precise when we estimate
the true mean production (µ) to fall somewhere between 45 and 55 pieces, than somewhere between 40
and 60. However, we may have more confidence in the latter estimation than in the former. Other things
being equal, the narrower the range, the lower is the confidence. In other words, there is a trade-off
between precision and confidence for any given sample size. The level of confidence can range from 0 to
100%. A 95 % confidence is the conventionally accepted level for most business research, most
commonly expressed by denoting the significance level as p≤.05. In other words, we say that at least 95
times out of 100, our estimate will reflect the true population characteristic.
Sample Data, Precision, and Confidence in Estimation: Precision and confidence are important issues
in sampling because when we use sample data to draw inferences about the population, we hope to be
fairly “on target”, and have some idea of the extent of possible error. For example, we may want to
estimate the mean dollar value of purchases made by customers when they shop at department stores.
From a sample of 64 customers sampled through a systematic sampling design procedure, we may find
that sample mean X =105, and the sample standard deviation S=10.X, the sample mean, is a point
estimate of µ, the population mean. We could construct a confidence interval around X to estimate the
range within which µ would fall. The standard error SX and the percentage or level of confidence we
require will determine the width of interval, which can be represented by the following formula, where K
is the t statistic for the level of confidence desired
S
6. Chapter – 10 Notes Research Methods (KJAN) Summer Quarter 2014
6
µ= X KSX
We already know that:
SX =
Here,
SX= =
From the table of critical values for t in any statistics book (see Table II, columns 5,6, and 9, at the end of
this book, we know that:
If we desire a 90% confidence level in the above case, then µ ═ 105±1.645 (1.25)(i.e., µ ═ 105±20.56) .
µ would thus fall between 102.944 and 107.056. These results indicate that using a sample mean value of
purchases for all customers would fall between $ 102.94 and $ 107.06.
For 90% Confidence level, the K value is 1.645.
For 95% Confidence level, the K value is 1.96.
For 99% Confidence level, the K value is 2.576.
The sample size, n. is a function of:
1. the variability in the population
2. precision or accuracy needed
3. confidence level desired
4. Type of sampling plan used—for example, sample random sampling versus stratified random
sampling.
Trade-Off between Confidence and Precision: We have noted that if we want more precision, or more
confidence, or both, the sample size needs to be increased—unless, of course, there is very little
variability in the population itself. However, if the sample size (n) cannot be increased, then, with the
same n, the only way to maintain the same level of precision would be by forsaking the confidence with
which we can predict our estimates. That is, we reduce the confidence level or the certainty of our
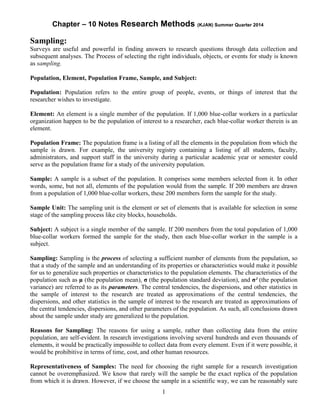
estimate. This trade-off between precision and confidence is illustrated in figure 11.4a and b. Figure 11.4a
indicates that 50% of the time the true mean will fall within the narrow range indicated in the figure, the
.25 in each tail representing the 25 % non-confidence, or the probability of making errors, in our
estimation on either side. Figure 11.4b indicates that 99% of the time we would expect the true mean µ to
fall within the much wider range indicated in the figure and there is only a .005% chance that we would
be making an error in this estimation. That is, in Figure 11.4s,we have more precision but less confidence
(our confidence level is only 50%). In figure 11.4b, we have high confidence (99%), but then we are far
from being precise—that is, our estimate falls within a broad interval range.
Sample Data and Hypothesis Testing: So far we have discussed sample data as means of estimating the
population parameters, but sample data can also be used to test hypotheses about population values rather
than simply to estimate population values. The procedure for this testing incorporates the same
information as in interval estimation, but the goals behind the two methods are somewhat different.
10
S
=1.25
7. Chapter – 10 Notes Research Methods (KJAN) Summer Quarter 2014
7
Figure 10.4
Illustration of the Trade-off between Precision and Confidence. (a) More Precision but Less
Confidence.(b) More Confidence but less Precision
DETERMINING THE SAMPLE SIZE: Sample size is determined by taking into account the precision
and confidence level. The procedure can be illustrated through an example. Suppose a manager wants to
be 95% confident that the expected monthly withdrawals in a bank will be within a confidence interval of
$500. Let us say that a study of a sample of clients indicates that the average withdrawals made by
them have a standard deviation of $3,500. What would be the sample size needed in this case?
The population mean can be estimated by using the formula:
µ=X K Sχ
Since the confidence level is 95%, the applicable K value is 1.96 (t table). The interval estimate of
$500 will have to encompass a dispersion of (1.96 standard error). That is,
500= 1.96 Sχ
Sχ = 500/1.96=255.10
We already know that
SX =
255.10 =
n =188
The sample size needed in the above was 188. Let us say that this bank has a total clientele of only 185.
This means we cannot sample 188 clients. We can in this case apply the correction formula and see what
sample size would be needed to have the same level of precision and confidence given the fact that we
have a total of only 185 clients. The correction formula is as follows:
SX = N - n
N - 1
S
3500
S
8. Chapter – 10 Notes Research Methods (KJAN) Summer Quarter 2014
8
Where N is the total number of elements in the population, n is the sample size to be estimated, Sχ is the
standard error of estimate of the mean, and S is the standard deviation of the sample mean. Applying the
correlation formula, we find that
255.10 =
n=94
We would now sample 94 of the total 185 clients. However, in research, the theoretical framework has
several variables of interest, and the question arises how one should come up with a sample size when all
the factors are taken into account. Krejcie and Morgan (1970) greatly simplified size decision by
providing a table that ensures a good decision model. Table 11.3 in the text book, provides that
generalized scientific guideline for sample size decisions.
Importance of Sampling Design and Sample Size: Roscoe (1975) proposes the following rules of
thumb for determining sample size:
1. Sample sizes larger than 30 and less than 500 are appropriate for most research.
2. Where samples are to be broken into subsamples; (male/females, juniors/ seniors, etc), a
minimum sample size of 30 for each category is necessary.
3. In multivariate research (including multiple regression analyses), the sample size should be
several times (preferably 10 times or more) as large as the number of variables in the
study.
4. For simple experimental research with tight experimental controls (matched pairs, etc.),
successful research is possible with samples as small as 10 to 20 in size.
Efficiency in Sampling: Efficiency in sampling is attained when for a given level of precision (standard
error), the sample size could be reduced, or for a given sample size (n), the level of precision could be
increased. Some probability sampling designs are more efficient than others. The simple random sampling
procedure is not always the most efficient. A stratified random sampling plan is often the most efficient,
and a disproportionate stratified random sampling design has been shown to be more efficient than a
proportionate sampling design in many cases.
Cluster sampling is less efficient than simple random sampling because there is generally more
homogeneity among the subjects in the clusters than is found in the elements in the population. Multistage
cluster sampling is more efficient than single-stage cluster sampling when there is more heterogeneity
found in the earlier stages.
3500 185- n
184