Medical Cost Trend: Behind the Numbers 2017
•
2 j'aime•2,144 vues

On June 21st, PwC’s Health Research Institute (HRI) released its annual Medical Cost Trend: Behind the Numbers 2017 report. PwC’s HRI anticipates a 6.5% growth rate for 2017—the same as was projected for 2016. The report identifies the key inflators and deflators as well as historical context to better understand the medical cost trend for 2017. Increases in the trend due to utilization of convenient care access points and an uptick in behavioral healthcare benefits for employees are being offset by more aggressive strategies by pharmacy benefit

Recommandé
Recommandé
Contenu connexe
Tendances
Tendances (20)
Similaire à Medical Cost Trend: Behind the Numbers 2017
Similaire à Medical Cost Trend: Behind the Numbers 2017 (20)
Plus de PwC
Plus de PwC (20)
Dernier
Dernier (20)
Medical Cost Trend: Behind the Numbers 2017
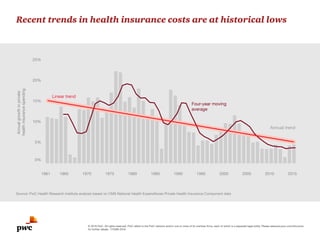
- 1. Source: PwC Health Research Institute analysis based on CMS National Health Expenditure Private Health Data Recent trends in health insurance costs are at historical lows © 2016 PwC. All rights reserved. PwC refers to the PwC network and/or one or more of its member firms, each of which is a separate legal entity. Please seewww.pwc.com/structure for further details. 172489-2016 0% 5% 10% 15% 20% 25% 201520102005200019951990198519801975197019651961 Annualgrowthinprivate healthinsurancespending Annual trend Linear trend Four-year moving average Source: PwC Health Research Institute analysis based on CMS National Health Expenditures Private Health Insurance Component data
- 2. © 2016 PwC. All rights reserved. PwC refers to the PwC network and/or one or more of its member firms, each of which is a separate legal entity. Please seewww.pwc.com/structure for further details. 172489-2016 -4% 0% 4% 8% 12% 201520142013201220112010200920082007200620052004200320022001 Source: PwC Health Research Institute analysis of Bureau of Labor Statistics data Price, not utilization, is the historical force behind medical cost trend OVERALL HEALTHCARE COST: Employer Health Benefit Costs PRICE: PwC Benefit Price Index UTILIZATION: PwC Utilization Index Annualgrowth
- 3. © 2016 PwC. All rights reserved. PwC refers to the PwC network and/or one or more of its member firms, each of which is a separate legal entity. Please seewww.pwc.com/structure for further details. 172489-2016 0% 5% 10% 15% 20% 25% 30% 35% 40% 45% OtherPharmacyOutpatientInpatientPhysician Source: Milliman Medical Index for 2007 and PwC Health Research Institute projections of 2017 medical spending based on the 2016 Milliman Medical Index. http://us.milliman.com/insight/?pfld=2413 Roughly half of employer health costs stem from hospital inpatient and outpatient services; the prescription drug share is small but increasing Shareofemployerhealthbenefits 30% 16% 19% 14% 17% 4% 4% 2007 Share (Milliman) 2017 Share (PwC Projection) % Change since 2007 36% 30%30% -17% 0% 19% 21% 0% Medical index—components of spending
- 4. © 2016 PwC. All rights reserved. PwC refers to the PwC network and/or one or more of its member firms, each of which is a separate legal entity. Please seewww.pwc.com/structure for further details. 172489-2016 Source: PwC Health Research Institute medical cost trends 2007–2017 HRI’s projected medical cost trend 2007–2017HRI’sprojectedmedicalcosttrend 20172016201520142013201220112010200920082007 6.5% 6.5%6.8%6.5% 7.5% 8.5% 9%9%9.2% 9.9% 11.9%
- 5. © 2016 PwC. All rights reserved. PwC refers to the PwC network and/or one or more of its member firms, each of which is a separate legal entity. Please seewww.pwc.com/structure for further details. 172489-2016 Use of retail clinics is increasing along with the number of places for treatment Source: PwC Health Research Institute Consumer Survey and Convenient Care Association data 0 500 1,000 1,500 2,000 2,500 3,000 3,500 Numberofretailclinics Percentofconsumerswhouseretailclinics 10% 30% 50% 70% 80% 201620152014201320122011 20% 40% 60% 0% 24% 36% 40% Projected
- 6. © 2016 PwC. All rights reserved. PwC refers to the PwC network and/or one or more of its member firms, each of which is a separate legal entity. Please seewww.pwc.com/structure for further details. 172489-2016 The share of employer health spending on mental health services is increasing Source: PwC Health Research Institute analysis based on Medical Expenditure Panel Survey data 4.0% 4.5% 5.0% 5.5% 6.0% 6.5% 201320122011201020092008200720062005 Annual Increase Linear Trend Mentalhealthspendingasa shareoftotalemployerhealthspending
- 7. © 2016 PwC. All rights reserved. PwC refers to the PwC network and/or one or more of its member firms, each of which is a separate legal entity. Please seewww.pwc.com/structure for further details. 172489-2016 The new focus on mental health parity will likely increase utilization in 2017 Source: PwC Health Research Institute analysis, Kaiser Family Foundation, Kaiser Health News and Health Affairs 2008 Mental Health Parity Act amended to require full parity. Insurance companies must treat mental health conditions on an equal basis with physical conditions when health policies cover both 2010 The Patient Protection and Affordable Care Act was signed which required all health insurance plans to include coverage for the treatment of mental health and substance use disorders March 2016 President Obama announces a new task force on mental health parity—aimed at ensuring that people with mental illnesses and substance abuse problems don’t face discrimination in the health care system Timeline of mental health parity legislation March 2016 CMS finalizes mental health and substance use disorder parity rule for Medicaid and Children’s Health Insurance Program October 31, 2016 The interagency task force will be responsible for delivering a report to the President 2005 2010 2015 Mar. 2016 June 2016 Sept. 2016 Dec. 2016
- 8. © 2016 PwC. All rights reserved. PwC refers to the PwC network and/or one or more of its member firms, each of which is a separate legal entity. Please seewww.pwc.com/structure for further details. 172489-2016 Interest in high performance networks has increased substantially Source: PwC Health Research Institute analysis of PwC’s Health and Well-being Touchstone survey for 2014, 2015 and 2016 Percent of employers Already implemented a performance based network 3% 6% 9% 34% 37% 43% Considering the implementation of a performance based network ‘14 ‘15 ‘16 ‘14 ‘15 ‘16
- 9. © 2016 PwC. All rights reserved. PwC refers to the PwC network and/or one or more of its member firms, each of which is a separate legal entity. Please seewww.pwc.com/structure for further details. 172489-2016 The approval of a second specialty medication within a treatment class can give PBMs leverage to extract sizable rebates Discount = 40% Discount = 5% PBMs act to limit formularies to one treatment, lowering the net cost of drug Z Specialty drug Z, a first-in-class breakthrough therapy, has a list price of $60,000 for a course of treatment Source: PwC Health Research Institute $57,000 $36,000 Specialty drug M, a direct competitor, gains FDA approval
- 10. © 2016 PwC. All rights reserved. PwC refers to the PwC network and/or one or more of its member firms, each of which is a separate legal entity. Please seewww.pwc.com/structure for further details. 172489-2016 Source: PwC Health Research Institute estimate based on National Health and Nutrition Examination Survey and 2012 Truven Health Analytics claims data from employers The impact of Hepatitis C therapy on medical cost trend declines after 2016 as the number of patients treated declines -0.4% -0.2% 0% 0.2% 0.4% 0.6% 0.8% 1.0% 1.2% 20212020201920182017201620152014 ChangeinemployermedicalcosttrendduetoHepCdrugtherapy Numberofpatientstreated 0 20,000 40,000 60,000 80,000 100,000 120,000 140,000 0.10% 0.15% -0.23% -0.10% -0.08% -0.06% -0.04% Annual change in medical cost trend Annual number of patients treated Change in Medical Costs Impact of Hepatitis C therapy on employer medical costs 0.71%
- 11. © 2016 PwC. All rights reserved. PwC refers to the PwC network and/or one or more of its member firms, each of which is a separate legal entity. Please seewww.pwc.com/structure for further details. 172489-2016 0% 1% 2% 3% 4% 5% 6% 7% 8% High Cost, Low VolumeLow Cost, High VolumeHigh Cost, High Volume The impact of a new specialty drug entering the market can vary greatly depending on price and volume of sales Source: PwC Health Research Institute estimate Base medical cost trend Increase from new therapy use 6.5% 6.5% 6.5% 0.7% 0.0% 0.2% Annual%changeinthemedicalcosttrend