Effective Rural Vocational Rehabilitation Job Development - A State of the Science Event by RTC:Rural

On July 22, 2017, State Vocational Rehabilitation staff and administrators, researchers and job development providers from across the country participated in RTC:Rural’s State of the Science webinar exploring how Vocational Rehabilitation (VR) payment models influence the availability of job development services in rural areas. The event aimed to help participants understand which models may facilitate better VR outcomes in rural areas, and encourage conversation between VR and providers about how payment models impact job development services. While VR agencies use a variety of models to deliver job development services, the majority contract with third-party providers to deliver services such as resume development, job coaching, and job placement. There is evidence, however, that different payment models (such as hourly, fee-for-service, or performance-based benchmarks) influence the availability and quality of job development services in rural communities. This Rural VR Job Development webinar explored the relationship between VR payment models, geography, and VR outcomes. The webinar was designed to provide current and pertinent information to stimulate a rich discussion among participants. Strategies to address VR outcomes were discussed such as hybrid models that draw upon the strengths of different delivery models and the use of incentives to serve rural areas and “hard cases.” The webinar featured a review of current research from the Research and Training Center on Disability in Rural Communities (RTC:Rural), followed by reactions from a panel of experts representing a variety of perspectives within the field of VR service delivery: --Betsy Hopkins, Director of Maine’s Division of Vocational Rehabilitation, spoke about Maine’s efforts to implement a hybrid payment model. --Jessica Adams, a job development service provider in rural Idaho, shared insights from her experience participating in Idaho’s piloted (and then abandoned) performance-based system. --Mimi Shafer, Rehabilitation Area Manager in southwestern Minnesota, spoke to challenges in serving rural areas due to CARF accreditation requirements, and new challenges introduced by WIOA. --Joe Xavier, Director of the California Department of Rehabilitation, shared his perspectives on what makes a successful VR program in rural areas. --Susan Foley, Ph.D., Senior Research Fellow at the Institute for Community Inclusion at University of Massachusetts, Boston, shared perspectives based on her experiences directing multiple national centers focused on research, training, and technical assistance for VR agencies. A video recording of the webinar is available for viewing here: https://www.youtube.com/watch?v=XhBHn50LdH8

Recommandé
Recommandé
Contenu connexe
Similaire à Effective Rural Vocational Rehabilitation Job Development - A State of the Science Event by RTC:Rural
Similaire à Effective Rural Vocational Rehabilitation Job Development - A State of the Science Event by RTC:Rural (20)
Plus de Research and Training Center on Disability in Rural Communities, at the University of Montana
Plus de Research and Training Center on Disability in Rural Communities, at the University of Montana (9)
Dernier
Dernier (20)
Effective Rural Vocational Rehabilitation Job Development - A State of the Science Event by RTC:Rural
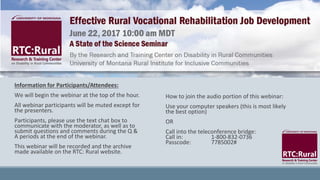
- 1. Information for Participants/Attendees: We will begin the webinar at the top of the hour. All webinar participants will be muted except for the presenters. Participants, please use the text chat box to communicate with the moderator, as well as to submit questions and comments during the Q & A periods at the end of the webinar. This webinar will be recorded and the archive made available on the RTC: Rural website. How to join the audio portion of this webinar: Use your computer speakers (this is most likely the best option) OR Call into the teleconference bridge: Call in: 1-800-832-0736 Passcode: 7785002#
- 3. Catherine Ipsen, Ph.D. Director of Employment Research Research and Training Center on Disability in Rural Communities (RTC:Rural) Associate Director Rural Institute for Inclusive Communities University of Montana Catherine.Ipsen@mso.umt.edu (406) 243-4562
- 4. Agenda RTC:Rural Research Rural Disparities Premature Exit Job Development Contracted Services Panelists Betsy Hopkins, Director of the Maine Division of Vocational Rehabilitation Mimi Shafer, Rehabilitation Area Manager of Minnesota VR Services Jessica Adams, Provider, Community Connections, Idaho Joe Xavier, Director of California Department of Rehabilitation Susan Foley – Director of the RRTC on VR, RTAC on VR Program Management, and SGA project Participant Input
- 5. Rural Demographics - Disability As counties become more rural, the percentage of people with disabilities increases. This trend is true for all disability types and age groups. 12.4 % 11.7 % 15.5 % 17.7% NATION METRO MICRO NONCORE Disability Rate by Metro Status
- 6. Rural Demographics - Poverty 14.7 % 17.1 % 17.1 % 22.4 % 24.4 % 25.0 % METRO MICRO NONCORE Poverty Rate by Disability Status and County Type No Disability Disability Poverty rates increase as counties become more rural for people with and without disabilities. One quarter of people with a disability living in non-core counties experience poverty.
- 7. Rural Demographics - Employment Non-Core Counties Employment Rate Unemployment Rate Not in the Labor Force People w/out disability 72.3% 6.6% 21.2% People with disability 29.4 % 5.9% 64.6% Employment and unemployment rates are slightly lower in non-core counties for people with and without disabilities Discrepancies between groups, however, are very large and accounted for by individuals with disabilities who are not in the labor force
- 8. Explaining Rural Disparities Limited economic opportunity and choice Lack of infrastructure (i.e. public transportation, accessible buildings, etc.) Limited access to programs, specialists, or experts
- 9. Vocational Rehabilitation VR can help overcome rural barriers Access point for rural consumers Funding stream for obtaining services Higher employment outcomes in rural (RSA 911, 2015) 33% of all cases in urban 34% of cases in large rural city 37% of cases in rural 38% of cases in isolated rural Context Similar rates of competitive closures Nominal differences in wage rates across locations Higher rates of self-employment closures as cases become more rural
- 10. Exploring Reasons for VR Dropout Nearly half of all eligible consumers drop out before completing the program. VR spends approximately $365 million annually to serve consumers who disengage from services. Premature exits include cases classified as: Unable to locate No longer interested in receiving services or further services Premature exit is associated with worse economic outcomes 82.9% of consumers with cases closed to competitive employment were still employed one year later compared to 33.4% of consumers who chose to forgo VR services (Hayward & Schmit, 2003)
- 11. Exploring Reasons for VR Dropout Prospective study with VR clients to better understand factors leading to premature exit. T1 = 355, T2 = 262, T3 = 212, and T4 = 188 Overall satisfaction with VR services across time points was associated with: Pace of service delivery Rates of contact between the counselor and consumer - both in-person and via phone/email. Satisfaction ratings with the counselor
- 12. Exploring Reasons for VR Dropout 162 participants left the VR system over the 24 month study period Reasons for Exit Met their goals 35% (n = 58) Personal reasons 30% (n = 49) Dissatisfied with services 34% (n = 55)
- 13. Exploring Reasons for VR Dropout Almost half of respondents at each wave of data collection felt that progression through VR services was too slow Reason for exit, however, was strongly associated with delivery pacing Reason for Exit Service too slow About right Met Their Goals 28% 72% Dissatisfied with Services 71% 29% Personal Reasons 50% 50%
- 14. Possible Strategies to Reduce Exit Increase counselor-consumer communication Telecommunications (rural strategy) Deliver services more quickly Reduce the time for determining eligibility SGA project Reduce the time to IPE development Get people working and faster Job Development Contracted Services project
- 15. Job Development & Contracted Services Receipt of job placement and development activities are important predictors of VR employment outcomes Bradley, Ebener & Geyer, 2013; Timmons & Smith, 2010 Agencies generally deliver services using one of three models Internal service delivery Performance-based benchmarks (vendors, contractors, CRPs, etc.) Fee-for-service or hourly (vendors, contractors, CRPs, etc.) Research Qualitative interviews – 40 agencies, 35 states RSA 911 quantitative analyses (and model indicators) – 50 agencies, 42 states
- 16. Internal Delivery Models In some agencies, counselors provide job development services As part of normal work load In cases when vendors (or CRPs) are not available Business consultants, business outreach specialists, employment consultants Provide job development and placement services Network with employers about DVR services generally – dual customer approach Provide a different skill set than counselors – background in business, human resources, etc. Can share cases with vendors (vendors work with client; employment consultant works with business) Some agencies serving blind and low vision consumers use internal job developers (versus vendors) because they are educated about blindness They have more success working with businesses and developing opportunities Vendors are reluctant to serve clients who are blind
- 17. Performance-Based Funding / Milestones Payments are provided for measureable outcomes Most include 3-5 milestones with payouts increasing for employment outcomes Job readiness assessment, Job placement plan, Placement, 30 days, 90 days Some states offer a tiered payment system, with higher payout rates for severity of disability or quality of placement Agencies vary on whether they will pay for a milestone more than once i.e. if a person loses their job placement
- 18. Fee-for-Service and Hourly Funding Counselor authorizes payments for services to an outside vendor Some services are paid a flat rate Some services are delivered on an hourly basis or package of hours that can be reauthorized The agency pays for services delivered, regardless of employment outcome
- 19. Job Development Service Delivery Funding models vary by agency type (n = 50) Delivery Model Blind / Low Vision (n = 12) Combined / General (n = 38) Internal n = 6; 50% n = 7; 18% Performance-based benchmarking n = 4; 33% n = 22; 58% Fee-for-service or Hourly n = 2; 17% n = 9; 24%
- 20. Internal Delivery Models ADVANTAGES Allows the agency to be more responsive to the business sector Staff are more skilled at talking with businesses and selling VR Provides in-house communication opportunities between the counselor and business consultant DISADVANTAGES Employment consultants are often a single point of contact with businesses Good for employers, but makes if hard for counselors to facilitate job development Limited number of staff so geographic gaps in services Some potential conflicts about shared cases between the employment specialist and vendors
- 21. Performance-Based Funding / Milestones ADVANTAGES Emphasizes employment outcomes A clear way to set expectations and track outcomes without paperwork Defined payment structure Risk is incurred by the provider If providers are not effective, they will likely go out of business Reduces “over-serving” consumers Cost effective DISADVANTAGES Potential for case creaming Emphasis on placement does not necessarily result in good jobs Unpredictable income, which can be difficult for small providers Lost capacity in rural areas Less communication about cases between the counselor and provider Less ability to change providers mid- stream
- 22. Fee-for-Service & Hourly Funding ADVANTAGES Counselors and providers communicate about case progress Counselors retain control of the types of services delivered Services may result in better employment fit Consumers can easily change vendors if needs are not met Funding is more predictable May entice providers to serve more rural locations DISADVANTAGES Too much time is spent negotiating services Counselors have to sign off on every hour Cases can slow down or stall out while approvals for additional funds are being negotiated Cases may languish since the funding model does not reward case closure Cases require monitoring to motivate progress towards outcomes – placement and closure
- 23. Implications from the data Rate of Rural Case Mix (n = 38; General and Combines Caseloads) Isolated Rural Small and Isolated Rural Performance-Based 3.8% 8.8% Fee-for-Service 8.3% 15.4% Internal 7.2% 16.9% Sig. .084 .120
- 24. Rapid Research Results (n = 31) Of agencies primarily using vendors or CRPs (n = 22) 86% (n = 19) say there are gaps in services in rural locations 50% use rural incentives to increase service availability Among all respondents (n = 31) 74% agree or strongly agree that incentives are necessary for increasing services rural areas
- 25. Incentives Rural incentives Drive time Mileage reimbursements Higher rates Outcome incentives Bonuses for wage thresholds or benefits Bonuses for pacing Case incentives Tiered payment schedules or higher wages for “harder-to-serve” cases “We do not currently use benchmark differentials related to the severity of the disability (and we’re on an OOS), location, or job factors, such as higher salaries or benefits obtained. This is frankly not working out too well, and hasn’t for years. We’re in the process of revamping the system to take in just that sort of variable” Alisia McKinlay, Division Director, Florida DVR
- 26. Combined models To address shortcomings of different models, some agencies have moved to hybrid models Fee-for-service with bonuses for placements, pacing, and job quality Contracted services housed within the VR office (VT) Increased opportunities for case communication; reduced need for documentation Fee-for-service payments developed on a monthly fixed rate (HI) Overcomes variations in number of referrals Helps keep smaller operations afloat May be a good rural strategy
- 27. Panel of VR Experts Betsy Hopkins Director, Maine Division of VR Jessica Adams Community Connections, Inc., Idaho Mimi Shafer Rehabilitation Area Manager in Minnesota Joe Xavier Director, California Department of Rehabilitation Susan Foley, Ph.D. Researcher, Institute for Community Inclusion, University of Massachusetts
- 28. Betsy Hopkins, M.S. Director Maine Department of Labor Division of Vocational Rehabilitation Betsy.Hopkins@maine.gov
- 29. Mimi Schafer, M.S., C.R.C. Rehabilitation Area Manager Minnesota Vocational Rehabilitation Services Mimi.Schafer@state.mn.us
- 30. Jessica Adams Program Manager Community Connections, Inc. Coeur d’Alene, ID JAdams@cciidaho.com
- 31. Joe Xavier Director California Department of Rehabilitation Joe.Xavier@dor.ca.gov
- 32. Susan Foley, Ph.D. Senior Research Fellow Institute for Community Inclusion University of Massachusetts, Boston Susan.Foley@umb.edu
- 33. Questions? Research and Training Center on Disability in Rural Communities http://rtc.ruralinstitute.umt.edu Catherine Ipsen, Ph.D. University of Montana Catherine.Ipsen@mso.umt.edu (406) 243-4562
- 34. Thank You! Research and Training Center on Disability in Rural Communities http://rtc.ruralinstitute.umt.edu Catherine Ipsen, Ph.D. University of Montana Catherine.Ipsen@mso.umt.edu (406) 243-4562