SlideShare une entreprise Scribd logo
1  sur  6
Snehal Patil | Masters of Labour Studies, B.E (Computers) 1
1. PERFORMANCE MANAGEMENT SYSTEM
There is an online Performance management system named “success factor” in Lupin Limited.
Where employee fills and carry out performance related activity online through this web
application called success factor.
The purpose of the PMS is to improve the company’s results through improved
 Performance planning
 Performance appraisals
 Compensation practices
Performance Management System Process
 Performance is reviewed every year from April to March
 Performance is linked with the workflow of each employee
 Letters are issued in the month of June of every calendar year
 Within forty-five days new joinee has to set the self targets after joining
 After employee sets his goals, progress review is done by the reviewer
 Performance is analyzed based on individual and job environment
 Overall employee performance is evaluated
 Salary is administrated.
 Training and Development plan is prepared to impart training based on performance
evaluation.
Performance appraisal is done as per the below rating scales
PSAP Performance Significantly Above Plan
PAP Performance Above Plan
PMP Performance Meets Plan
PBP Performance Below Plan
PSBP Performance Significantly Below Plan
Based upon the KRA’s assigned to each employee, each KRA is ranked on the adjoining scale as
per the below matrix
Rating and its equivalent points Score range for “Overall
Rating"
Rating Points Rating Score
PSAP Performance Significantly Above Plan 5 PSAP 451-500
PAP Performance Above Plan 4 PAP 351-450
PMP Performance Meets Plan 3 PMP 251-350
PBP Performance Below Plan 2 PBP 151-250
PSBP Performance Significantly Below Plan 1 PSBP 100-150
Snehal Patil | Masters of Labour Studies, B.E (Computers) 2
2. RESEARCH METHODOLOGY
Type and Nature of Research: The present study is descriptive and quantitative in nature
Sampling Procedure:
Sampling Frame- Employees of Lupin, Tarapur
Sample Size- The sample size is 120
Sampling Method:
Various Employees were selected from different departments on random selection under the
random sampling method. It is impossible to use the census method to collect the information.
Therefore, random sampling is done.
Areas covered:
For this survey I have covered mostly all the departments of the organization- Lupin, Tarapur
Following are the number and name of departments.
Sr.No Department No. of Employees covered
1. Quality Control 20
2. Purchase 8
3. Excise 4
4. MPP3 5
5. MPP5 5
6. CMPP 4
7. MPP8 15
8. MPP7 3
9. MPP6 6
10. Quality Assurance 5
11. PD Lab 20
12. MPP2 9
13. Accounts 6
14. MPP9 6
15. OHC 4
Total 120
Snehal Patil | Masters of Labour Studies, B.E (Computers) 3
Sources of Data Collection:
A self administered Questionnaire was used for data collection. Both closed ended and open
ended questions were included in the study. The time constraints and various other factors were
also kept in mind while framing the research methodology.
Analysis Method: Chi square test Analysis Method
In general the chi square analysis is used when there is a need to examine the similarities
between two or more populations or variables on some characteristics of interest. The reason for
using chi square test is to make inference about the population variance. It is the test of
homogeneity to study whether different departmental employees are similar in reference to some
characteristic or attribute. It is used here for testing the independence to determine whether
employee satisfaction or system effectiveness are related or independent.
Data Analysis and Interpretation:
Data Analysis Tool- the Chi Square Test was used for interpretation of effectiveness of
Performance Management System.
Data is analyzed from the set of questions prepared by me under the guidance of my mentor.
The questionnaire form was distributed to employee mentioned in the above table of various
departments to give ratings
The employee has to rate each question on his degree of satisfaction
Ratings
1- Highly Satisfied
2- Satisfied
3- Average
4- Dissatisfied
5- Highly Dissatisfied
Snehal Patil | Masters of Labour Studies, B.E (Computers) 4
Question No 1: The appraisal systemin this organization provides an opportunity for each
appraisee to have a clear understanding of what is expected from him by his reporting
Manager during the performance year
Ratings 1 2 3 4 5
Frequency 18 52 34 14 2
Ei=120/5=24
Oi Ei Oi-Ei (Oi-Ei)^2 (Oi-Ei)^2/Ei^2
18 24 -6 36 0.0625
52 24 28 784 1.361
34 24 10 100 0.173
14 24 -10 100 0.173
2 24 -22 484 0.840
Total 2.6= X2
0
10
20
30
40
50
60
Degree of
Effectiveness
E1 1 E41 4 E81 1
E2 2 E42 4 E82 3
E3 1 E43 3 E83 1
E4 2 E44 2 E84 3
E5 3 E45 2 E85 3
E6 5 E46 2 E86 2
E7 4 E47 2 E87 2
E8 3 E48 2 E88 2
E9 3 E49 3 E89 2
E10 3 E50 3 E90 2
E11 3 E51 2 E91 4
E12 2 E52 3 E92 2
E13 3 E53 2 E93 2
E14 1 E54 3 E94 3
E15 1 E55 3 E95 2
E16 1 E56 2 E96 4
E17 2 E57 4 E97 3
E18 3 E58 4 E98 1
E19 2 E59 2 E99 2
E20 2 E60 2 E100 4
E21 2 E61 2 E101 4
E22 2 E62 2 E102 1
E23 2 E63 2 E103 2
E24 2 E64 1 E104 1
E25 1 E65 1 E105 2
E26 5 E66 2 E106 2
E27 2 E67 3 E107 1
E28 3 E68 4 E108 2
E29 2 E69 1 E109 4
E30 2 E70 3 E110 4
E31 3 E71 2 E111 2
E32 2 E72 2 E112 2
E33 2 E73 1 E113 3
E34 4 E74 3 E114 2
E35 2 E75 3 E115 4
E36 3 E76 3 E116 2
E37 2 E77 3 E117 3
E38 3 E78 3 E118 3
E39 3 E79 2 E119 1
E40 3 E80 1 E120 2
Total 290
Chi Square Test Analysis
Hypothesis: Lupin employees are satisfied with
the appraisal system which provides an
opportunity to have a clear understanding of
what is expected from him by his reporting
Manager during the performance year.
Degree of Freedom (v) =n-1=5-1=4
V=4, X2, 0.05=9.49(Tabulated)
Interpretation: The calculated value of X2 is
less than the tabulated value. Hence, the
hypothesis holds true.
Conclusion: Lupin employees’ feels appraisal
system is effective to have a clear
understanding of what is expected from him by
his reporting Manager during the performance
year.
Snehal Patil | Masters of Labour Studies, B.E (Computers) 5
Question No 2: The appraisal systemprovides an opportunity for self review and reflection
Ratings 1 2 3 4 5
Frequency 22 53 28 15 2
Ei=120/5=24
Oi Ei Oi-Ei (Oi-Ei)^2 (Oi-Ei)^2/Ei^2
22 24 -2 4 0.0069
53 24 29 841 1.460
28 24 4 16 0.027
15 24 -9 81 0.140
2 24 -22 484 0.840
Total 2.47= X2
0
10
20
30
40
50
60
22
53
28
15
2
Degree of Effectiveness
E1 1 E41 4 E81 2
E2 2 E42 3 E82 4
E3 2 E43 4 E83 1
E4 3 E44 3 E84 3
E5 1 E45 2 E85 4
E6 5 E46 2 E86 1
E7 2 E47 3 E87 1
E8 3 E48 3 E88 3
E9 2 E49 4 E89 3
E10 2 E50 2 E90 2
E11 3 E51 2 E91 4
E12 1 E52 4 E92 2
E13 2 E53 2 E93 1
E14 2 E54 3 E94 2
E15 1 E55 3 E95 2
E16 3 E56 1 E96 4
E17 3 E57 4 E97 2
E18 3 E58 3 E98 1
E19 2 E59 2 E99 2
E20 2 E60 2 E100 3
E21 2 E61 2 E101 4
E22 3 E62 2 E102 1
E23 4 E63 2 E103 1
E24 2 E64 1 E104 1
E25 1 E65 1 E105 2
E26 2 E66 1 E106 3
E27 2 E67 4 E107 1
E28 2 E68 3 E108 2
E29 2 E69 2 E109 3
E30 2 E70 3 E110 3
E31 4 E71 2 E111 1
E32 2 E72 1 E112 2
E33 2 E73 2 E113 4
E34 3 E74 3 E114 2
E35 2 E75 2 E115 5
E36 3 E76 2 E116 2
E37 3 E77 2 E117 2
E38 2 E78 2 E118 4
E39 2 E79 2 E119 1
E40 3 E80 1 E120 2
Total 282
Chi Square Test Analysis
Hypothesis: Lupin employees are satisfied with
the appraisal system which provides them an
opportunity for self review and reflection
reviews would be effective
Degree of Freedom (v) =n-1=5-1=4
V=4, X2, 0.05=9.49(Tabulated)
Interpretation: The calculated value of X2 is
less than the tabulated value. Hence, the
hypothesis holds true.
Conclusion: Lupin employees are satisfied and
feel that appraisal system is effective for self
review and reflection.
Snehal Patil | Masters of Labour Studies, B.E (Computers) 6
3. COMPARATIVE DATA ANALYSIS
Question No Chi Square Test Score Weighted Average Score
1. 2.6 2.4
2. 2.47 2.3
3. 1.92 2.3
4. 2.17 2.5
5. 2.75 2.4
6. 1.62 2.4
7. 1.96 2.4
8. 3 2.5
9. 2.24 2.5
10. 2.26 2.5
11. 1.9 2.9
12. 2.82 2.7
13. 2.77 2.6
14. 1.77 2.4
15. 2.23 2.5
16. 2.11 2.4
17. 1.95 2.4
18. 3.06 2.5
19. 3.95 2.5
20. 3.2 2.5
21. 2.74 2.4
Mean 2.45 2.47
Median 2.26 2.5
The mean is the average
The median is the middle of a the data
Note: Weighted Average Score is a total score divided by 120
Example: Q.1 Total Score=290 Therefore, Weighted Average Score 290/120=2.4
0%
57%
38%
5%
Degree ofEffectiveness ofthe Performance Management System ofLupin
Highly Satisfied
Satisfied
Average
Dissatisfied
Highly dissatisfied

Contenu connexe

Tendances

Tendances (20)

Topic7.1c compensation how_to_createa_market-competitive_payplannew
Topic7.1c compensation how_to_createa_market-competitive_payplannewTopic7.1c compensation how_to_createa_market-competitive_payplannew
Topic7.1c compensation how_to_createa_market-competitive_payplannew
 
Chapter 4 (1)
Chapter 4 (1)Chapter 4 (1)
Chapter 4 (1)
 
Job Evaluation Point Method
Job Evaluation Point MethodJob Evaluation Point Method
Job Evaluation Point Method
 
Job evaluation
Job evaluationJob evaluation
Job evaluation
 
Hay summary
Hay summaryHay summary
Hay summary
 
Job evaluation eng
Job evaluation engJob evaluation eng
Job evaluation eng
 
Job Evaluation
Job EvaluationJob Evaluation
Job Evaluation
 
Hay guide chart.pptx [autosaved]
Hay guide chart.pptx [autosaved]Hay guide chart.pptx [autosaved]
Hay guide chart.pptx [autosaved]
 
Job evaluation
Job evaluationJob evaluation
Job evaluation
 
Pms( dcted)
Pms( dcted)Pms( dcted)
Pms( dcted)
 
Pay and Compensation
Pay and CompensationPay and Compensation
Pay and Compensation
 
Interpretive Structural Modeling based analysis for Critical Failure Factors ...
Interpretive Structural Modeling based analysis for Critical Failure Factors ...Interpretive Structural Modeling based analysis for Critical Failure Factors ...
Interpretive Structural Modeling based analysis for Critical Failure Factors ...
 
Ch 4 merit rating and job details
Ch 4 merit rating and job detailsCh 4 merit rating and job details
Ch 4 merit rating and job details
 
Job evaluation
Job evaluationJob evaluation
Job evaluation
 
All you need to know about implementing the Paterson Job Grading system
All you need to know about implementing the Paterson Job Grading systemAll you need to know about implementing the Paterson Job Grading system
All you need to know about implementing the Paterson Job Grading system
 
Job evaluation-hay-method reb
Job evaluation-hay-method rebJob evaluation-hay-method reb
Job evaluation-hay-method reb
 
Job evaluation
Job evaluationJob evaluation
Job evaluation
 
Job evaluation
Job evaluationJob evaluation
Job evaluation
 
Job evaluation
Job evaluationJob evaluation
Job evaluation
 
Point method in job evaluation ppt
Point method in job evaluation pptPoint method in job evaluation ppt
Point method in job evaluation ppt
 

En vedette

25/5/11 MediaKey /// Tutti pazzi per i Krumiri Bistefani
25/5/11 MediaKey /// Tutti pazzi per i Krumiri Bistefani25/5/11 MediaKey /// Tutti pazzi per i Krumiri Bistefani
25/5/11 MediaKey /// Tutti pazzi per i Krumiri BistefaniTunnel Studios
 
vsource - Smarter Talent Acquisition
vsource - Smarter Talent Acquisitionvsource - Smarter Talent Acquisition
vsource - Smarter Talent AcquisitionCuong Tran
 
Big brothers, big sisters: helping young children since 1904
Big brothers, big sisters: helping young children since 1904�Big brothers, big sisters: helping young children since 1904�
Big brothers, big sisters: helping young children since 1904Yosef Meystel
 
ขยะมูลฝอย - ชุมชนหนองสระพัง
ขยะมูลฝอย - ชุมชนหนองสระพังขยะมูลฝอย - ชุมชนหนองสระพัง
ขยะมูลฝอย - ชุมชนหนองสระพังMooThong Chaisiri Chong
 
Mr Bell - A Life in Pictures
Mr Bell - A Life in PicturesMr Bell - A Life in Pictures
Mr Bell - A Life in PicturesRichard Dixon
 
Storyboard for Sample Script idea - John B
Storyboard for Sample Script idea - John BStoryboard for Sample Script idea - John B
Storyboard for Sample Script idea - John Brhsmediastudies
 
Big brothers big sisters
Big brothers big sistersBig brothers big sisters
Big brothers big sistersjwp1121
 
Category Plan Latte Fresco PS
Category Plan Latte Fresco PSCategory Plan Latte Fresco PS
Category Plan Latte Fresco PSTiziano Tassi
 
Automate Your Marketing - Planning Ahead to Convert and Keep
Automate Your Marketing - Planning Ahead to Convert and KeepAutomate Your Marketing - Planning Ahead to Convert and Keep
Automate Your Marketing - Planning Ahead to Convert and KeepBria Sullivan
 
Prácticas Sociales del Lenguaje
Prácticas Sociales del LenguajePrácticas Sociales del Lenguaje
Prácticas Sociales del LenguajeYanciCota
 
Circular Textiles Program
Circular Textiles Program Circular Textiles Program
Circular Textiles Program Helene Smits
 

En vedette (13)

Sample Script - Tara
Sample Script - TaraSample Script - Tara
Sample Script - Tara
 
25/5/11 MediaKey /// Tutti pazzi per i Krumiri Bistefani
25/5/11 MediaKey /// Tutti pazzi per i Krumiri Bistefani25/5/11 MediaKey /// Tutti pazzi per i Krumiri Bistefani
25/5/11 MediaKey /// Tutti pazzi per i Krumiri Bistefani
 
vsource - Smarter Talent Acquisition
vsource - Smarter Talent Acquisitionvsource - Smarter Talent Acquisition
vsource - Smarter Talent Acquisition
 
Big brothers, big sisters: helping young children since 1904
Big brothers, big sisters: helping young children since 1904�Big brothers, big sisters: helping young children since 1904�
Big brothers, big sisters: helping young children since 1904
 
Mood Board - Daniel N
Mood Board - Daniel NMood Board - Daniel N
Mood Board - Daniel N
 
ขยะมูลฝอย - ชุมชนหนองสระพัง
ขยะมูลฝอย - ชุมชนหนองสระพังขยะมูลฝอย - ชุมชนหนองสระพัง
ขยะมูลฝอย - ชุมชนหนองสระพัง
 
Mr Bell - A Life in Pictures
Mr Bell - A Life in PicturesMr Bell - A Life in Pictures
Mr Bell - A Life in Pictures
 
Storyboard for Sample Script idea - John B
Storyboard for Sample Script idea - John BStoryboard for Sample Script idea - John B
Storyboard for Sample Script idea - John B
 
Big brothers big sisters
Big brothers big sistersBig brothers big sisters
Big brothers big sisters
 
Category Plan Latte Fresco PS
Category Plan Latte Fresco PSCategory Plan Latte Fresco PS
Category Plan Latte Fresco PS
 
Automate Your Marketing - Planning Ahead to Convert and Keep
Automate Your Marketing - Planning Ahead to Convert and KeepAutomate Your Marketing - Planning Ahead to Convert and Keep
Automate Your Marketing - Planning Ahead to Convert and Keep
 
Prácticas Sociales del Lenguaje
Prácticas Sociales del LenguajePrácticas Sociales del Lenguaje
Prácticas Sociales del Lenguaje
 
Circular Textiles Program
Circular Textiles Program Circular Textiles Program
Circular Textiles Program
 

Similaire à PERFORMANCE MANAGEMENT SYSTEM

Performance Based Appraisal System For Teachers of University/colleges
Performance Based Appraisal System For Teachers of University/collegesPerformance Based Appraisal System For Teachers of University/colleges
Performance Based Appraisal System For Teachers of University/collegesIRJET Journal
 
JOB EVALUATIhhuuuiiiiiiiuuuhhi999oiiON.ppt
JOB EVALUATIhhuuuiiiiiiiuuuhhi999oiiON.pptJOB EVALUATIhhuuuiiiiiiiuuuhhi999oiiON.ppt
JOB EVALUATIhhuuuiiiiiiiuuuhhi999oiiON.pptdoremonlovers365
 
Performance Appraisal Project
Performance Appraisal ProjectPerformance Appraisal Project
Performance Appraisal ProjectKatelan Blake
 
Performance_Management_System_NTPC_Inter.pdf
Performance_Management_System_NTPC_Inter.pdfPerformance_Management_System_NTPC_Inter.pdf
Performance_Management_System_NTPC_Inter.pdfSubhasmitaBehera46
 
Two Views of Ops Excellence
Two Views of Ops ExcellenceTwo Views of Ops Excellence
Two Views of Ops ExcellenceWalter Taraska
 
A Study on the HR Processes and its Perception by employees of ONGC
A Study on the HR Processes and its Perception by employees of ONGCA Study on the HR Processes and its Perception by employees of ONGC
A Study on the HR Processes and its Perception by employees of ONGCSunny Herenz
 
A STUDENT PERFORMANCE APPRAISEL STUDY
A STUDENT PERFORMANCE APPRAISEL STUDYA STUDENT PERFORMANCE APPRAISEL STUDY
A STUDENT PERFORMANCE APPRAISEL STUDYT HARI KUMAR
 
CHAPTER 3,4 and 5.docx
CHAPTER 3,4 and 5.docxCHAPTER 3,4 and 5.docx
CHAPTER 3,4 and 5.docxteza bekele
 
Job evaluation and grading – process and systems
Job evaluation and grading  – process and systemsJob evaluation and grading  – process and systems
Job evaluation and grading – process and systemsCharles Cotter, PhD
 
Presentasi tugas akhir
Presentasi tugas akhirPresentasi tugas akhir
Presentasi tugas akhirDedi Dedi
 
OnTrac_StarCertificationProgram-3Day.pptx
OnTrac_StarCertificationProgram-3Day.pptxOnTrac_StarCertificationProgram-3Day.pptx
OnTrac_StarCertificationProgram-3Day.pptxNilaanjanTripathy1
 
Mapping Arizona's Future with Performance Management
Mapping Arizona's Future with Performance ManagementMapping Arizona's Future with Performance Management
Mapping Arizona's Future with Performance ManagementMarnie Green
 
BHEL performance management system
BHEL performance management systemBHEL performance management system
BHEL performance management systemanjali5491
 

Similaire à PERFORMANCE MANAGEMENT SYSTEM (20)

Performance Based Appraisal System For Teachers of University/colleges
Performance Based Appraisal System For Teachers of University/collegesPerformance Based Appraisal System For Teachers of University/colleges
Performance Based Appraisal System For Teachers of University/colleges
 
performance appraisal
performance appraisalperformance appraisal
performance appraisal
 
Pms manual
Pms manualPms manual
Pms manual
 
JOB EVALUATIhhuuuiiiiiiiuuuhhi999oiiON.ppt
JOB EVALUATIhhuuuiiiiiiiuuuhhi999oiiON.pptJOB EVALUATIhhuuuiiiiiiiuuuhhi999oiiON.ppt
JOB EVALUATIhhuuuiiiiiiiuuuhhi999oiiON.ppt
 
Performance Appraisal Project
Performance Appraisal ProjectPerformance Appraisal Project
Performance Appraisal Project
 
Performance_Management_System_NTPC_Inter.pdf
Performance_Management_System_NTPC_Inter.pdfPerformance_Management_System_NTPC_Inter.pdf
Performance_Management_System_NTPC_Inter.pdf
 
Two Views of Ops Excellence
Two Views of Ops ExcellenceTwo Views of Ops Excellence
Two Views of Ops Excellence
 
A Study on the HR Processes and its Perception by employees of ONGC
A Study on the HR Processes and its Perception by employees of ONGCA Study on the HR Processes and its Perception by employees of ONGC
A Study on the HR Processes and its Perception by employees of ONGC
 
Unit%2009%20-%20Job%20Evaluation.pdf
Unit%2009%20-%20Job%20Evaluation.pdfUnit%2009%20-%20Job%20Evaluation.pdf
Unit%2009%20-%20Job%20Evaluation.pdf
 
A STUDENT PERFORMANCE APPRAISEL STUDY
A STUDENT PERFORMANCE APPRAISEL STUDYA STUDENT PERFORMANCE APPRAISEL STUDY
A STUDENT PERFORMANCE APPRAISEL STUDY
 
Module 1 - CBM.pptx
Module 1 - CBM.pptxModule 1 - CBM.pptx
Module 1 - CBM.pptx
 
CHAPTER 3,4 and 5.docx
CHAPTER 3,4 and 5.docxCHAPTER 3,4 and 5.docx
CHAPTER 3,4 and 5.docx
 
Job evaluation and grading – process and systems
Job evaluation and grading  – process and systemsJob evaluation and grading  – process and systems
Job evaluation and grading – process and systems
 
Presentasi tugas akhir
Presentasi tugas akhirPresentasi tugas akhir
Presentasi tugas akhir
 
pm-pa.ppt
pm-pa.pptpm-pa.ppt
pm-pa.ppt
 
2. FINAL PROJECT.pdf
2. FINAL PROJECT.pdf2. FINAL PROJECT.pdf
2. FINAL PROJECT.pdf
 
Job evaluation
Job evaluationJob evaluation
Job evaluation
 
OnTrac_StarCertificationProgram-3Day.pptx
OnTrac_StarCertificationProgram-3Day.pptxOnTrac_StarCertificationProgram-3Day.pptx
OnTrac_StarCertificationProgram-3Day.pptx
 
Mapping Arizona's Future with Performance Management
Mapping Arizona's Future with Performance ManagementMapping Arizona's Future with Performance Management
Mapping Arizona's Future with Performance Management
 
BHEL performance management system
BHEL performance management systemBHEL performance management system
BHEL performance management system
 

PERFORMANCE MANAGEMENT SYSTEM

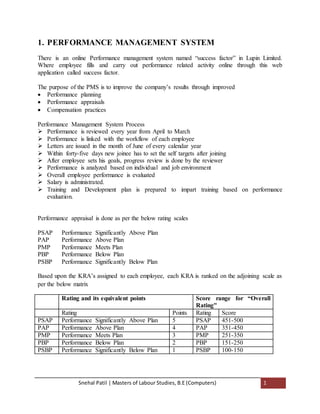
  • 1. Snehal Patil | Masters of Labour Studies, B.E (Computers) 1 1. PERFORMANCE MANAGEMENT SYSTEM There is an online Performance management system named “success factor” in Lupin Limited. Where employee fills and carry out performance related activity online through this web application called success factor. The purpose of the PMS is to improve the company’s results through improved  Performance planning  Performance appraisals  Compensation practices Performance Management System Process  Performance is reviewed every year from April to March  Performance is linked with the workflow of each employee  Letters are issued in the month of June of every calendar year  Within forty-five days new joinee has to set the self targets after joining  After employee sets his goals, progress review is done by the reviewer  Performance is analyzed based on individual and job environment  Overall employee performance is evaluated  Salary is administrated.  Training and Development plan is prepared to impart training based on performance evaluation. Performance appraisal is done as per the below rating scales PSAP Performance Significantly Above Plan PAP Performance Above Plan PMP Performance Meets Plan PBP Performance Below Plan PSBP Performance Significantly Below Plan Based upon the KRA’s assigned to each employee, each KRA is ranked on the adjoining scale as per the below matrix Rating and its equivalent points Score range for “Overall Rating" Rating Points Rating Score PSAP Performance Significantly Above Plan 5 PSAP 451-500 PAP Performance Above Plan 4 PAP 351-450 PMP Performance Meets Plan 3 PMP 251-350 PBP Performance Below Plan 2 PBP 151-250 PSBP Performance Significantly Below Plan 1 PSBP 100-150
  • 2. Snehal Patil | Masters of Labour Studies, B.E (Computers) 2 2. RESEARCH METHODOLOGY Type and Nature of Research: The present study is descriptive and quantitative in nature Sampling Procedure: Sampling Frame- Employees of Lupin, Tarapur Sample Size- The sample size is 120 Sampling Method: Various Employees were selected from different departments on random selection under the random sampling method. It is impossible to use the census method to collect the information. Therefore, random sampling is done. Areas covered: For this survey I have covered mostly all the departments of the organization- Lupin, Tarapur Following are the number and name of departments. Sr.No Department No. of Employees covered 1. Quality Control 20 2. Purchase 8 3. Excise 4 4. MPP3 5 5. MPP5 5 6. CMPP 4 7. MPP8 15 8. MPP7 3 9. MPP6 6 10. Quality Assurance 5 11. PD Lab 20 12. MPP2 9 13. Accounts 6 14. MPP9 6 15. OHC 4 Total 120
  • 3. Snehal Patil | Masters of Labour Studies, B.E (Computers) 3 Sources of Data Collection: A self administered Questionnaire was used for data collection. Both closed ended and open ended questions were included in the study. The time constraints and various other factors were also kept in mind while framing the research methodology. Analysis Method: Chi square test Analysis Method In general the chi square analysis is used when there is a need to examine the similarities between two or more populations or variables on some characteristics of interest. The reason for using chi square test is to make inference about the population variance. It is the test of homogeneity to study whether different departmental employees are similar in reference to some characteristic or attribute. It is used here for testing the independence to determine whether employee satisfaction or system effectiveness are related or independent. Data Analysis and Interpretation: Data Analysis Tool- the Chi Square Test was used for interpretation of effectiveness of Performance Management System. Data is analyzed from the set of questions prepared by me under the guidance of my mentor. The questionnaire form was distributed to employee mentioned in the above table of various departments to give ratings The employee has to rate each question on his degree of satisfaction Ratings 1- Highly Satisfied 2- Satisfied 3- Average 4- Dissatisfied 5- Highly Dissatisfied
  • 4. Snehal Patil | Masters of Labour Studies, B.E (Computers) 4 Question No 1: The appraisal systemin this organization provides an opportunity for each appraisee to have a clear understanding of what is expected from him by his reporting Manager during the performance year Ratings 1 2 3 4 5 Frequency 18 52 34 14 2 Ei=120/5=24 Oi Ei Oi-Ei (Oi-Ei)^2 (Oi-Ei)^2/Ei^2 18 24 -6 36 0.0625 52 24 28 784 1.361 34 24 10 100 0.173 14 24 -10 100 0.173 2 24 -22 484 0.840 Total 2.6= X2 0 10 20 30 40 50 60 Degree of Effectiveness E1 1 E41 4 E81 1 E2 2 E42 4 E82 3 E3 1 E43 3 E83 1 E4 2 E44 2 E84 3 E5 3 E45 2 E85 3 E6 5 E46 2 E86 2 E7 4 E47 2 E87 2 E8 3 E48 2 E88 2 E9 3 E49 3 E89 2 E10 3 E50 3 E90 2 E11 3 E51 2 E91 4 E12 2 E52 3 E92 2 E13 3 E53 2 E93 2 E14 1 E54 3 E94 3 E15 1 E55 3 E95 2 E16 1 E56 2 E96 4 E17 2 E57 4 E97 3 E18 3 E58 4 E98 1 E19 2 E59 2 E99 2 E20 2 E60 2 E100 4 E21 2 E61 2 E101 4 E22 2 E62 2 E102 1 E23 2 E63 2 E103 2 E24 2 E64 1 E104 1 E25 1 E65 1 E105 2 E26 5 E66 2 E106 2 E27 2 E67 3 E107 1 E28 3 E68 4 E108 2 E29 2 E69 1 E109 4 E30 2 E70 3 E110 4 E31 3 E71 2 E111 2 E32 2 E72 2 E112 2 E33 2 E73 1 E113 3 E34 4 E74 3 E114 2 E35 2 E75 3 E115 4 E36 3 E76 3 E116 2 E37 2 E77 3 E117 3 E38 3 E78 3 E118 3 E39 3 E79 2 E119 1 E40 3 E80 1 E120 2 Total 290 Chi Square Test Analysis Hypothesis: Lupin employees are satisfied with the appraisal system which provides an opportunity to have a clear understanding of what is expected from him by his reporting Manager during the performance year. Degree of Freedom (v) =n-1=5-1=4 V=4, X2, 0.05=9.49(Tabulated) Interpretation: The calculated value of X2 is less than the tabulated value. Hence, the hypothesis holds true. Conclusion: Lupin employees’ feels appraisal system is effective to have a clear understanding of what is expected from him by his reporting Manager during the performance year.
  • 5. Snehal Patil | Masters of Labour Studies, B.E (Computers) 5 Question No 2: The appraisal systemprovides an opportunity for self review and reflection Ratings 1 2 3 4 5 Frequency 22 53 28 15 2 Ei=120/5=24 Oi Ei Oi-Ei (Oi-Ei)^2 (Oi-Ei)^2/Ei^2 22 24 -2 4 0.0069 53 24 29 841 1.460 28 24 4 16 0.027 15 24 -9 81 0.140 2 24 -22 484 0.840 Total 2.47= X2 0 10 20 30 40 50 60 22 53 28 15 2 Degree of Effectiveness E1 1 E41 4 E81 2 E2 2 E42 3 E82 4 E3 2 E43 4 E83 1 E4 3 E44 3 E84 3 E5 1 E45 2 E85 4 E6 5 E46 2 E86 1 E7 2 E47 3 E87 1 E8 3 E48 3 E88 3 E9 2 E49 4 E89 3 E10 2 E50 2 E90 2 E11 3 E51 2 E91 4 E12 1 E52 4 E92 2 E13 2 E53 2 E93 1 E14 2 E54 3 E94 2 E15 1 E55 3 E95 2 E16 3 E56 1 E96 4 E17 3 E57 4 E97 2 E18 3 E58 3 E98 1 E19 2 E59 2 E99 2 E20 2 E60 2 E100 3 E21 2 E61 2 E101 4 E22 3 E62 2 E102 1 E23 4 E63 2 E103 1 E24 2 E64 1 E104 1 E25 1 E65 1 E105 2 E26 2 E66 1 E106 3 E27 2 E67 4 E107 1 E28 2 E68 3 E108 2 E29 2 E69 2 E109 3 E30 2 E70 3 E110 3 E31 4 E71 2 E111 1 E32 2 E72 1 E112 2 E33 2 E73 2 E113 4 E34 3 E74 3 E114 2 E35 2 E75 2 E115 5 E36 3 E76 2 E116 2 E37 3 E77 2 E117 2 E38 2 E78 2 E118 4 E39 2 E79 2 E119 1 E40 3 E80 1 E120 2 Total 282 Chi Square Test Analysis Hypothesis: Lupin employees are satisfied with the appraisal system which provides them an opportunity for self review and reflection reviews would be effective Degree of Freedom (v) =n-1=5-1=4 V=4, X2, 0.05=9.49(Tabulated) Interpretation: The calculated value of X2 is less than the tabulated value. Hence, the hypothesis holds true. Conclusion: Lupin employees are satisfied and feel that appraisal system is effective for self review and reflection.
  • 6. Snehal Patil | Masters of Labour Studies, B.E (Computers) 6 3. COMPARATIVE DATA ANALYSIS Question No Chi Square Test Score Weighted Average Score 1. 2.6 2.4 2. 2.47 2.3 3. 1.92 2.3 4. 2.17 2.5 5. 2.75 2.4 6. 1.62 2.4 7. 1.96 2.4 8. 3 2.5 9. 2.24 2.5 10. 2.26 2.5 11. 1.9 2.9 12. 2.82 2.7 13. 2.77 2.6 14. 1.77 2.4 15. 2.23 2.5 16. 2.11 2.4 17. 1.95 2.4 18. 3.06 2.5 19. 3.95 2.5 20. 3.2 2.5 21. 2.74 2.4 Mean 2.45 2.47 Median 2.26 2.5 The mean is the average The median is the middle of a the data Note: Weighted Average Score is a total score divided by 120 Example: Q.1 Total Score=290 Therefore, Weighted Average Score 290/120=2.4 0% 57% 38% 5% Degree ofEffectiveness ofthe Performance Management System ofLupin Highly Satisfied Satisfied Average Dissatisfied Highly dissatisfied