
Recommandé
Contenu connexe
Tendances
Tendances (20)
En vedette
En vedette (13)
Similaire à nuweahermarketslinkedaug26
Similaire à nuweahermarketslinkedaug26 (20)
nuweahermarketslinkedaug26
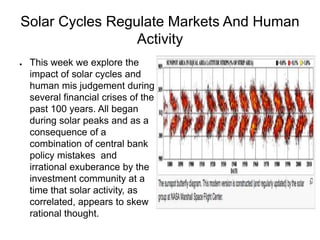
- 1. Solar Cycles Regulate Markets And Human Activity ● This week we explore the impact of solar cycles and human mis judgement during several financial crises of the past 100 years. All began during solar peaks and as a consequence of a combination of central bank policy mistakes and irrational exuberance by the investment community at a time that solar activity, as correlated, appears to skew rational thought.
- 2. Solar Cycle History ● While it is evident that solar peaks are aligned with stock market peaks the correlation with the real economy is not quite as phased. In fact, it may be argued that stock market illiquidity is often followed economic decline at some forward time interval.
- 3. Solar Cycles and Inflation ● The link to commodity inflation seems more straight forward and sometimes regardless of money supply and velocity considerations as was the case in the 1920s preceding the Great Depression.
- 4. The Not So Roaring 20s ● Despite tremendous gains in the stock market the U.S. And rising commodity prices during a second solar max following a massive one during WW1 Money supply steadily diminished during the 1920s.
- 5. 1929 and 2008 Comparison ● Interestingly, despite a decline in m1 m2 during the 1920s , money velocity spiked just before the crash. Then, massive monetary deceleration followed leading to a massive deflationary bond rally. Similar conditions are underway now as velocity generally remains in a downtrend.
- 6. Monet Supply Vs Velocity ● Interestingly m2 money supply increased rapidly into 2009 even as velocity slowed Much of that liquidity migrated first to treasury securies and eventually to other fixed income securities as the search for yield was on in an era of falling interest rates. That phenomena persists today.
- 7. Insolvency Vs Illiquidity ● This is a key distinction given the data as indicated. The crisis in 2008 was not a sudden liquidity problem as it was in 1929. It was a solvency and likely a political crisis given the nature of the selloff and its timing with respect to presidential polls. This was a classic crisis of confidence manifest as a systemic meltdown. Unfortunately Fed policy action has left nothing “in yhe tank”
- 8. Corp & Treasuries During Crisis ● In my estimation the corporate bond sell off in 2007-2008 indicates the crisis was a solvency issue; not a liquidity issue. The fed response precludes it from responding to a solar and temperature induced deflation crisis now and going forward until the solar minimum.
- 9. Swap Spreads at 2009 Lows ● It is notable that corporate swap spreads are at similar levels as at the March 2009 lows in the overall market and at the v shaped beginning of a tremendous bull market.
- 10. Corporate and Long Treasuries Now ● Corporate bond action is and has been MUCH healthier overall during this 19 month sideways correction. Price appreciation there all around.
- 11. All 20% declines at Solar Peaks ● For a variety of reasons all annual 20% declines in the total stock market have occurred at solar maxes and for a variety of reasons concerning human mis judgement. None have occurred at solar minimums even when ongoing deflation occurs. Commodity inflation is not necessary for overall equity price appreciation. In fact, the opposite is likely healthy for markets with attending lower inflation.
- 12. Why The Phillips Curve is Fictional
- 13. However! ● Not to sound contradictory but employment rates ARE tied to manufacturing output and consumption and worker productivity. Competitive efficiencies keep interest rates and inflation low relative to nominal wages, made systemically more valuable in such conditions. Similar to businesses, individuals become more valuable when they are able efficiently retain earnings. It's all “One”
- 14. Chinese Copper Imports ● On to current global conditions. Suddenly and following recent annual cyclicality, China copper imports are down; a good proxy for industrial production. They see winter approaching quickly.
- 15. Copper Inventories spiking ● As imports diminish inventories are surging. This favors domestic U.S. Stocks and a stronger dollar as China may weaken currency to spur exports again. Rinse, wash repeat. U.S. Domestic input costs can drop as strength comes from service sector; not so much manufacturing exports. Continuing diminishing low solar induced market behavior.
- 16. Post 2008 AGW Scare ● The chinese and others essentially cornered the commodities markets artificially bidding up prices in response to peak commodity supplies from manmade global warming. The opposite is occurring as the sun goes quiet and George Soros goes to war with China and Russia given his bad advise.
- 17. Crude Inventory Change ● Rig counts up. Supply Up. Seasonal price weakness approaches fast. Just sayin.
- 18. Urban Consumer Inflation ● Seasonal cyclical price deflation begins anew near and far. Given diminishing solar into 2022 or beyond that this won't continue with disinflation or outright deflation in the fall and winter an some price firming during Spring and early summer. It's all about the sun and temperature variance as people as mammals hibernate and slow down.
- 19. Treasuries Vs. S&P Yield ● With inflation easing again it is notable that the spread between the 10 tr note and the S&P is about 80 basis points. (1.57% vs 2.55%) Assuming treasury yields ramain that low or even fall, with any earnings improvement from lower input costs and sustainable PE multiples, the S&P would need to appreciate about 90% to reach par at current spreads (presuming my math is correct)
- 20. Weekly Sentiment ● Weekly AAII sentiment havedropped back to the highs 20s. As a contrary indicator, that's bullish. It's remained below 40% for months. Again, consistent with rational subdued thinking and low solar.
- 21. 50 Day Moving Average Turns ● Perhaps another bullish sign; the 50 day moving average is turning higher.