TSI benchmarks - May '15
•
0 j'aime•265 vues

Year-on-year comparisons for TSI's Asian benchmark prices (iron ore, metallurgical coal, asean HRC).

Recommandé
Recommandé
Contenu connexe
Tendances
Tendances (9)
En vedette
En vedette (20)
Similaire à TSI benchmarks - May '15
Similaire à TSI benchmarks - May '15 (17)
Plus de Tim Hard
Plus de Tim Hard (20)
Dernier
Dernier (20)
TSI benchmarks - May '15
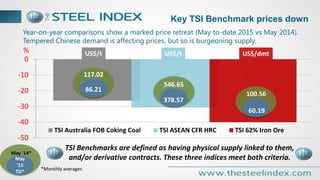
- 1. TSI Benchmarks are defined as having physical supply linked to them, and/or derivative contracts. These three indices meet both criteria. Year-on-year comparisons show a marked price retreat (May to-date 2015 vs May 2014). Tempered Chinese demand is affecting prices, but so is burgeoning supply. Key TSI Benchmark prices down May ‘15 TD* May ’14* -50 -40 -30 -20 -10 0 TSI Australia FOB Coking Coal TSI ASEAN CFR HRC TSI 62% Iron Ore 117.02 86.21 546.65 378.57 100.56 60.19 US$/t US$/dmtUS$/t% *Monthly averages
- 2. Source: Australian Bureau of statistics Source: China Customs Data 2 3 4 5 6 7 8 2013 2014 2015 January February March 10 11 12 13 14 15 16 17 2013 2014 2015 January February March Australian Metallurgical Coal Exports Chinese Metallurgical Coal Imports MillionTonnes MillionTonnes Supply and demand in key producing and consuming nations are heading in different directions Coking coal supply/demand mismatch Prices are a function of supply and demand. Weakness in coking coal prices recently are highly explicable when viewing 3 year trends on production levels and consumption levels. A demand pick-up in China is anticipated, but will it reverse a hitherto structural trend? Source: Australian Bureau of statistics Source: China Customs Data