Z Score,T Score, Percential Rank and Box Plot Graph
Creating a SWIS Summary Report 1 2010
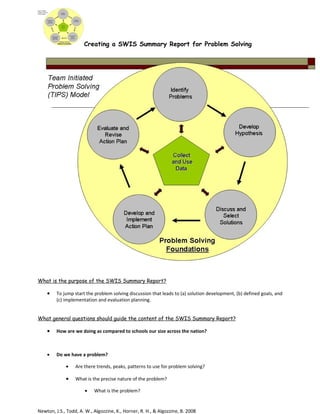
1. Creating a SWIS Summary Report for Problem Solving
What is the purpose of the SWIS Summary Report?
• To jump start the problem solving discussion that leads to (a) solution development, (b) defined goals, and
(c) implementation and evaluation planning.
What general questions should guide the content of the SWIS Summary Report?
• How are we doing as compared to schools our size across the nation?
• Do we have a problem?
• Are there trends, peaks, patterns to use for problem solving?
• What is the precise nature of the problem?
• What is the problem?
Newton, J.S., Todd, A. W., Algozzine, K., Horner, R. H., & Algozzine, B. 2008
2. Creating a SWIS Summary Report for Problem Solving
• Where is the problem occurring?
• When is the problem occurring?
• Who is contributing to the problem?
• Why is the problem occurring?
• What is the status of previous problems?
• Do we still have a problem? Are there trends, peaks, patterns to use for problem solving?
• What is the precise nature of the problem?
What is the problem?
Where is the problem occurring?
When is the problem occurring?
Newton, J.S., Todd, A. W., Algozzine, K., Horner, R. H., & Algozzine, B. 2008
3. Creating a SWIS Summary Report for Problem Solving
Who is contributing to the problem?
Why is the problem occurring?
Who creates the SWIS Summary Report?
• The data analyst and/or back up data analyst
When should the summary report be created?
• Ideally, the report should be created the day prior to the meeting, but if that is not an option, the report
should be created during the week of the meeting. Regularly ensure that the data entry schedule fits the
needs of the reporting cycle.
What reports are useful?
• Two summary reports are useful for getting started, for answering the general questions, and for
generating more questions to ask of the data.
1. A summary to review the status of current trends and patterns
Newton, J.S., Todd, A. W., Algozzine, K., Horner, R. H., & Algozzine, B. 2008
4. Creating a SWIS Summary Report for Problem Solving
2. A summary to review the status of previously identified problems
Newton, J.S., Todd, A. W., Algozzine, K., Horner, R. H., & Algozzine, B. 2008
5. Creating a SWIS Summary Report for Problem Solving
How are those reports created?
For each report, report the type of data needed for analysis, consistently on all tables and graphs
• Office discipline referrals only
• Minors only
• Both, ODRs and Minors
To copy the graph into a different document
1. Click on the report
2. Copy the image
3. Paste image into a Word/ PowerPoint document
Report #1: Review of current status of current trends and patterns
1. Generate Average Referral per day month graph for the current school year
a. Main menu on SWIS
Newton, J.S., Todd, A. W., Algozzine, K., Horner, R. H., & Algozzine, B. 2008
6. Creating a SWIS Summary Report for Problem Solving
b. Click on average per day per month
c. Choose type of report (majors only, minors only, or both)
d. Generate report
e. Click on report, copy image
f. Go to word document and paste, size to fit
2. Generate Average Referral per day month graph for previous years
a. Main menu on SWIS
b. Click on average per day per month
c. Choose type of report (majors only, minors only, or both)
d. Choose multi-year report
e. Generate report
Newton, J.S., Todd, A. W., Algozzine, K., Horner, R. H., & Algozzine, B. 2008
7. Creating a SWIS Summary Report for Problem Solving
f. Click on report, copy
g. Go to word document and paste, size to fit
3. Build a precision problem statement
a. Generate the SWIS graphs or tables to answer the general questions
a. For current year, create five graphs to show data for the What, Where, When, Who,
and Why questions
b. Go to the SWIS Main Menu
c. Click on the report needed
d. Choose the type of report (minors, office discipline referrals, all)
a. If a table is needed, click that box
b. If different reporting start and end dates are needed, make the necessary
changes in the date boxes
e. Click on Generate Report
To create a report for ‘why’ the problem behaviors are occurring, for this year
a. Main Menu on SWIS
1. Click on other reports
2. Click on custom graph
3. Choose graph type, ‘motivation’
Newton, J.S., Todd, A. W., Algozzine, K., Horner, R. H., & Algozzine, B. 2008
8. Creating a SWIS Summary Report for Problem Solving
4. Generate report
Report #2: Review of previous problems
Create custom reports and graphs to review the status of the previous problem and
associated decisions from previous meeting minutes.
1. From Main Menu of SWIS, click on Other Reports
2. Click on Custom Graph, click on categories to narrow the database to answer questions
Report #1
Example from SWIS demo (office discipline referrals only)
Newton, J.S., Todd, A. W., Algozzine, K., Horner, R. H., & Algozzine, B. 2008
9. Creating a SWIS Summary Report for Problem Solving
To answer the question in Report #1 about ‘do we have a problem?’ we need to calculate the mean
number of major office discipline referrals per 100 students per school day using the SWIS summary.
First calculate the number of 100 students based on the total enrollment in your school (i.e. a school of
Newton, J.S., Todd, A. W., Algozzine, K., Horner, R. H., & Algozzine, B. 2008
10. Creating a SWIS Summary Report for Problem Solving
600 has 6 one hundreds, a school of 1250 have 12.5 one hundreds). Next, use the SWIS Summary table
below to calculate the mean ODRs per 100 students in your school, by using the grade range data that
your school fits.
For example: an elementary school of 600 students can expect two major office discipline
referrals per day (6 X .3) as compared to 2,162 other elementary schools. A middle school of 600
students can expect 5.1 major office discipline referrals per day (6 X .85) as compared to 602 other
middle schools in the set of data.
Newton, J.S., Todd, A. W., Algozzine, K., Horner, R. H., & Algozzine, B. 2008
11. Creating a SWIS Summary Report for Problem Solving
SWIS summary 08-09 (Majors Only)
3,410 schools; 1,737,432 students; 1,500,770 ODRs
Grade Range Number of Mean Enrollment Mean ODRs per
Schools per school 100 per school
day
K-6 2,162 450 .34 (sd=.49)
~(1 /300 / day)
6-9 602 657 .85 (sd=1.11)
(1/ 117 / day)
9-12 215 887 1.27 (sd=2.39)
(1/79/ day)
K-(8-12) 431 408 1.06 (sd=2.60)
(1/ 94 / day)
Newton, J.S., Todd, A. W., Algozzine, K., Horner, R. H., & Algozzine, B. 2008
12. Creating a SWIS Summary Report for Problem Solving
Graphs for initial attempts in building a precision problem statement
Newton, J.S., Todd, A. W., Algozzine, K., Horner, R. H., & Algozzine, B. 2008
13. Creating a SWIS Summary Report for Problem Solving
Tell a story by putting the numbers into words
What: high number of referrals involving
disrespect, disruption, and inappropriate
language
Where: in class
When: 9:30-10:15, 2:15
By whom: 16 different students
Why: to avoid tasks and get peer attention
Generate list of additional questions to ask
Newton, J.S., Todd, A. W., Algozzine, K., Horner, R. H., & Algozzine, B. 2008
14. Creating a SWIS Summary Report for Problem Solving
Use the following link to download the SWIS User’s Manual for further guidance in creating custom
reports and graphs.
Newton, J.S., Todd, A. W., Algozzine, K., Horner, R. H., & Algozzine, B. 2008
15. Creating a SWIS Summary Report for Problem Solving
http://www.swis.org/index.php?page=resources;rid=10015
Newton, J.S., Todd, A. W., Algozzine, K., Horner, R. H., & Algozzine, B. 2008