SlideShare une entreprise Scribd logo
1  sur  11
Télécharger pour lire hors ligne
two GLoBaL eYeS
Copyright © 2009 May 2009
Customized Low-cost Excel-based IT Solutions www.twoglobaleyes.com
1
Companies that lack appropriate
IT involvement are at a disadvan-
tage when competing with competi-
tors that use performance-
enhancing technology
Customized Low-cost
Excel-based IT Solutions
By Brentt Bugler
TECHNOLOGY HELPS COMPANIES MANAGE THEIR OPERATIONS
Downward price pressure, rising costs and intensifying competition have put companies under
increasing pressure to control costs, provide better quality products and services, and respond
faster to customers’ ever-changing needs. In the past companies streamlined their operations by
focusing internally on production processes—creating more efficient cells and improving material
flow. But now, this is not enough, and improvement efforts are being applied to management
processes and transactional activities such as controlling the supply chain, reducing inventory and
manufacturing to customer demand. Being truly efficient has taken on a whole new level of com-
plexity.
The integrated set of transactional activities that a company uses to develop strategy, translate it
into operational actions, and monitor the improvement and effectiveness of both, is called its
management operating system (MOS). Corporate underperformance is usually due to MOS short-
comings, rather than insufficient
resources or managers’ lack of ability
and effort. The MOS is made up of IT
applications and human systems.
Companies that lack appropriate IT
involvement are at a disadvantage when
competing with competitors that use
performance-enhancing technology.
The objectives of IT applications are
wide-ranging, with each application
serving a specific need within the overall system. At the end of the day, however, they all com-
bine to serve a common purpose—to help the company compete effectively and efficiently by
streamlining and standardizing its processes. Forecasting, scheduling, production control, inven-
tory control, production reporting, external financial reporting, supplier performance management
and estimating/pricing are just a few of the hundreds of management processes that companies
must carry out reliably, accurately and quickly on a day-to-day basis to be a force in the market-
place.
OFF-THE-SHELF AND CUSTOM-DESIGNED APPLICATIONS
The cost of commercialized applications ranges from under $100,000 to hundreds of millions of
dollars. Most companies (small- and medium-sized companies in particular) cannot afford that
kind of investment, especially during economic downturns. Those that can, often find that the
two GLoBaL eYeS
Copyright © 2009 May 2009
Customized Low-cost Excel-based IT Solutions www.twoglobaleyes.com
2
The cost of outsourcing the develop-
ment and implementation of Excel-
based tools is a fraction of the com-
bined cost of purchasing an equivalent
commercial off-the-shelf alternative
and installing it
capability of generic off-the-shelf software does not exactly meet the peculiarities of their proc-
esses—falling short in some areas (thereby neutralizing the company’s core strength) whilst pro-
viding features they do not need in others. Companies pay for these surplus capabilities.
Furthermore, larger systems require more data, unnecessarily complicating the process. Managers
are often ill-equipped to work with complex instruments, increasing the likelihood that applica-
tions do not fully realize their intended purposes. Custom-designed applications offered by soft-
ware development houses call for much larger investments and are even less affordable.
Some innovative companies are finding that they can overcome the off-the-shelf issues and high
costs. These companies have opted for a flexible, inexpensive solution that can be tailor-made to
their exact needs. They are using a tool that most companies already have—Excel.
EXCEL-BASED APPLICATIONS
The value of Excel as the basis for MOSs is not appreciated by most. Excel is an underutilized
resource in most organizations, and can serve as the platform for its MOS. Since almost every
company has Excel installed throughout its organization, no additional capital investment is nec-
essary.
Not all companies have the in-house expertise to develop Excel-based tools from scratch. How-
ever, the cost of outsourcing the development and implementation of Excel-based tools is a frac-
tion of the combined cost of purchasing an equivalent commercial off-the-shelf alternative and
installing it.
Once installed, running and updating an Excel-based application is routine. Anyone who is profi-
cient in Excel can be shown how to make post-installation changes to a well-designed system.
Most computer users work with Excel. Their familiarity and proficiency with the tool provides
their organizations with the skills
to maintain their own Excel-based
systems.
Excel is flexible. It is
straightforward to change or add
to an existing Excel program. This
is not the case for custom-
designed or off-the-shelf
applications which usually require
extensive re-architecting, external
resources, and lengthy lead times.
A difficulty of Excel-based systems in the past, was that it is not a database and its storage capac-
ity is limited. That is no longer a problem since Microsoft released SharePoint and Performance-
Point, enabling businesses to source input for many Excel files from a central server.
two GLoBaL eYeS
Copyright © 2009 May 2009
Customized Low-cost Excel-based IT Solutions www.twoglobaleyes.com
3
7 STEPS TO INSTALLING EXCEL-BASED MANAGEMENT OPERATING SYSTEMS
Step 1: Streamline the Production Process
Process efficiencies are often diminished by breaks and weaknesses that are unknowingly built
into the company’s production flows. Therefore, before the management system is built or tech-
nology is introduced, the production processes must be streamlined. It is essential that the systems
developer digs down and finds out what drives the business, and where the pain points are. He
streamlines the process by eliminating non-value-adding activities, minimizing waste, and se-
quencing the process to carry out activities at the ideal points in the process. Only once produc-
tion process problems are resolved, should the MOS be designed and automated. Automation
without streamlining increases waste.
Step 2: Integrate and Customize the System
Successful companies utilize their resources in a manner that is valued by their customers. The
best companies deploy their resources better than their competitors can. They use their MOSs to
reinforce their strengths and enhance competitiveness.
The first step in developing an MOS is to recognize the role of each process or activity in the
company’s overall performance, and determine which process steps are key to attaining competi-
tive strength. Few processes are performed in isolation—most processes rely on other processes
for input. The developer must understand how the company’s processes integrate and how they
need to be coordinated.
For example, a Canadian supplier of polyethylene bags manufactures to stock. It produces a range
of bag types, each comprising up to 220 different products. To compete, the company must re-
spond quickly to fluctuations in customer demand. To do so profitably, it must maintain inventory
at a level that is high enough to avoid stock-outs, but low enough to minimize the risk of stock
obsolescence. (Customers often change bag designs at short notice, immediately rendering exist-
ing stock obsolete.) The company dedicates between two and four machines to the manufacture
of each bag type.
The system by which the bag company managed its manufacturing processes in the past was
cumbersome and subject to human error. Updating sales forecasts, controlling inventory levels
and scheduling production were seen as independent activities and were not integrated. Produc-
tion schedule updates could not keep up with customer needs and manufacturing requirements,
resulting in dissatisfied customers, high costs and a stressed-out production scheduler.
It is normal for companies’ production schedules to undergo change during the production cycle
due to machine problems, labour issues, raw material shortages, unexpected orders, etc. However,
the bag company often had to discard the weekly schedule before the end of the week’s first
twelve-hour shift due to the many changes. The company’s failure to keep customers satisfied
and costs under control was costing them business. They needed a robust and integrated system,
centred around a master production schedule (MPS), aligned with finished goods stock levels and
sales forecasts. The scheduler needed a clear vision of all the factors affecting the scheduling
process.
two GLoBaL eYeS
Copyright © 2009 May 2009
Customized Low-cost Excel-based IT Solutions www.twoglobaleyes.com
4
Situations where
scheduling and
control are crucial
to companies’ suc-
cess are not un-
common
With scheduling and control pivotal to overall corporate effectiveness, the company turned to an
Excel-based scheduling solution. Situations where scheduling and control are crucial to compa-
nies’ success are not uncommon. Other examples where Excel has met companies’ scheduling
needs include:
 A North American airline support service provider assembles, stocks, dispatches and loads
the equipment and supplies its customers (the major airlines) need to provide passengers with
in-flight services. It delivers the kits to the aircraft during
the time they are parked on the apron. The Excel-based
MOS centres around a backward (just-in-time) scheduling
mechanism. It integrates customers’ flight schedules and
adapts production activities to passenger fluctuations,
flight changes and last-minute aircraft switches. These
MOS changes have added value to the company’s service,
as reflected by a drop in penalties for causing customer
flight delays.
 A six-site tea producer in South Africa implemented a
production scheduling system to effect a 33%
improvement in harvesting productivity. The system
accommodates the uncertainties that are inherent in agriculture—it is able to maintain a con-
stant-sized harvesting team and ensure a consistent flow of green-leaf to the on-site factories
despite unpredictable daily fluctuations in crop availability due to sudden changes in weather
conditions.
 A global German carmaker installed an Excel-based scheduling and control system on the
production line of two of its most popular models at its South African plant. On-the-floor
controls and corrective action tools, implemented at operator, group leader and supervisor
levels, generated significant quantifiable improvements in cost, quality and delivery, generat-
ing an annualized 2.5:1 return on investment.
Step 3: Reconstruct Key Processes into Competitive Strengths
Two types of system elements make up the MOS. Skeleton elements provide essential capabilities
and are prerequisite to the functioning of the system. They are common in all systems of similar
type, regardless of the basis on which the company competes. Such elements require a minimum
level of adequacy, which, once achieved, has no further effect on performance. For example, pro-
duction scheduling systems look up or derive production standards (e.g. machine and labour stan-
dards, product specifications, etc) in order to schedule production runs. Once the system is capa-
ble of determining its standards accurately, there is little benefit to be gained by developing its
standard-generating capability further.
The second type of element adds muscle to the system. This type of element affects the key as-
pects of the process (i.e. the steps in the process that are the source of the company’s competitive
strength). It is the systems developer’s responsibility to design, incorporate and fully leverage this
element to the company’s advantage. Only once he fully understands the process, the overall sys-
tem and how they combine, can the system developer maximize the capability of the system. He
gains this insight by spending time observing and analyzing the process, and working closely
with line staff and other users of the system.
two GLoBaL eYeS
Copyright © 2009 May 2009
Customized Low-cost Excel-based IT Solutions www.twoglobaleyes.com
5
4
3 PM
2
SD
11 12 13 1 2 3 4 5 6 7
3 GI30SER2636CL 321234.1 4 226 8.71 1,326 226 300 400 400
1 GI55PCL3038CL 321235 800 19.87 800 800
3 GI55JAM3038CL 321236 100 2.01 100 100
4 GI79CAT3038BK 321237 200 5.34 200 200
1 GI56SYS3038BK 321238 200 5.34 200 200
3 GI56STU3038BK 321239.1 3 900 16.84 3,000 900 1,000 1,100
1 GI56SER3038BK 321240 640 15.99 640 640
7 GI56PRO3038BK 321241 200 5.34 200 200
4 GI56JAM3038BK 321242 360 7.04 360 360
4 GI57STU3038BK 321243.1 2 500 6.55 800 500 300
5 GI57PRO3038BK 321244 1,040 16.23 1,040 1,040
8 GI57PCL3038BK 321245 600 9.58 600 600
5 GI53COL3038BK 321246 900 22.29 900 900
0 0 0.00 0 0
0 0 0.00 0 0
6 GRGLENC2010BK 330001 400 10.18 400 400
2 PM 270005 4 0.50 4 0
2 SD 270006 6 0.50 6 0
2 PM 270007 7 0.50 7 0
9 GI30SER2636CL 270008 200 7.76 200 200
0
0
10 GI30SER2636CL 321234.2 321234.1 300 11.39
11 GI30SER2636CL 321234.3 321234.1 400 15.02
12 GI30SER2636CL 321234.4 321234.1 400 15.02
5 GI56STU3038BK 321239.2 321239.1 1,000 18.66
6 GI56STU3038BK 321239.3 321239.1 1,100 20.47
7 GI57STU3038BK 321243.2 321243.1 300 4.13
0 0 0 0 0.00
12 5 7
WORK ORDER NUMBERING CONVENTION NOTE:
6 digit W/O numbers—single-run W/Os Input into yellow cells only
7 digit W/O numbers—split W/Os
MASTERPRDNSCHEDINSERTSSPLITW/Os PRODUCTION SEQUENCER
1-Jul-04
Machines:
11, 12, 13
Machine
sequence:
Product Code
Work
Order No.
Preventive Maintenance
Shutdownweek-starting:
LEGEND
Cases per work order split
No. work
order
splits
Product
cases or
PM/SD
hours
Machine
hours
Total work
order
cases or
PM/SD
hours
Figure 1. The Production Sequencer increases scheduling flexibility
To compete profitably in the polyethylene bag market, the bag manufacturer must provide its
customers with product at short notice and at low cost. Critical elements in its Excel-based system
include:
 Structured forecast variance reports highlight major forecast-versus-actual sales variances,
enabling Sales to focus on the largest forecast discrepancies, giving direction to forecasting
improvement efforts. Improved forecast accuracy has significantly lowered inventory levels,
thereby reducing costs without increasing the risk of stock-outs.
 The stock control tool predicts situations where too little inventory endangers customer ser-
vice, and too much inventory unnecessarily increases costs. This enables the company to
maintain optimal inventory levels.
 The production scheduling
mechanism incorporates a
production insert capability.
It allows selected rush
orders to bypass the sales
forecasting and MPS
processes, and inserts them
directly into the current
week’s production schedule
(see Figure 1) without
disrupting the schedule.
(Preventive Maintenance
and Machine Shutdowns are
scheduled in the same way.)
Such flexibility and
responsiveness is valued by
customers.
 The production sequencing
r more, can be split into up to seven shorter work orders and
tep 4
element enables the subdivi-
sion of work. Work orders,
which otherwise tie up a
single machine for two days o
spread across several machines over a longer period of time. This gives the scheduler more
options and enhances production scheduling flexibility, facilitating improved machine utiliza-
tion rates and higher efficiencies, without increasing costs.
S : Simplify System Administration and Operations
management system should be intuitive and automate many of the data inputs that users would
he bag manufacturer’s scheduling system draws most of its data automatically from system
A
otherwise do manually, minimizing user effort and reducing human error. Not only does this im-
prove the reliability of the schedule, but it also saves time reworking input errors later on.
T
components such as sales forecasts, the MPS and the standards database. However, few systems
are exclusively automated. Where manually inputted decisions (such as machine choice, produc-
tion sequence and number of work order splits) are necessary, it is important that the input
two GLoBaL eYeS
Copyright © 2009 May 2009
Customized Low-cost Excel-based IT Solutions www.twoglobaleyes.com
6
4
3 PM
2
SD
seq?
zero volume split W/O
negative split W/O
9.58
900 22.29 W/O?
cases?
0 0.50 hours?
0.50
200 7.76 W/O split? zero volume split W/O
0 #N/A no produc
11 12 13 1 2 3 4 5 6 7
3 GI30SER2636CL 321234.1 4 226 0.00 1,326 226 300 400 400
1 GI55PCL3038CL 321235 800 19.87 800 800
3 GI55JAM3038CL 321236 100 2.01 100 100
4 GI79CAT3038BK 321237 200 5.34 200 200
1 GI56SYS3038BK 321238 200 5.34 200 200
3 GI56STU3038BK 321239.1 3 2,000 36.81 3,000 2,000 1,000
1 GI56SER3038BK 321240 640 15.99 640 640
7 GI56PRO3038BK 321241 200 5.34 200 200
4 GI56JAM3038BK 321242 360 7.04 360 360
4 GI57STU3038BK 321243.1 2 -200 -1.92 800 -200 1,000
5 GI57PRO3038BK 321244 1,040 16.23 1,040 1,040
8 GI57PCL3038BK 321245 600 600 600
5 GI53COL3038BK 900 900
0 0 0.00 0 0
0 0 0.00 0 0
6 GRGLENC2010BK 330001 400
2 PM 270005 0
2 SD 270006 6 0.50 6 0
2 PM 270007 7 7 0
9 GI30SER2636CL 270008 8 200 200
13 t 0
0
10 GI30SER2636CL 321234.2 32123
GI30SER2636CL 321234.3 32123
12 GI30SER2636CL 321234.4 32123 incorrect machine sequence
5 GI56STU3038BK 321239.2 321239.1 1,000 18. machine not specified
6 GI56STU3038BK 321239.3 321239.1 0 0.50 work order no. missing
7 GI57STU3038BK 321243.2 321243.1 1,000 12. PM/SD hours not specified
0 0 0 0 0. work order split exceeds 7
13 5 7 number of cases not specified
WORK ORDER NUMBERING CONVENTIO
4.1 300 11.39
4.1 400 15.02 machine?
4.1 400 15.02 seq?
66 machine?
W/O?
60 hours?
00 W/O split?
cases?
N NOTE: no product product name not specified
6 digit W/O numbers—single-run W/Os Input into y cases of W/O split equals zero
7 digit W/O numbers—split W/Os total W/O cases less than sum of split W/Os
week-starting:
LEGEND
ellow cells only zero volume split W/O
negative split W/O
Preventive Maintenance
Shutdown
PRODUCTION SEQUENCER
1-Jul-04
Machines:
11, 12, 13
Product Code
Work
Order No.
No. work
order
splits
Product
cases or
PM/SD
hours
MASTERPRDNSCHEDINSERTSSPLITW/Os
Machine
sequence:
Machine
hours
Total work
order
cases or
PM/SD
hours
KEY--RED FLAG ALERTS
Cases per work order split
mechanism is user
friendly. The system
uses drop-down lists
wherever possible, e.g.
week starting date and
product codes for in-
serts (see Figure 1 and
Figure 2), and alerts the
scheduler to insufficient
production capacity,
potential stock-outs and
incorrectly formatted
data inputs. Figure 2
shows how red flag
alerts warn the sched-
uler that data entries are
incomplete or wrong.
He only proceeds to the
next step in the schedul-
ing process once all the
red flag alerts have been
resolved.
Despite improved control on the line, schedule changes are unavoidable. The bag manufacturing
tep 5
scheduling system can accommodate schedule updates at various points in the production cycle
without the need for lengthy data gathering and time-consuming calculations. The scheduler up-
dates the weekly schedule within minutes of the end of each shift, providing subsequent shifts
with accurate and relevant schedules.
S : Design Insight-giving Metrics
anagement needs to control operations, measure performance and make decisions. Despite ex-
o generate decision-making information
and metrics, companies capture and maintain data.
M
pensive enterprise systems, many companies still lack the information they need to make good
business decisions. In most cases it is not the lack of information that causes the problem—it is a
lack of insight and quality of information. Employees concentrate on the metrics they are given.
Unless the system’s metrics measure the
real issues, the important problems and con-
cerns will not be addressed. System devel-
opers, in collaboration with senior manage-
ment and operations managers, must design
easily-understood metrics that provide
awareness and understanding of decisive
issues.
T
MOSs often meet with resistance from users
because of the large amount of data that they are required to record during the course of their
jobs. Too little data leads to over-simplified indicators, less-than-adequate understanding of the
causes of variances and unreliable predictions of consequences of a decision. Too much data in-
Figure 2. Red flag alerts incorporated into the Production Scheduler enhance data
input accuracy and save data entry time
Unless the system’s metrics
measure the real issues, the im-
portant problems and concerns
will not be addressed
two GLoBaL eYeS
Copyright © 2009 May 2009
Customized Low-cost Excel-based IT Solutions www.twoglobaleyes.com
7
creases the bureaucratic burden on employees, diverting their attention away from their core
activities.
An effective MOS makes the information visible at the point where it can be used to create value.
It pushes real-time decision-making to the worker level, freeing supervisors and managers to
spend more time planning, working more closely with customers and suppliers, and concentrating
on continuous process improvement.
The carmaker’s produc-
tion scheduling and
control system incorpo-
rates short-interval pro-
duction controls and
root cause analysis
tools. Operators can
identify production
variances in real-time
and predict future prob-
lems. Analysis of the
carmaker’s process in-
dicated a close correla-
tion between the time
spent by group leaders
outside their respective
production cells and the
downstream occurrence
of quality issues such as
off-lines and recurring
faults. The percentage
of the group leader’s
time spent outside his
cell area is an important
predictor of quality and
as such is monitored on a short-interval basis (see Figure 3).
Group leaders and operators spend no more than two minutes every hour recording the necessary
production data. The numbers provide immediate insight into current variances and problems,
highlighting potential issues, and
guiding the operator toward im-
mediate corrective and preventive
action (when required). Figure 4
shows similar short-interval pro-
duction controls used by the bag
manufacturer. Both the carmaker
and the bag manufacturer found
value in root cause analysis tools
which guide machine operators to
immediate corrective action in the
event of line problems. Operators are able to resolve issues without having to call on supervisors
for assistance (see Figure 5). The supervisor intervenes only if the operator is unable to deal with
the issue on his own.
am: 6:10-7 7-8 8-9 9:10-10 10-11 11-12 12:30-13 13-14 14-14:30 Shift-End
pm: 14:40-15:30 15:30-16:30 16:30-17 17:10-18 18-19 19-20 20:30-21 21-22 22-23 Data
Plan 11 25 32 43 57 71 78 92 106
Actual
Plan Start
Dust cover 6
Mirrors 7
Panel, knob 8
Elec control 9
Out-of-Area: A - Meeting B - Personal C - Other Area D - Offlines E - Working on line F - Admin G - Training
Breakdowns: A - Line Equipmt B - Battery Gun C - Battery D - Torque
ASSEMBLY: DOOR SUB-ASSEMBLY—Fitment
SHIFT: GROUP LEADER: SUPERVISOR: Signed: DATE:
Absentees:
MANPOWER Cumulative
Units
Operator
out of cell
Minutes
Reason Code
QUALITY
CP6A
Defects
Offlines
Out-of-Cell (minutes)
Reason Code
DRIFT
Corrective Action
PRODUCTN
Cumulative Plan
Cumulative Actual
Variance
Controllable Variance
Corrective Action
REASON CODES
SHORTGSMTCE
Break
Downs
Minutes
Reason Code
Notes
Figure 3. The carmaker’s short-interval control for the door sub-assembly
(fitment) production cell
Group leaders and operators
spend no more than two minutes
every hour recording the necessary
production data
two GLoBaL eYeS
Copyright © 2009 May 2009
Customized Low-cost Excel-based IT Solutions www.twoglobaleyes.com
8
8am- 8pm Crew Sign-Off (1):
Sign-Off (2):
Plan Date: 8:00 AM NOT VALID BEFORE:
Plan P/Cum Act A/Cum Plan1 Act1 Plan2 Act2
8:00 AM 321246.0 GI53COL3038BK 1 19.95 180 900 639 0
10:00 AM 321246.0 GI53COL3038BK 1 0.0000 0 900 83 83 721 0
12:00 PM 321246.0 GI53COL3038BK 1 0.0000 0 900 83 165 804 0
2:00 PM 321246.0 GI53COL3038BK 1 0.0000 0 900 83 248 887 0
4:00 PM 330001.0 GRGLENC2010BK 2 11.338 180 400 83 330 900 69
6:00 PM 330001.0 GRGLENC2010BK 2 0.0000 0 400 83 413 152
8:00 PM 330001.0 GRGLENC2010BK 2 0.0000 0 400 83 496 0 234
10:00 PM 330001.0 GRGLENC2010BK 2 0.0000 0 400 83 83 0 317
12:00 AM 330001.0 GRGLENC2010BK 2 0.0000 0 400 83 165 0 400
2:00 AM 321241.0 GI56PRO3038BK 1 18.416 180 200 83 248 82 482
4:00 AM 321241.0 GI56PRO3038BK 1 0.0000 0 200 83 330 165
6:00 AM 321245.0 GI57CPL3038BK 2 12.469 180 600 111 442 200 76
8:00 AM 321245.0 2 0.0000 0 600 132 553 208
Lbs Scheduled Day: 5,620 Night: Total: 11,240
MACHINE 11 DAILY PRODUCTION CONTROL
7/3/04 12:00 AM3-Jul-04
end
time
Work
Order
Product
Change
8pm- 8am Crew
Cuts /
Min
Lbs /
Case
Order
Cases
Cases
on skid
2-Hourly Cases Running Order Total
Reason for Variance Action
5,620
Plan
P P P P P P
Prevent-
able
on-the-floortraining
fixproblemorsubmitMaintenance
workorder
fixproblemorsubmitMaintenance
workorder
refertomanager
refertomanager
fixproblemorcallsubmit
Maintenanceworkorder
fixproblemorcallsubmit
Maintenanceworkorder
getoperatorfromdownmachine,
otherwisegetonefromanother
machinedependingonpriority
getoperatorfromdownmachine,
otherwisegetonefromanother
machinedependingonpriority
findtherightfilm,orchange
sequenceonschedule,depending
onpriority
findtherightcartons(call
Warehouse),orchangesequence
onschedule,dependingonpriority
findbaskets,orusebaskets
allocatedtoanotherworkorderby
changingtheschedulesequence,
dependingonpriority
on-the-floortraining
havemanagerdothescheduleand
printlatestversion
havemanagercorrecttheschedule
andprintlatestversion
fixproblemorsubmitMaintenance
workorder
fixproblemorsubmitMaintenance
workorder
confrontoperatorandenforce
compliance
confrontsetupoperatorand
enforcecompliance
havemanagercorrecttheschedule
andprintlatestversionassoonas
possible
refertomanager
refertomanager
CORRECTIVEACTION:
STEP1
SPECIAL
INSTRUCTNS
If no improvement, go to Step 2
STEP 2: CALL THE SUPERVISOR
ROOT CAUSE ANALYSIS - VOLUME VARIANCE
ANALYSIS & CORRECTIVE ACTION
SCRAP DOWNTIME
AdministrativeSkills Machine
Performance
Film Quality Breakdown Manning Inputs Skills
SPEED
Machine
Performance
Compliance Administrative
operator setup mech mech elec absent movedelec no film no
cartons
no
baskets
operator setup
operator
sched
wrong
no
sched
mech elec operator setup
operator
sched
wrong
blends repro
Film Quality
reproblends
Step 6: Develop Structured Reports
A good MOS provides decision-support. It incorporates structured reporting—robust operating
reports generated by the systematic capture of operating data in order to recognize potential prob-
lems and opportunities without further analysis. The reports highlight performance and variances,
aid the quick resolution of repetitive questions, and form the basis for objective decision-making.
Figure 5. The bag manufacturer’s production line root cause analysis tool cuts down on the amount of time
supervisors and managers spend on crisis management
Figure 4. The bag manufacturer’s short-interval control—it is updated every two hours by the machine operator
two GLoBaL eYeS
Copyright © 2009 May 2009
Customized Low-cost Excel-based IT Solutions www.twoglobaleyes.com
9
Short-term reports trig-
ger remedial action on
off-schedule conditions.
They are most effective
in bringing production
back on track when
used in conjunction
with root cause analysis
tools. The carmaker’s
shop managers review
the daily operating re-
ports (DORs) with their
respective area supervi-
sors, who are account-
able for production
variances (see Figure
6). Together they plan
preventive action to fix
recurring problems.
.
report operating
Longer-term reports target managers higher up the hierarchy. They promote continuous im-
provement and facilitate the management of business objectives. The carmaker’s weekly produc-
tion reports (WPRs) are seven-day rolling reports, one for each shop (body shop, assembly, etc).
Each report highlights performance in critical performance areas (schedule, cost, quality, morale)
The WPRs are posted on the
company’s intranet and is
updated daily. The produc-
tion manager reviews each
shop’s WPR with the shop
manager at his weekly pro-
duction review meeting.
Scorecards
and shows trends over the last two to three months (see Figure 7)
performance in relative
terms (ratios), rather than
absolute numbers, enabling
comparisons across operat-
ing areas regardless of hier-
archical level, size, volume,
process, etc. The carmaker
measures production in
critical areas, and compares
performance across cells,
areas, shops, sites or shifts.
The scorecard has the flexi-
bility of reporting perform-
ance over any period.
Figure 8. The carmaker’s weekly production report for the assembly line
Paint Shp Eng Plant Shortages Breakdns Absentees Other
Shift 1 106 99 -7 0 0 0 7 1 -1 Loading unit on trolly
Shift 2 106 106 0 0 0 0 0 11 -11
TOTAL 212 205 -7 0 0 0 7 12 -12
Absents % Trim Elec Roller Minutes %
Mezzanine 65% 1 23 2890 87.9%
92% 3 75.0% 0 1270 73.4%
83% 3 85.0%
89% 2 91.7%
TBS 2 58% 1 95.5%
91% 1
97.2% 2 29 5 0 0
Cockpit 1 0 0 0 0
Door Sub-Assy 1 11 4 0 2708 97.8% 0 0 1
TBS 1 0 8 9 0 3656 96.1% 0 0
8 102 5 0 3287 100.0% 0 0
Mainline 1 96.2% 0 0 0 0 4275 98.8% 460 0 Angle torque faulty
Mainline 2 2 23 0 0 3566 89.6% 0 0
Trim Final 90% 0 100.0% 0 0 0 0 2738 98.9% 0 0 23
Roller Test 1
HRP 14
B5 3
TOTAL 14 173 23 23 24390 94.0% 460 0 49
SUPPL RELTNS
77% 4 86.7%
81% 15 92.4%
Absents %
72% 2 94.4%
81% 1 90.9%
TBS 1 104% 1 92.9%
Trim Elec Roller Minutes %
Mezzanine 1 14 15 15 2205 90.0% 0 0
Cockpit 3 0 0 0 1195 92.6% 0 0
Door Sub-Assy 87% 0 100.0% 1 11 0 0 1999 96.9% 0 0 8
1 0 2 0 2688 94.7% 0 0 Jansen
TBS 2 66% 2 90.0% 4 77 3 0 2451 100.0% 0 0
Mainline 1 88% 0 100.0% 1 0 4 0 3189 98.9% 460 0 Angle torque faulty
Mainline 2 77% 1 96.4% 2 27 3 0 2922 98.5% 0 0
Trim Final 92% 0 100.0% 0 0 0 0 2019 97.8% 0 0 23
Roller Test 2
HRP 14
B5 8
TOTAL 84% 7 96.0% 13 129 27 15 18668 96.5% 460 0 67
A4 ASSY 3 43058 95.1% 920 0
ASSEMBLY: DAILY OPERATING REPORT
SCHED Plan Actual Var
Lost units
REMARKS
Date from (and including): 16-Jul-02
SHIFT 1 PRDN PERF WIP
Date to (and including):
Group Leader in Cell
16-Jul-02
Shortage
Minutes
Breakdn
Minutes
REMARKS
SYSTEM NON-
COMPLIANCE
(Missing SICs)
ATTENDANCE
QUALITY
Offlines
Recurring Defects
SHIFT 2 PRDN PERF
ATTENDANCE
QUALITY
Offlines
Recurring Defects Group Leader in Cell
5
2
WIP
SUPPL RELTNS
Breakdn
Minutes
Shortage
Minutes
REMARKS
SYSTEM NON-
COMPLIANCE
(Missing SICs)
4
8
74% 22 94.1% 27 302 50 8
Figure 6. The carmaker’s daily operating report for the assembly line
16-Jul-02
Paintshop Eng Plant Shortages Breakdns Absentees Assembly Shortages
1 04-Jul 20 98% 0 0 4 1 0 04-Jul-02 3.89 85% 32 4
2 08-Jul 20 98% 0 0 0 5 0 08-Jul-02 4.86 89% 22 0
3 09-Jul 20 98% 0 0 0 0 0 09-Jul-02 5.25 85% 31 2
4 10-Jul-02 2 212 100% 0 0 0 0 0 10-Jul-02 5.15 85% 32 26
5 11-Jul-02 212 201 -11 95% 0 0 3 8 0 11-Jul-02 5.38 89% 23 17
6 15-Jul-02 212 196 -16 92% 0 0 0 1 15 15-Jul-02 5.12 82% 35 0
7 16-Jul-02 212 205 -7 97% 0 0 0 0 7 16-Jul-02 4.85 87% 27 0
1 04-Jul-02 3596 84 0
2 08-Jul-02 3568 58 0
3 09-Jul-02 3599 73 0
4 10-Jul-02 3581 87 0
5 11-Jul-02 3591 97 0
6 15-Jul-02 3522 27 0
7 16-Jul-02 3514 27 0
This Week Last Month Previous Month Target
Training
Hours
KEY FOR GRAPHS:
-02 212 7 -5
-02 212 7 -5
-02 212 8 -4
12 0
COST
Date
Normal
Hours
Overtime
Hours
Date
Faults /
Unit
Direct
Runners
Offlines
ASSEMBLY: WEEKLY PRODUCTION REPORT
7 working days (up to and including):
SCHEDULE
Date tu V Attain
Lost Units
QUALITY
Plan Ac al ariance
NMTU
13
14
15
16
17
18
19
4-Jul
8-Jul
9-Jul
10-Jul
11-Jul
15-Jul
16-Jul
ATTENDANCE
92%
93%
94%
95%
96%
97%
98%
99%
4-Jul
8-Jul
9-Jul
-Jul
-Jul
-Jul
-Jul
10
11
15
16
RUN RATE ATTAINMENT
90%
92%
94%
96%
98%
100%
102%
4-Jul
8-Jul
9-Jul
10-Jul
11-Jul
15-Jul
16-Jul
DIRECT RUNNERS
80%
82%
84%
86%
88%
90%
92%
4-Jul
8-Jul
9-Jul
10-Jul
11-Jul
15-Jul
16-Jul
FAULTS/UNIT
0
1
2
3
4
5
6
4-Jul
8-Jul
9-Jul
10-Jul
11-Jul
15-Jul
16-Jul
LOST UNITS
Breakdns
34%
Absentees
50%
Paintshop
0%
Shortages
16%
Eng Plant
0%
Paintshop
Eng Plant
Shortages
Breakdns
Absentees
OFFLINES
Shortages
13%
Assembly
56%
Paintshop
5%
Engine Plant
5%
Bodyshop
21%
Bodyshop
Paintshop
Engine Plant
Shortages
Assembly
DIRECT HOURS
Normal
98%
Overtime
2%
Sunday
0%
Training
0%
Saturday
0%
Normal
Overtime
Saturday
Sunday
Training
Figure 7. The carmaker’s weekly production report for the assembly line
two GLoBaL eYeS
Copyright © 2009 May 2009
Customized Low-cost Excel-based IT Solutions www.twoglobaleyes.com
10
Step 7: Institutionalize Behaviour
A company’s modus operandi evolves over many years’ development and refinement of its proc-
esses. This knowledge is very valuable to the organization, but is often not formally documented,
usually residing in the heads of those that developed it. It is passed on in the workplace from one
worker to the next. Through such an informal transfer of knowledge, many of the intricacies of
the process, and the logic behind it, are not recorded, compromising the company’s strengths as
workers come and go, especially during times of mass layoffs or resignations.
The reality today is that the people doing the work know a lot more about their jobs than their
bosses do. As the process evolves undocumented, senior management increasingly loses touch
with operations, opening up a divide between senior management and those on the floor or in the
field. It is at this point that the ques-
tion of alignment between strategy
and operations can become an issue.
A key step in the implementation of
the Excel-based system is to ensure
that processes are procedurized and
documented. This enables managers
to keep up with the development of
processes, enforce discipline and
compliance, and exert control over
operations. At the same time it em-
powers employees, facilitates training
and ensures dependable execution of
operations. Standardization and conformity set the company up for the retention of knowledge,
institutionalize behaviour, and provide a platform from which to deliver consistent quality and
service, and improve productivity and cost control.
CONCLUSION
Generic or packaged IT solutions rarely enable companies to leverage their full potential in the
marketplace. Companies are distinct in many ways—what might be perfect for one company
could be detrimental to another. Customized management operating systems are essential for any
company wishing to gain a competitive advantage.
As a company grows, technologies advance and customer needs and wants shift, the company’s
management system needs to change too. It must keep pace with the ever-changing environment
within which the company operates. Over-investment in a rigid off-the-shelf or custom-designed
system that is costly to adapt when changes become necessary in a few years’ time, doesn’t make
economic sense.
A well-designed Excel-based system resolves the issue.
Standardization and conformity set
the company up for the retention of
knowledge, institutionalize behav-
iour, and provide a platform from
which to deliver consistent quality
and service, and improve productiv-
ity and cost control
two GLoBaL eYeS
Copyright © 2009 May 2009
Customized Low-cost Excel-based IT Solutions www.twoglobaleyes.com
11
ABOUT TWO GLOBAL EYES
Two Global Eyes develops corporate solutions, it doesn’t sell programs—it designs singular solu-
tions to suit the unique problems and opportunities of companies. The underlying premise is that
all companies can make better use of what they already have and needn’t incur additional capital
expenditure to improve profitability. Two Global Eyes follows a hands-on approach—working
face-to-face with the client at all levels in the office, in the field or on the shop floor. Active in-
volvement of the client’s people, without distracting them from their normal day-to-day responsi-
bilities, ensures that the improvement activities get done and that installations are sustainable in
the long-term.
To find out more about Two Global Eyes, visit www.twoglobaleyes.com.
Brentt Bugler is the founder of Two Global
Eyes. He has successfully developed and in-
stalled cost-effective customized corporate
solutions on three continents covering a
broad spectrum of industries. His clients
range from small local and regional compa-
nies to some of the largest and most success-
ful global corporations. Brentt has a B.Sc.
(Engineering) from the University of Cape
Town, a B.Com. from the University of
South Africa and an M.B.A. from the Uni-
versity of Minnesota’s Carlson School of
Management.

Contenu connexe

Tendances

ERP a research & study paper by ejaz ahmed bhatti
ERP a research & study paper by ejaz ahmed bhattiERP a research & study paper by ejaz ahmed bhatti
ERP a research & study paper by ejaz ahmed bhattiEjaz Bhatti
 
Proposal for rolls royce to adapt an erp system
Proposal for rolls royce to adapt an erp systemProposal for rolls royce to adapt an erp system
Proposal for rolls royce to adapt an erp systemKunal Chadha
 
Enterprise Resource Planning
Enterprise Resource PlanningEnterprise Resource Planning
Enterprise Resource PlanningSumant Diwakar
 
SAP & ImpactECS for Manufacturers - Costing and Profitability
SAP & ImpactECS for Manufacturers - Costing and ProfitabilitySAP & ImpactECS for Manufacturers - Costing and Profitability
SAP & ImpactECS for Manufacturers - Costing and ProfitabilityMichele Self
 
Enterprise Resource Planning
Enterprise Resource PlanningEnterprise Resource Planning
Enterprise Resource PlanningAnkesh Gorkhali
 
evolution of Erp
evolution of Erp evolution of Erp
evolution of Erp abhibft
 
Evolution & structure of erp
Evolution & structure of erpEvolution & structure of erp
Evolution & structure of erpSomya Bagai
 
SHARE in Boston: z/OS Applications Adapting at the Speed of Business
SHARE in Boston: z/OS Applications Adapting at the Speed of BusinessSHARE in Boston: z/OS Applications Adapting at the Speed of Business
SHARE in Boston: z/OS Applications Adapting at the Speed of BusinessRichard Szulewski
 
Major Project Enterprise Resource Planning for Distribution Companies Present...
Major Project Enterprise Resource Planning for Distribution Companies Present...Major Project Enterprise Resource Planning for Distribution Companies Present...
Major Project Enterprise Resource Planning for Distribution Companies Present...TheKojuEffect
 
Impact of erp in retail sector
Impact of erp in retail sectorImpact of erp in retail sector
Impact of erp in retail sectorProjects Kart
 
Enterprise resource planning, Evolution, Importance, Advantage for Business
Enterprise resource planning, Evolution, Importance, Advantage for BusinessEnterprise resource planning, Evolution, Importance, Advantage for Business
Enterprise resource planning, Evolution, Importance, Advantage for BusinessPraveen Venugopal
 
Enterprise resource planning
Enterprise resource planning Enterprise resource planning
Enterprise resource planning Bonny V Pappachan
 

Tendances (20)

Effect of erp system
Effect of erp system Effect of erp system
Effect of erp system
 
ERP a research & study paper by ejaz ahmed bhatti
ERP a research & study paper by ejaz ahmed bhattiERP a research & study paper by ejaz ahmed bhatti
ERP a research & study paper by ejaz ahmed bhatti
 
ERP: Strength and Weakness
ERP: Strength and WeaknessERP: Strength and Weakness
ERP: Strength and Weakness
 
Proposal for rolls royce to adapt an erp system
Proposal for rolls royce to adapt an erp systemProposal for rolls royce to adapt an erp system
Proposal for rolls royce to adapt an erp system
 
Enterprise Resource Planning ppt
Enterprise Resource Planning pptEnterprise Resource Planning ppt
Enterprise Resource Planning ppt
 
ERP
ERPERP
ERP
 
Enterprise Resource Planning
Enterprise Resource PlanningEnterprise Resource Planning
Enterprise Resource Planning
 
ERP
ERPERP
ERP
 
SAP & ImpactECS for Manufacturers - Costing and Profitability
SAP & ImpactECS for Manufacturers - Costing and ProfitabilitySAP & ImpactECS for Manufacturers - Costing and Profitability
SAP & ImpactECS for Manufacturers - Costing and Profitability
 
Enterprise Resource Planning
Enterprise Resource PlanningEnterprise Resource Planning
Enterprise Resource Planning
 
ERP Tool Evaluation
ERP Tool EvaluationERP Tool Evaluation
ERP Tool Evaluation
 
evolution of Erp
evolution of Erp evolution of Erp
evolution of Erp
 
Evolution & structure of erp
Evolution & structure of erpEvolution & structure of erp
Evolution & structure of erp
 
SHARE in Boston: z/OS Applications Adapting at the Speed of Business
SHARE in Boston: z/OS Applications Adapting at the Speed of BusinessSHARE in Boston: z/OS Applications Adapting at the Speed of Business
SHARE in Boston: z/OS Applications Adapting at the Speed of Business
 
Major Project Enterprise Resource Planning for Distribution Companies Present...
Major Project Enterprise Resource Planning for Distribution Companies Present...Major Project Enterprise Resource Planning for Distribution Companies Present...
Major Project Enterprise Resource Planning for Distribution Companies Present...
 
ERP Software
ERP SoftwareERP Software
ERP Software
 
Erp pptx
Erp pptxErp pptx
Erp pptx
 
Impact of erp in retail sector
Impact of erp in retail sectorImpact of erp in retail sector
Impact of erp in retail sector
 
Enterprise resource planning, Evolution, Importance, Advantage for Business
Enterprise resource planning, Evolution, Importance, Advantage for BusinessEnterprise resource planning, Evolution, Importance, Advantage for Business
Enterprise resource planning, Evolution, Importance, Advantage for Business
 
Enterprise resource planning
Enterprise resource planning Enterprise resource planning
Enterprise resource planning
 

En vedette

PRICE revised 20160817
PRICE revised 20160817PRICE revised 20160817
PRICE revised 20160817brentt13ugler
 
Megan Salamone Marketing Services
Megan Salamone Marketing ServicesMegan Salamone Marketing Services
Megan Salamone Marketing ServicesMegan Salamone
 
Presentation1 Abul Hasnat
Presentation1 Abul HasnatPresentation1 Abul Hasnat
Presentation1 Abul Hasnata_hasnat
 
AriZona Teashop
AriZona TeashopAriZona Teashop
AriZona TeashopAlkegi
 
Corporate Profile Presentation V2.0 (1)
Corporate Profile Presentation V2.0 (1)Corporate Profile Presentation V2.0 (1)
Corporate Profile Presentation V2.0 (1)Damir Pletikosa
 
Hp Printer Brochure For Customer Reference
Hp Printer Brochure For Customer ReferenceHp Printer Brochure For Customer Reference
Hp Printer Brochure For Customer ReferenceHem Infotech
 
Takrifan ketaksamaan peluang pendidikan dalam konteks malaysia
Takrifan ketaksamaan peluang pendidikan dalam konteks malaysiaTakrifan ketaksamaan peluang pendidikan dalam konteks malaysia
Takrifan ketaksamaan peluang pendidikan dalam konteks malaysiaDorma Jn
 

En vedette (12)

13212435 pss7
13212435 pss713212435 pss7
13212435 pss7
 
Afiches Partidarios
Afiches PartidariosAfiches Partidarios
Afiches Partidarios
 
PRICE revised 20160817
PRICE revised 20160817PRICE revised 20160817
PRICE revised 20160817
 
Megan Salamone Marketing Services
Megan Salamone Marketing ServicesMegan Salamone Marketing Services
Megan Salamone Marketing Services
 
Pim Fortuyn
Pim FortuynPim Fortuyn
Pim Fortuyn
 
Presentation1 Abul Hasnat
Presentation1 Abul HasnatPresentation1 Abul Hasnat
Presentation1 Abul Hasnat
 
AriZona Teashop
AriZona TeashopAriZona Teashop
AriZona Teashop
 
Corporate Profile Presentation V2.0 (1)
Corporate Profile Presentation V2.0 (1)Corporate Profile Presentation V2.0 (1)
Corporate Profile Presentation V2.0 (1)
 
13212435 -pss7
13212435 -pss713212435 -pss7
13212435 -pss7
 
Ppt 5
Ppt 5Ppt 5
Ppt 5
 
Hp Printer Brochure For Customer Reference
Hp Printer Brochure For Customer ReferenceHp Printer Brochure For Customer Reference
Hp Printer Brochure For Customer Reference
 
Takrifan ketaksamaan peluang pendidikan dalam konteks malaysia
Takrifan ketaksamaan peluang pendidikan dalam konteks malaysiaTakrifan ketaksamaan peluang pendidikan dalam konteks malaysia
Takrifan ketaksamaan peluang pendidikan dalam konteks malaysia
 

Similaire à Customized Low-cost Excel-based IT Solutions 090602

In Automated Controls It’s No Longer the Traditional Build vs. Buy
In Automated Controls It’s No Longer the Traditional Build vs. BuyIn Automated Controls It’s No Longer the Traditional Build vs. Buy
In Automated Controls It’s No Longer the Traditional Build vs. BuyMelissa Luongo
 
Jagged Peak Supply Chain Solution
Jagged Peak Supply Chain SolutionJagged Peak Supply Chain Solution
Jagged Peak Supply Chain Solutionaharrison75
 
Chp05 Enterprise Apps
Chp05 Enterprise AppsChp05 Enterprise Apps
Chp05 Enterprise AppsChuong Nguyen
 
Industrializing investment banking_wp_2
Industrializing investment banking_wp_2Industrializing investment banking_wp_2
Industrializing investment banking_wp_2EMC
 
Heavy Civil Contractors: ERP Solution
Heavy Civil Contractors:  ERP SolutionHeavy Civil Contractors:  ERP Solution
Heavy Civil Contractors: ERP SolutionVisibility by Design
 
ImpactECS and SAP for Manufacturing eBook
ImpactECS and SAP for Manufacturing eBookImpactECS and SAP for Manufacturing eBook
ImpactECS and SAP for Manufacturing eBook3C Software
 
10 perspective technology platforms_for_business_integration
10 perspective technology platforms_for_business_integration10 perspective technology platforms_for_business_integration
10 perspective technology platforms_for_business_integrationKaizenlogcom
 
Oracle Process Manufacturing for Specialty Chemicals - Value Proposition
Oracle Process Manufacturing for Specialty Chemicals - Value PropositionOracle Process Manufacturing for Specialty Chemicals - Value Proposition
Oracle Process Manufacturing for Specialty Chemicals - Value PropositionDavid White
 
Improving Speed to Market in E-commerce
Improving Speed to Market in E-commerceImproving Speed to Market in E-commerce
Improving Speed to Market in E-commerceCognizant
 
NEORACLEUG Thermo Fisher Case Study
NEORACLEUG Thermo Fisher Case StudyNEORACLEUG Thermo Fisher Case Study
NEORACLEUG Thermo Fisher Case StudyAlithya
 
IBM Enterprise Content Management Solutions -Making your industry our business
IBM Enterprise Content Management Solutions -Making your industry our businessIBM Enterprise Content Management Solutions -Making your industry our business
IBM Enterprise Content Management Solutions -Making your industry our businessGanesh Rajapur
 
Business Process Modeling & Automation: Where are we?
Business Process Modeling & Automation: Where are we?Business Process Modeling & Automation: Where are we?
Business Process Modeling & Automation: Where are we?Denis Gagné
 
Merits of integrated business software applications
Merits of integrated business software applicationsMerits of integrated business software applications
Merits of integrated business software applicationsmorenews222
 
Removing the barriers to business transformation with ArchiMate
Removing the barriers to business transformation with ArchiMateRemoving the barriers to business transformation with ArchiMate
Removing the barriers to business transformation with ArchiMateCorso
 
ECM BPM Strategy With Enterprise Architecture Maturity Model
ECM BPM Strategy With Enterprise Architecture Maturity ModelECM BPM Strategy With Enterprise Architecture Maturity Model
ECM BPM Strategy With Enterprise Architecture Maturity ModelDavid Champeau
 
21st century realities
21st century realities21st century realities
21st century realitiesAdarsh Pete
 
Briefing Simplicité Software (English)
Briefing Simplicité Software (English)Briefing Simplicité Software (English)
Briefing Simplicité Software (English)Simplicité Software
 

Similaire à Customized Low-cost Excel-based IT Solutions 090602 (20)

Chp08 Building Erp
Chp08 Building ErpChp08 Building Erp
Chp08 Building Erp
 
In Automated Controls It’s No Longer the Traditional Build vs. Buy
In Automated Controls It’s No Longer the Traditional Build vs. BuyIn Automated Controls It’s No Longer the Traditional Build vs. Buy
In Automated Controls It’s No Longer the Traditional Build vs. Buy
 
Jagged Peak Supply Chain Solution
Jagged Peak Supply Chain SolutionJagged Peak Supply Chain Solution
Jagged Peak Supply Chain Solution
 
Chp05 Enterprise Apps
Chp05 Enterprise AppsChp05 Enterprise Apps
Chp05 Enterprise Apps
 
Industrializing investment banking_wp_2
Industrializing investment banking_wp_2Industrializing investment banking_wp_2
Industrializing investment banking_wp_2
 
Heavy Civil Contractors: ERP Solution
Heavy Civil Contractors:  ERP SolutionHeavy Civil Contractors:  ERP Solution
Heavy Civil Contractors: ERP Solution
 
ImpactECS and SAP for Manufacturing eBook
ImpactECS and SAP for Manufacturing eBookImpactECS and SAP for Manufacturing eBook
ImpactECS and SAP for Manufacturing eBook
 
10 perspective technology platforms_for_business_integration
10 perspective technology platforms_for_business_integration10 perspective technology platforms_for_business_integration
10 perspective technology platforms_for_business_integration
 
mec_ebook12
mec_ebook12mec_ebook12
mec_ebook12
 
Oracle Process Manufacturing for Specialty Chemicals - Value Proposition
Oracle Process Manufacturing for Specialty Chemicals - Value PropositionOracle Process Manufacturing for Specialty Chemicals - Value Proposition
Oracle Process Manufacturing for Specialty Chemicals - Value Proposition
 
om assignment.docx
om assignment.docxom assignment.docx
om assignment.docx
 
Improving Speed to Market in E-commerce
Improving Speed to Market in E-commerceImproving Speed to Market in E-commerce
Improving Speed to Market in E-commerce
 
NEORACLEUG Thermo Fisher Case Study
NEORACLEUG Thermo Fisher Case StudyNEORACLEUG Thermo Fisher Case Study
NEORACLEUG Thermo Fisher Case Study
 
IBM Enterprise Content Management Solutions -Making your industry our business
IBM Enterprise Content Management Solutions -Making your industry our businessIBM Enterprise Content Management Solutions -Making your industry our business
IBM Enterprise Content Management Solutions -Making your industry our business
 
Business Process Modeling & Automation: Where are we?
Business Process Modeling & Automation: Where are we?Business Process Modeling & Automation: Where are we?
Business Process Modeling & Automation: Where are we?
 
Merits of integrated business software applications
Merits of integrated business software applicationsMerits of integrated business software applications
Merits of integrated business software applications
 
Removing the barriers to business transformation with ArchiMate
Removing the barriers to business transformation with ArchiMateRemoving the barriers to business transformation with ArchiMate
Removing the barriers to business transformation with ArchiMate
 
ECM BPM Strategy With Enterprise Architecture Maturity Model
ECM BPM Strategy With Enterprise Architecture Maturity ModelECM BPM Strategy With Enterprise Architecture Maturity Model
ECM BPM Strategy With Enterprise Architecture Maturity Model
 
21st century realities
21st century realities21st century realities
21st century realities
 
Briefing Simplicité Software (English)
Briefing Simplicité Software (English)Briefing Simplicité Software (English)
Briefing Simplicité Software (English)
 

Customized Low-cost Excel-based IT Solutions 090602

  • 1. two GLoBaL eYeS Copyright © 2009 May 2009 Customized Low-cost Excel-based IT Solutions www.twoglobaleyes.com 1 Companies that lack appropriate IT involvement are at a disadvan- tage when competing with competi- tors that use performance- enhancing technology Customized Low-cost Excel-based IT Solutions By Brentt Bugler TECHNOLOGY HELPS COMPANIES MANAGE THEIR OPERATIONS Downward price pressure, rising costs and intensifying competition have put companies under increasing pressure to control costs, provide better quality products and services, and respond faster to customers’ ever-changing needs. In the past companies streamlined their operations by focusing internally on production processes—creating more efficient cells and improving material flow. But now, this is not enough, and improvement efforts are being applied to management processes and transactional activities such as controlling the supply chain, reducing inventory and manufacturing to customer demand. Being truly efficient has taken on a whole new level of com- plexity. The integrated set of transactional activities that a company uses to develop strategy, translate it into operational actions, and monitor the improvement and effectiveness of both, is called its management operating system (MOS). Corporate underperformance is usually due to MOS short- comings, rather than insufficient resources or managers’ lack of ability and effort. The MOS is made up of IT applications and human systems. Companies that lack appropriate IT involvement are at a disadvantage when competing with competitors that use performance-enhancing technology. The objectives of IT applications are wide-ranging, with each application serving a specific need within the overall system. At the end of the day, however, they all com- bine to serve a common purpose—to help the company compete effectively and efficiently by streamlining and standardizing its processes. Forecasting, scheduling, production control, inven- tory control, production reporting, external financial reporting, supplier performance management and estimating/pricing are just a few of the hundreds of management processes that companies must carry out reliably, accurately and quickly on a day-to-day basis to be a force in the market- place. OFF-THE-SHELF AND CUSTOM-DESIGNED APPLICATIONS The cost of commercialized applications ranges from under $100,000 to hundreds of millions of dollars. Most companies (small- and medium-sized companies in particular) cannot afford that kind of investment, especially during economic downturns. Those that can, often find that the
  • 2. two GLoBaL eYeS Copyright © 2009 May 2009 Customized Low-cost Excel-based IT Solutions www.twoglobaleyes.com 2 The cost of outsourcing the develop- ment and implementation of Excel- based tools is a fraction of the com- bined cost of purchasing an equivalent commercial off-the-shelf alternative and installing it capability of generic off-the-shelf software does not exactly meet the peculiarities of their proc- esses—falling short in some areas (thereby neutralizing the company’s core strength) whilst pro- viding features they do not need in others. Companies pay for these surplus capabilities. Furthermore, larger systems require more data, unnecessarily complicating the process. Managers are often ill-equipped to work with complex instruments, increasing the likelihood that applica- tions do not fully realize their intended purposes. Custom-designed applications offered by soft- ware development houses call for much larger investments and are even less affordable. Some innovative companies are finding that they can overcome the off-the-shelf issues and high costs. These companies have opted for a flexible, inexpensive solution that can be tailor-made to their exact needs. They are using a tool that most companies already have—Excel. EXCEL-BASED APPLICATIONS The value of Excel as the basis for MOSs is not appreciated by most. Excel is an underutilized resource in most organizations, and can serve as the platform for its MOS. Since almost every company has Excel installed throughout its organization, no additional capital investment is nec- essary. Not all companies have the in-house expertise to develop Excel-based tools from scratch. How- ever, the cost of outsourcing the development and implementation of Excel-based tools is a frac- tion of the combined cost of purchasing an equivalent commercial off-the-shelf alternative and installing it. Once installed, running and updating an Excel-based application is routine. Anyone who is profi- cient in Excel can be shown how to make post-installation changes to a well-designed system. Most computer users work with Excel. Their familiarity and proficiency with the tool provides their organizations with the skills to maintain their own Excel-based systems. Excel is flexible. It is straightforward to change or add to an existing Excel program. This is not the case for custom- designed or off-the-shelf applications which usually require extensive re-architecting, external resources, and lengthy lead times. A difficulty of Excel-based systems in the past, was that it is not a database and its storage capac- ity is limited. That is no longer a problem since Microsoft released SharePoint and Performance- Point, enabling businesses to source input for many Excel files from a central server.
  • 3. two GLoBaL eYeS Copyright © 2009 May 2009 Customized Low-cost Excel-based IT Solutions www.twoglobaleyes.com 3 7 STEPS TO INSTALLING EXCEL-BASED MANAGEMENT OPERATING SYSTEMS Step 1: Streamline the Production Process Process efficiencies are often diminished by breaks and weaknesses that are unknowingly built into the company’s production flows. Therefore, before the management system is built or tech- nology is introduced, the production processes must be streamlined. It is essential that the systems developer digs down and finds out what drives the business, and where the pain points are. He streamlines the process by eliminating non-value-adding activities, minimizing waste, and se- quencing the process to carry out activities at the ideal points in the process. Only once produc- tion process problems are resolved, should the MOS be designed and automated. Automation without streamlining increases waste. Step 2: Integrate and Customize the System Successful companies utilize their resources in a manner that is valued by their customers. The best companies deploy their resources better than their competitors can. They use their MOSs to reinforce their strengths and enhance competitiveness. The first step in developing an MOS is to recognize the role of each process or activity in the company’s overall performance, and determine which process steps are key to attaining competi- tive strength. Few processes are performed in isolation—most processes rely on other processes for input. The developer must understand how the company’s processes integrate and how they need to be coordinated. For example, a Canadian supplier of polyethylene bags manufactures to stock. It produces a range of bag types, each comprising up to 220 different products. To compete, the company must re- spond quickly to fluctuations in customer demand. To do so profitably, it must maintain inventory at a level that is high enough to avoid stock-outs, but low enough to minimize the risk of stock obsolescence. (Customers often change bag designs at short notice, immediately rendering exist- ing stock obsolete.) The company dedicates between two and four machines to the manufacture of each bag type. The system by which the bag company managed its manufacturing processes in the past was cumbersome and subject to human error. Updating sales forecasts, controlling inventory levels and scheduling production were seen as independent activities and were not integrated. Produc- tion schedule updates could not keep up with customer needs and manufacturing requirements, resulting in dissatisfied customers, high costs and a stressed-out production scheduler. It is normal for companies’ production schedules to undergo change during the production cycle due to machine problems, labour issues, raw material shortages, unexpected orders, etc. However, the bag company often had to discard the weekly schedule before the end of the week’s first twelve-hour shift due to the many changes. The company’s failure to keep customers satisfied and costs under control was costing them business. They needed a robust and integrated system, centred around a master production schedule (MPS), aligned with finished goods stock levels and sales forecasts. The scheduler needed a clear vision of all the factors affecting the scheduling process.
  • 4. two GLoBaL eYeS Copyright © 2009 May 2009 Customized Low-cost Excel-based IT Solutions www.twoglobaleyes.com 4 Situations where scheduling and control are crucial to companies’ suc- cess are not un- common With scheduling and control pivotal to overall corporate effectiveness, the company turned to an Excel-based scheduling solution. Situations where scheduling and control are crucial to compa- nies’ success are not uncommon. Other examples where Excel has met companies’ scheduling needs include:  A North American airline support service provider assembles, stocks, dispatches and loads the equipment and supplies its customers (the major airlines) need to provide passengers with in-flight services. It delivers the kits to the aircraft during the time they are parked on the apron. The Excel-based MOS centres around a backward (just-in-time) scheduling mechanism. It integrates customers’ flight schedules and adapts production activities to passenger fluctuations, flight changes and last-minute aircraft switches. These MOS changes have added value to the company’s service, as reflected by a drop in penalties for causing customer flight delays.  A six-site tea producer in South Africa implemented a production scheduling system to effect a 33% improvement in harvesting productivity. The system accommodates the uncertainties that are inherent in agriculture—it is able to maintain a con- stant-sized harvesting team and ensure a consistent flow of green-leaf to the on-site factories despite unpredictable daily fluctuations in crop availability due to sudden changes in weather conditions.  A global German carmaker installed an Excel-based scheduling and control system on the production line of two of its most popular models at its South African plant. On-the-floor controls and corrective action tools, implemented at operator, group leader and supervisor levels, generated significant quantifiable improvements in cost, quality and delivery, generat- ing an annualized 2.5:1 return on investment. Step 3: Reconstruct Key Processes into Competitive Strengths Two types of system elements make up the MOS. Skeleton elements provide essential capabilities and are prerequisite to the functioning of the system. They are common in all systems of similar type, regardless of the basis on which the company competes. Such elements require a minimum level of adequacy, which, once achieved, has no further effect on performance. For example, pro- duction scheduling systems look up or derive production standards (e.g. machine and labour stan- dards, product specifications, etc) in order to schedule production runs. Once the system is capa- ble of determining its standards accurately, there is little benefit to be gained by developing its standard-generating capability further. The second type of element adds muscle to the system. This type of element affects the key as- pects of the process (i.e. the steps in the process that are the source of the company’s competitive strength). It is the systems developer’s responsibility to design, incorporate and fully leverage this element to the company’s advantage. Only once he fully understands the process, the overall sys- tem and how they combine, can the system developer maximize the capability of the system. He gains this insight by spending time observing and analyzing the process, and working closely with line staff and other users of the system.
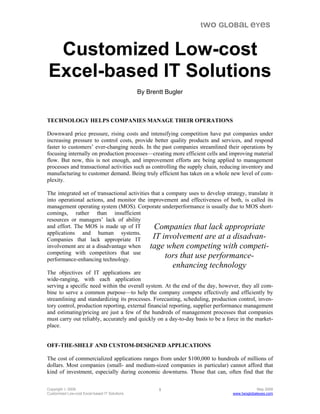
  • 5. two GLoBaL eYeS Copyright © 2009 May 2009 Customized Low-cost Excel-based IT Solutions www.twoglobaleyes.com 5 4 3 PM 2 SD 11 12 13 1 2 3 4 5 6 7 3 GI30SER2636CL 321234.1 4 226 8.71 1,326 226 300 400 400 1 GI55PCL3038CL 321235 800 19.87 800 800 3 GI55JAM3038CL 321236 100 2.01 100 100 4 GI79CAT3038BK 321237 200 5.34 200 200 1 GI56SYS3038BK 321238 200 5.34 200 200 3 GI56STU3038BK 321239.1 3 900 16.84 3,000 900 1,000 1,100 1 GI56SER3038BK 321240 640 15.99 640 640 7 GI56PRO3038BK 321241 200 5.34 200 200 4 GI56JAM3038BK 321242 360 7.04 360 360 4 GI57STU3038BK 321243.1 2 500 6.55 800 500 300 5 GI57PRO3038BK 321244 1,040 16.23 1,040 1,040 8 GI57PCL3038BK 321245 600 9.58 600 600 5 GI53COL3038BK 321246 900 22.29 900 900 0 0 0.00 0 0 0 0 0.00 0 0 6 GRGLENC2010BK 330001 400 10.18 400 400 2 PM 270005 4 0.50 4 0 2 SD 270006 6 0.50 6 0 2 PM 270007 7 0.50 7 0 9 GI30SER2636CL 270008 200 7.76 200 200 0 0 10 GI30SER2636CL 321234.2 321234.1 300 11.39 11 GI30SER2636CL 321234.3 321234.1 400 15.02 12 GI30SER2636CL 321234.4 321234.1 400 15.02 5 GI56STU3038BK 321239.2 321239.1 1,000 18.66 6 GI56STU3038BK 321239.3 321239.1 1,100 20.47 7 GI57STU3038BK 321243.2 321243.1 300 4.13 0 0 0 0 0.00 12 5 7 WORK ORDER NUMBERING CONVENTION NOTE: 6 digit W/O numbers—single-run W/Os Input into yellow cells only 7 digit W/O numbers—split W/Os MASTERPRDNSCHEDINSERTSSPLITW/Os PRODUCTION SEQUENCER 1-Jul-04 Machines: 11, 12, 13 Machine sequence: Product Code Work Order No. Preventive Maintenance Shutdownweek-starting: LEGEND Cases per work order split No. work order splits Product cases or PM/SD hours Machine hours Total work order cases or PM/SD hours Figure 1. The Production Sequencer increases scheduling flexibility To compete profitably in the polyethylene bag market, the bag manufacturer must provide its customers with product at short notice and at low cost. Critical elements in its Excel-based system include:  Structured forecast variance reports highlight major forecast-versus-actual sales variances, enabling Sales to focus on the largest forecast discrepancies, giving direction to forecasting improvement efforts. Improved forecast accuracy has significantly lowered inventory levels, thereby reducing costs without increasing the risk of stock-outs.  The stock control tool predicts situations where too little inventory endangers customer ser- vice, and too much inventory unnecessarily increases costs. This enables the company to maintain optimal inventory levels.  The production scheduling mechanism incorporates a production insert capability. It allows selected rush orders to bypass the sales forecasting and MPS processes, and inserts them directly into the current week’s production schedule (see Figure 1) without disrupting the schedule. (Preventive Maintenance and Machine Shutdowns are scheduled in the same way.) Such flexibility and responsiveness is valued by customers.  The production sequencing r more, can be split into up to seven shorter work orders and tep 4 element enables the subdivi- sion of work. Work orders, which otherwise tie up a single machine for two days o spread across several machines over a longer period of time. This gives the scheduler more options and enhances production scheduling flexibility, facilitating improved machine utiliza- tion rates and higher efficiencies, without increasing costs. S : Simplify System Administration and Operations management system should be intuitive and automate many of the data inputs that users would he bag manufacturer’s scheduling system draws most of its data automatically from system A otherwise do manually, minimizing user effort and reducing human error. Not only does this im- prove the reliability of the schedule, but it also saves time reworking input errors later on. T components such as sales forecasts, the MPS and the standards database. However, few systems are exclusively automated. Where manually inputted decisions (such as machine choice, produc- tion sequence and number of work order splits) are necessary, it is important that the input
  • 6. two GLoBaL eYeS Copyright © 2009 May 2009 Customized Low-cost Excel-based IT Solutions www.twoglobaleyes.com 6 4 3 PM 2 SD seq? zero volume split W/O negative split W/O 9.58 900 22.29 W/O? cases? 0 0.50 hours? 0.50 200 7.76 W/O split? zero volume split W/O 0 #N/A no produc 11 12 13 1 2 3 4 5 6 7 3 GI30SER2636CL 321234.1 4 226 0.00 1,326 226 300 400 400 1 GI55PCL3038CL 321235 800 19.87 800 800 3 GI55JAM3038CL 321236 100 2.01 100 100 4 GI79CAT3038BK 321237 200 5.34 200 200 1 GI56SYS3038BK 321238 200 5.34 200 200 3 GI56STU3038BK 321239.1 3 2,000 36.81 3,000 2,000 1,000 1 GI56SER3038BK 321240 640 15.99 640 640 7 GI56PRO3038BK 321241 200 5.34 200 200 4 GI56JAM3038BK 321242 360 7.04 360 360 4 GI57STU3038BK 321243.1 2 -200 -1.92 800 -200 1,000 5 GI57PRO3038BK 321244 1,040 16.23 1,040 1,040 8 GI57PCL3038BK 321245 600 600 600 5 GI53COL3038BK 900 900 0 0 0.00 0 0 0 0 0.00 0 0 6 GRGLENC2010BK 330001 400 2 PM 270005 0 2 SD 270006 6 0.50 6 0 2 PM 270007 7 7 0 9 GI30SER2636CL 270008 8 200 200 13 t 0 0 10 GI30SER2636CL 321234.2 32123 GI30SER2636CL 321234.3 32123 12 GI30SER2636CL 321234.4 32123 incorrect machine sequence 5 GI56STU3038BK 321239.2 321239.1 1,000 18. machine not specified 6 GI56STU3038BK 321239.3 321239.1 0 0.50 work order no. missing 7 GI57STU3038BK 321243.2 321243.1 1,000 12. PM/SD hours not specified 0 0 0 0 0. work order split exceeds 7 13 5 7 number of cases not specified WORK ORDER NUMBERING CONVENTIO 4.1 300 11.39 4.1 400 15.02 machine? 4.1 400 15.02 seq? 66 machine? W/O? 60 hours? 00 W/O split? cases? N NOTE: no product product name not specified 6 digit W/O numbers—single-run W/Os Input into y cases of W/O split equals zero 7 digit W/O numbers—split W/Os total W/O cases less than sum of split W/Os week-starting: LEGEND ellow cells only zero volume split W/O negative split W/O Preventive Maintenance Shutdown PRODUCTION SEQUENCER 1-Jul-04 Machines: 11, 12, 13 Product Code Work Order No. No. work order splits Product cases or PM/SD hours MASTERPRDNSCHEDINSERTSSPLITW/Os Machine sequence: Machine hours Total work order cases or PM/SD hours KEY--RED FLAG ALERTS Cases per work order split mechanism is user friendly. The system uses drop-down lists wherever possible, e.g. week starting date and product codes for in- serts (see Figure 1 and Figure 2), and alerts the scheduler to insufficient production capacity, potential stock-outs and incorrectly formatted data inputs. Figure 2 shows how red flag alerts warn the sched- uler that data entries are incomplete or wrong. He only proceeds to the next step in the schedul- ing process once all the red flag alerts have been resolved. Despite improved control on the line, schedule changes are unavoidable. The bag manufacturing tep 5 scheduling system can accommodate schedule updates at various points in the production cycle without the need for lengthy data gathering and time-consuming calculations. The scheduler up- dates the weekly schedule within minutes of the end of each shift, providing subsequent shifts with accurate and relevant schedules. S : Design Insight-giving Metrics anagement needs to control operations, measure performance and make decisions. Despite ex- o generate decision-making information and metrics, companies capture and maintain data. M pensive enterprise systems, many companies still lack the information they need to make good business decisions. In most cases it is not the lack of information that causes the problem—it is a lack of insight and quality of information. Employees concentrate on the metrics they are given. Unless the system’s metrics measure the real issues, the important problems and con- cerns will not be addressed. System devel- opers, in collaboration with senior manage- ment and operations managers, must design easily-understood metrics that provide awareness and understanding of decisive issues. T MOSs often meet with resistance from users because of the large amount of data that they are required to record during the course of their jobs. Too little data leads to over-simplified indicators, less-than-adequate understanding of the causes of variances and unreliable predictions of consequences of a decision. Too much data in- Figure 2. Red flag alerts incorporated into the Production Scheduler enhance data input accuracy and save data entry time Unless the system’s metrics measure the real issues, the im- portant problems and concerns will not be addressed
  • 7. two GLoBaL eYeS Copyright © 2009 May 2009 Customized Low-cost Excel-based IT Solutions www.twoglobaleyes.com 7 creases the bureaucratic burden on employees, diverting their attention away from their core activities. An effective MOS makes the information visible at the point where it can be used to create value. It pushes real-time decision-making to the worker level, freeing supervisors and managers to spend more time planning, working more closely with customers and suppliers, and concentrating on continuous process improvement. The carmaker’s produc- tion scheduling and control system incorpo- rates short-interval pro- duction controls and root cause analysis tools. Operators can identify production variances in real-time and predict future prob- lems. Analysis of the carmaker’s process in- dicated a close correla- tion between the time spent by group leaders outside their respective production cells and the downstream occurrence of quality issues such as off-lines and recurring faults. The percentage of the group leader’s time spent outside his cell area is an important predictor of quality and as such is monitored on a short-interval basis (see Figure 3). Group leaders and operators spend no more than two minutes every hour recording the necessary production data. The numbers provide immediate insight into current variances and problems, highlighting potential issues, and guiding the operator toward im- mediate corrective and preventive action (when required). Figure 4 shows similar short-interval pro- duction controls used by the bag manufacturer. Both the carmaker and the bag manufacturer found value in root cause analysis tools which guide machine operators to immediate corrective action in the event of line problems. Operators are able to resolve issues without having to call on supervisors for assistance (see Figure 5). The supervisor intervenes only if the operator is unable to deal with the issue on his own. am: 6:10-7 7-8 8-9 9:10-10 10-11 11-12 12:30-13 13-14 14-14:30 Shift-End pm: 14:40-15:30 15:30-16:30 16:30-17 17:10-18 18-19 19-20 20:30-21 21-22 22-23 Data Plan 11 25 32 43 57 71 78 92 106 Actual Plan Start Dust cover 6 Mirrors 7 Panel, knob 8 Elec control 9 Out-of-Area: A - Meeting B - Personal C - Other Area D - Offlines E - Working on line F - Admin G - Training Breakdowns: A - Line Equipmt B - Battery Gun C - Battery D - Torque ASSEMBLY: DOOR SUB-ASSEMBLY—Fitment SHIFT: GROUP LEADER: SUPERVISOR: Signed: DATE: Absentees: MANPOWER Cumulative Units Operator out of cell Minutes Reason Code QUALITY CP6A Defects Offlines Out-of-Cell (minutes) Reason Code DRIFT Corrective Action PRODUCTN Cumulative Plan Cumulative Actual Variance Controllable Variance Corrective Action REASON CODES SHORTGSMTCE Break Downs Minutes Reason Code Notes Figure 3. The carmaker’s short-interval control for the door sub-assembly (fitment) production cell Group leaders and operators spend no more than two minutes every hour recording the necessary production data
  • 8. two GLoBaL eYeS Copyright © 2009 May 2009 Customized Low-cost Excel-based IT Solutions www.twoglobaleyes.com 8 8am- 8pm Crew Sign-Off (1): Sign-Off (2): Plan Date: 8:00 AM NOT VALID BEFORE: Plan P/Cum Act A/Cum Plan1 Act1 Plan2 Act2 8:00 AM 321246.0 GI53COL3038BK 1 19.95 180 900 639 0 10:00 AM 321246.0 GI53COL3038BK 1 0.0000 0 900 83 83 721 0 12:00 PM 321246.0 GI53COL3038BK 1 0.0000 0 900 83 165 804 0 2:00 PM 321246.0 GI53COL3038BK 1 0.0000 0 900 83 248 887 0 4:00 PM 330001.0 GRGLENC2010BK 2 11.338 180 400 83 330 900 69 6:00 PM 330001.0 GRGLENC2010BK 2 0.0000 0 400 83 413 152 8:00 PM 330001.0 GRGLENC2010BK 2 0.0000 0 400 83 496 0 234 10:00 PM 330001.0 GRGLENC2010BK 2 0.0000 0 400 83 83 0 317 12:00 AM 330001.0 GRGLENC2010BK 2 0.0000 0 400 83 165 0 400 2:00 AM 321241.0 GI56PRO3038BK 1 18.416 180 200 83 248 82 482 4:00 AM 321241.0 GI56PRO3038BK 1 0.0000 0 200 83 330 165 6:00 AM 321245.0 GI57CPL3038BK 2 12.469 180 600 111 442 200 76 8:00 AM 321245.0 2 0.0000 0 600 132 553 208 Lbs Scheduled Day: 5,620 Night: Total: 11,240 MACHINE 11 DAILY PRODUCTION CONTROL 7/3/04 12:00 AM3-Jul-04 end time Work Order Product Change 8pm- 8am Crew Cuts / Min Lbs / Case Order Cases Cases on skid 2-Hourly Cases Running Order Total Reason for Variance Action 5,620 Plan P P P P P P Prevent- able on-the-floortraining on-the-floortraining fixproblemorsubmitMaintenance workorder fixproblemorsubmitMaintenance workorder refertomanager refertomanager fixproblemorcallsubmit Maintenanceworkorder fixproblemorcallsubmit Maintenanceworkorder getoperatorfromdownmachine, otherwisegetonefromanother machinedependingonpriority getoperatorfromdownmachine, otherwisegetonefromanother machinedependingonpriority findtherightfilm,orchange sequenceonschedule,depending onpriority findtherightcartons(call Warehouse),orchangesequence onschedule,dependingonpriority findbaskets,orusebaskets allocatedtoanotherworkorderby changingtheschedulesequence, dependingonpriority on-the-floortraining on-the-floortraining havemanagerdothescheduleand printlatestversion havemanagercorrecttheschedule andprintlatestversion fixproblemorsubmitMaintenance workorder fixproblemorsubmitMaintenance workorder confrontoperatorandenforce compliance confrontsetupoperatorand enforcecompliance havemanagercorrecttheschedule andprintlatestversionassoonas possible refertomanager refertomanager CORRECTIVEACTION: STEP1 SPECIAL INSTRUCTNS If no improvement, go to Step 2 STEP 2: CALL THE SUPERVISOR ROOT CAUSE ANALYSIS - VOLUME VARIANCE ANALYSIS & CORRECTIVE ACTION SCRAP DOWNTIME AdministrativeSkills Machine Performance Film Quality Breakdown Manning Inputs Skills SPEED Machine Performance Compliance Administrative operator setup mech mech elec absent movedelec no film no cartons no baskets operator setup operator sched wrong no sched mech elec operator setup operator sched wrong blends repro Film Quality reproblends Step 6: Develop Structured Reports A good MOS provides decision-support. It incorporates structured reporting—robust operating reports generated by the systematic capture of operating data in order to recognize potential prob- lems and opportunities without further analysis. The reports highlight performance and variances, aid the quick resolution of repetitive questions, and form the basis for objective decision-making. Figure 5. The bag manufacturer’s production line root cause analysis tool cuts down on the amount of time supervisors and managers spend on crisis management Figure 4. The bag manufacturer’s short-interval control—it is updated every two hours by the machine operator
  • 9. two GLoBaL eYeS Copyright © 2009 May 2009 Customized Low-cost Excel-based IT Solutions www.twoglobaleyes.com 9 Short-term reports trig- ger remedial action on off-schedule conditions. They are most effective in bringing production back on track when used in conjunction with root cause analysis tools. The carmaker’s shop managers review the daily operating re- ports (DORs) with their respective area supervi- sors, who are account- able for production variances (see Figure 6). Together they plan preventive action to fix recurring problems. . report operating Longer-term reports target managers higher up the hierarchy. They promote continuous im- provement and facilitate the management of business objectives. The carmaker’s weekly produc- tion reports (WPRs) are seven-day rolling reports, one for each shop (body shop, assembly, etc). Each report highlights performance in critical performance areas (schedule, cost, quality, morale) The WPRs are posted on the company’s intranet and is updated daily. The produc- tion manager reviews each shop’s WPR with the shop manager at his weekly pro- duction review meeting. Scorecards and shows trends over the last two to three months (see Figure 7) performance in relative terms (ratios), rather than absolute numbers, enabling comparisons across operat- ing areas regardless of hier- archical level, size, volume, process, etc. The carmaker measures production in critical areas, and compares performance across cells, areas, shops, sites or shifts. The scorecard has the flexi- bility of reporting perform- ance over any period. Figure 8. The carmaker’s weekly production report for the assembly line Paint Shp Eng Plant Shortages Breakdns Absentees Other Shift 1 106 99 -7 0 0 0 7 1 -1 Loading unit on trolly Shift 2 106 106 0 0 0 0 0 11 -11 TOTAL 212 205 -7 0 0 0 7 12 -12 Absents % Trim Elec Roller Minutes % Mezzanine 65% 1 23 2890 87.9% 92% 3 75.0% 0 1270 73.4% 83% 3 85.0% 89% 2 91.7% TBS 2 58% 1 95.5% 91% 1 97.2% 2 29 5 0 0 Cockpit 1 0 0 0 0 Door Sub-Assy 1 11 4 0 2708 97.8% 0 0 1 TBS 1 0 8 9 0 3656 96.1% 0 0 8 102 5 0 3287 100.0% 0 0 Mainline 1 96.2% 0 0 0 0 4275 98.8% 460 0 Angle torque faulty Mainline 2 2 23 0 0 3566 89.6% 0 0 Trim Final 90% 0 100.0% 0 0 0 0 2738 98.9% 0 0 23 Roller Test 1 HRP 14 B5 3 TOTAL 14 173 23 23 24390 94.0% 460 0 49 SUPPL RELTNS 77% 4 86.7% 81% 15 92.4% Absents % 72% 2 94.4% 81% 1 90.9% TBS 1 104% 1 92.9% Trim Elec Roller Minutes % Mezzanine 1 14 15 15 2205 90.0% 0 0 Cockpit 3 0 0 0 1195 92.6% 0 0 Door Sub-Assy 87% 0 100.0% 1 11 0 0 1999 96.9% 0 0 8 1 0 2 0 2688 94.7% 0 0 Jansen TBS 2 66% 2 90.0% 4 77 3 0 2451 100.0% 0 0 Mainline 1 88% 0 100.0% 1 0 4 0 3189 98.9% 460 0 Angle torque faulty Mainline 2 77% 1 96.4% 2 27 3 0 2922 98.5% 0 0 Trim Final 92% 0 100.0% 0 0 0 0 2019 97.8% 0 0 23 Roller Test 2 HRP 14 B5 8 TOTAL 84% 7 96.0% 13 129 27 15 18668 96.5% 460 0 67 A4 ASSY 3 43058 95.1% 920 0 ASSEMBLY: DAILY OPERATING REPORT SCHED Plan Actual Var Lost units REMARKS Date from (and including): 16-Jul-02 SHIFT 1 PRDN PERF WIP Date to (and including): Group Leader in Cell 16-Jul-02 Shortage Minutes Breakdn Minutes REMARKS SYSTEM NON- COMPLIANCE (Missing SICs) ATTENDANCE QUALITY Offlines Recurring Defects SHIFT 2 PRDN PERF ATTENDANCE QUALITY Offlines Recurring Defects Group Leader in Cell 5 2 WIP SUPPL RELTNS Breakdn Minutes Shortage Minutes REMARKS SYSTEM NON- COMPLIANCE (Missing SICs) 4 8 74% 22 94.1% 27 302 50 8 Figure 6. The carmaker’s daily operating report for the assembly line 16-Jul-02 Paintshop Eng Plant Shortages Breakdns Absentees Assembly Shortages 1 04-Jul 20 98% 0 0 4 1 0 04-Jul-02 3.89 85% 32 4 2 08-Jul 20 98% 0 0 0 5 0 08-Jul-02 4.86 89% 22 0 3 09-Jul 20 98% 0 0 0 0 0 09-Jul-02 5.25 85% 31 2 4 10-Jul-02 2 212 100% 0 0 0 0 0 10-Jul-02 5.15 85% 32 26 5 11-Jul-02 212 201 -11 95% 0 0 3 8 0 11-Jul-02 5.38 89% 23 17 6 15-Jul-02 212 196 -16 92% 0 0 0 1 15 15-Jul-02 5.12 82% 35 0 7 16-Jul-02 212 205 -7 97% 0 0 0 0 7 16-Jul-02 4.85 87% 27 0 1 04-Jul-02 3596 84 0 2 08-Jul-02 3568 58 0 3 09-Jul-02 3599 73 0 4 10-Jul-02 3581 87 0 5 11-Jul-02 3591 97 0 6 15-Jul-02 3522 27 0 7 16-Jul-02 3514 27 0 This Week Last Month Previous Month Target Training Hours KEY FOR GRAPHS: -02 212 7 -5 -02 212 7 -5 -02 212 8 -4 12 0 COST Date Normal Hours Overtime Hours Date Faults / Unit Direct Runners Offlines ASSEMBLY: WEEKLY PRODUCTION REPORT 7 working days (up to and including): SCHEDULE Date tu V Attain Lost Units QUALITY Plan Ac al ariance NMTU 13 14 15 16 17 18 19 4-Jul 8-Jul 9-Jul 10-Jul 11-Jul 15-Jul 16-Jul ATTENDANCE 92% 93% 94% 95% 96% 97% 98% 99% 4-Jul 8-Jul 9-Jul -Jul -Jul -Jul -Jul 10 11 15 16 RUN RATE ATTAINMENT 90% 92% 94% 96% 98% 100% 102% 4-Jul 8-Jul 9-Jul 10-Jul 11-Jul 15-Jul 16-Jul DIRECT RUNNERS 80% 82% 84% 86% 88% 90% 92% 4-Jul 8-Jul 9-Jul 10-Jul 11-Jul 15-Jul 16-Jul FAULTS/UNIT 0 1 2 3 4 5 6 4-Jul 8-Jul 9-Jul 10-Jul 11-Jul 15-Jul 16-Jul LOST UNITS Breakdns 34% Absentees 50% Paintshop 0% Shortages 16% Eng Plant 0% Paintshop Eng Plant Shortages Breakdns Absentees OFFLINES Shortages 13% Assembly 56% Paintshop 5% Engine Plant 5% Bodyshop 21% Bodyshop Paintshop Engine Plant Shortages Assembly DIRECT HOURS Normal 98% Overtime 2% Sunday 0% Training 0% Saturday 0% Normal Overtime Saturday Sunday Training Figure 7. The carmaker’s weekly production report for the assembly line
  • 10. two GLoBaL eYeS Copyright © 2009 May 2009 Customized Low-cost Excel-based IT Solutions www.twoglobaleyes.com 10 Step 7: Institutionalize Behaviour A company’s modus operandi evolves over many years’ development and refinement of its proc- esses. This knowledge is very valuable to the organization, but is often not formally documented, usually residing in the heads of those that developed it. It is passed on in the workplace from one worker to the next. Through such an informal transfer of knowledge, many of the intricacies of the process, and the logic behind it, are not recorded, compromising the company’s strengths as workers come and go, especially during times of mass layoffs or resignations. The reality today is that the people doing the work know a lot more about their jobs than their bosses do. As the process evolves undocumented, senior management increasingly loses touch with operations, opening up a divide between senior management and those on the floor or in the field. It is at this point that the ques- tion of alignment between strategy and operations can become an issue. A key step in the implementation of the Excel-based system is to ensure that processes are procedurized and documented. This enables managers to keep up with the development of processes, enforce discipline and compliance, and exert control over operations. At the same time it em- powers employees, facilitates training and ensures dependable execution of operations. Standardization and conformity set the company up for the retention of knowledge, institutionalize behaviour, and provide a platform from which to deliver consistent quality and service, and improve productivity and cost control. CONCLUSION Generic or packaged IT solutions rarely enable companies to leverage their full potential in the marketplace. Companies are distinct in many ways—what might be perfect for one company could be detrimental to another. Customized management operating systems are essential for any company wishing to gain a competitive advantage. As a company grows, technologies advance and customer needs and wants shift, the company’s management system needs to change too. It must keep pace with the ever-changing environment within which the company operates. Over-investment in a rigid off-the-shelf or custom-designed system that is costly to adapt when changes become necessary in a few years’ time, doesn’t make economic sense. A well-designed Excel-based system resolves the issue. Standardization and conformity set the company up for the retention of knowledge, institutionalize behav- iour, and provide a platform from which to deliver consistent quality and service, and improve productiv- ity and cost control
  • 11. two GLoBaL eYeS Copyright © 2009 May 2009 Customized Low-cost Excel-based IT Solutions www.twoglobaleyes.com 11 ABOUT TWO GLOBAL EYES Two Global Eyes develops corporate solutions, it doesn’t sell programs—it designs singular solu- tions to suit the unique problems and opportunities of companies. The underlying premise is that all companies can make better use of what they already have and needn’t incur additional capital expenditure to improve profitability. Two Global Eyes follows a hands-on approach—working face-to-face with the client at all levels in the office, in the field or on the shop floor. Active in- volvement of the client’s people, without distracting them from their normal day-to-day responsi- bilities, ensures that the improvement activities get done and that installations are sustainable in the long-term. To find out more about Two Global Eyes, visit www.twoglobaleyes.com. Brentt Bugler is the founder of Two Global Eyes. He has successfully developed and in- stalled cost-effective customized corporate solutions on three continents covering a broad spectrum of industries. His clients range from small local and regional compa- nies to some of the largest and most success- ful global corporations. Brentt has a B.Sc. (Engineering) from the University of Cape Town, a B.Com. from the University of South Africa and an M.B.A. from the Uni- versity of Minnesota’s Carlson School of Management.