Unit-IV; Professional Sales Representative (PSR).pptx
Krupa rm
1. 1
CHAPTER 1:
PART- A: QUESTION AND ANSWERS
Question 1. Explain in detail different stages of data processing.
Answer - Much of data management is essentially about extracting useful information from
data. To do this, data must go through a data mining process to be able to get meaning out of
it. There is a wide range of approaches, tools and techniques to do this, and it is important to
start with the most basic understanding of processing data
What is Data Processing?
Data processing is simply the conversion of raw data to meaningful information through a
process. Data is manipulated to produce results that lead to a resolution of a problem or
improvement of an existing situation. Similar to a production process, it follows a cycle
where inputs (raw data) are fed to a process (computer systems, software, etc.) to produce
output (information and insights).
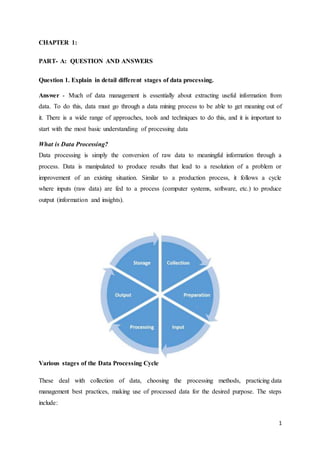
Various stages of the Data Processing Cycle
These deal with collection of data, choosing the processing methods, practicing data
management best practices, making use of processed data for the desired purpose. The steps
include:
2. 2
a. Data Collection: This is the first step which will provide the data for the input. Collecting
data is a hard work in its own but is most essential on which the results depend. The quality
of input will determine the quality of output. This data collection can be done in various
ways by primary or secondary sources. This data may include census data, GDP or other
monetary figures, data about number of industries, profit of a company etc. Depending
upon the data requirement its source must be identified from which data will be collected.
b. Preparation/ Sieving: Some people consider this as a part of processing but does not
involve any processing. Preparation include sorting and filtering of data which will finally
be used as input. This stage required you to remove the extra or unusable data to make
processing faster and better. This is a broad step in reducing the quantity of data to yield
better result.
c. Input: This is feeding of raw and sieved data for purpose of processing. If input is not
done properly or done wrong then the result will be adversely effected as software follow
the rule of “Garbage in – garbage out”. Utmost care should be taken to provide right data.
d. Processing: This is the step where data is processed by mechanical or automated means.
The processed data is one which gives information to the user and can be put to use. The
raw data cannot be understood and thus needs processing which is done in this step.
Processing of data may take time depending on the complexity of the data and the volume
of data which is provided as input. The step of preparation mentioned above helps in
making this process faster.
e. Output/ Result – This is the last step of data processing cycle as the processed data is
delivered in form of information/results in this step. Once the result or output is received it
may further be processed or interpreted by the user or software for further value addition.
This output can also be used directly in presentations or the records. This output may even
be saved as be used as a input for further data processing which then becomes a part of
cycle which is being discussed. If this data is not used as input then this complete process
cannot be considered as cycle and will remain to be a onetime activity of data processing.
For using this data as input it must be stored or simultaneously be available for further
processing.
All these steps or stages have a particular sequence which must be followed if processing is
done manually as the automatic processing have inbuilt algorithms with pre-defined steps. In
3. 3
automatic processing the chances of error are drastically reduced but this happens only when
the input is a correct data or data set.
Question 2: Explain in brief the measures of Central tendency.
Answer: A measure of central tendency is a single value that attempts to describe a set of
data by identifying the central position within that set of data. As such, measures of central
tendency are sometimes called measures of central location. They are also classed as
summary statistics. The mean (often called the average) is most likely the measure of central
tendency that you are most familiar with, but there are others, such as the median and the
mode.
The mean, median and mode are all valid measures of central tendency, but under different
conditions, some measures of central tendency become more appropriate to use than others.
In the following sections, we will look at the mean, mode and median, and learn how to
calculate them and under what conditions they are most appropriate to be used.
Mean (Arithmetic):
The mean (or average) is the most popular and well known measure of central tendency. It
can be used with both discrete and continuous data, although its use is most often with
continuous data (see our Types of Variable guide for data types). The mean is equal to the
sum of all the values in the data set divided by the number of values in the data set. So, if we
have n values in a data set and they have values x1, x2, ..., xn, the sample mean, usually
denoted by (pronounced x bar), is:
This formula is usually written in a slightly different manner using the Greek capitol letter, ,
pronounced "sigma", which means "sum of...":
4. 4
You may have noticed that the above formula refers to the sample mean. So, why have we
called it a sample mean? This is because, in statistics, samples and populations have very
different meanings and these differences are very important, even if, in the case of the mean,
they are calculated in the same way. To acknowledge that we are calculating the population
mean and not the sample mean, we use the Greek lower case letter "mu", denoted as µ:
The mean is essentially a model of your data set. It is the value that is most common. You
will notice, however, that the mean is not often one of the actual values that you have
observed in your data set. However, one of its important properties is that it minimizes error
in the prediction of any one value in your data set. That is, it is the value that produces the
lowest amount of error from all other values in the data set.
An important property of the mean is that it includes every value in your data set as part of
the calculation. In addition, the mean is the only measure of central tendency where the sum
of the deviations of each value from the mean is always zero.
Median
The median is the middle score for a set of data that has been arranged in order of magnitude.
The median is less affected by outliers and skewed data. In order to calculate the median,
suppose we have the data below:
65 55 89 56 35 14 56 55 87 45 92
We first need to rearrange that data into order of magnitude (smallest first):
14 35 45 55 55 56 56 65 87 89 92
Our median mark is the middle mark - in this case, 56 (highlighted in bold). It is the middle
mark because there are 5 scores before it and 5 scores after it. This works fine when you have
5. 5
an odd number of scores, but what happens when you have an even number of scores? What
if you had only 10 scores? Well, you simply have to take the middle two scores and average
the result. So, if we look at the example below:
65 55 89 56 35 14 56 55 87 45
We again rearrange that data into order of magnitude (smallest first):
14 35 45 55 55 56 56 65 87 89
Only now we have to take the 5th and 6th score in our data set and average them to get a
median of 55.5.
Mode
The mode is the most frequent score in our data set. On a histogram it represents the highest
bar in a bar chart or histogram. You can, therefore, sometimes consider the mode as being the
most popular option. An example of a mode is presented below:
Question 3: Explain different methods of determining correlation.
Answer: We shall consider the following most commonly used methods. (1) Scatter Plot (2)
Karl Pearson’s coefficient of correlation (3) Spearman’s Rank-correlation coefficient.
6. 6
1. Scatter Plot (Scatter diagram or dot diagram): In this method the values of the two
variables are plotted on a graph paper. One is taken along the horizontal (x-axis) and the
other along the vertical (y-axis). By plotting the data, we get points (dots) on the graph which
are generally scattered and hence the name ‘Scatter Plot’.
i) If all points lie on a rising straight line the correlation is
perfectly positive and r = +1 (see fig.1)
ii) If all points lie on a falling straight line the correlation is
perfectly negative and r = -1 (see fig.2)
iii) If the points lie in narrow strip, rising upwards, the
correlation is high degree of positive (see fig.3)
iv) If the points lie in a narrow strip, falling downwards, the
correlation is high degree of negative (see fig.4)
v) If the points are spread widely over a broad strip, rising
upwards, the correlation is low degree positive (see fig.5)
vi)If the points are spread widely over a broad strip, falling
downward, the correlation is low degree negative (see fig.6)
vii) If the points are spread (scattered) without any specific
pattern, the correlation is absent. I.e. r = 0. (See fig.7)
Though this method is simple and is a rough idea about the existence and the degree of
correlation, it is not reliable. As it is not a mathematical method, it cannot measure the degree
of correlation.
2. Karl Pearson’s coefficient of correlation: Karl Pearson’s Coefficient of Correlation is
widely used mathematical method wherein the numerical expression is used to calculate the
degree and direction of the relationship between linear related variables.
7. 7
Pearson’s method, popularly known as a Pearsonian Coefficient of Correlation, is the most
extensively used quantitative methods in practice. The coefficient of correlation is denoted
by “r”.
If the relationship between two variables X and Y is to be ascertained, then the following
formula is used:
Properties ofCoefficient ofCorrelation
The value of the coefficient of correlation (r) always lies between ±1. Such as:
r=+1, perfect positive correlation
r=-1, perfect negative correlation
r=0, no correlation
The coefficient of correlation is independent of the origin and scale. By origin, it means
subtracting any non-zero constant from the given value of X and Y the value of “r” remains
unchanged. By scale it means, there is no effect on the value of “r” if the value of X and Y is
divided or multiplied by any constant.
The coefficient of correlation is a geometric mean of two regression
coefficient. Symbolically it is represented as:
The coefficient of correlation is “zero” when the variables X and Y are independent. But,
however, the converse is not true.
8. 8
3. Spearman’s Rank Correlation Coefficient is the non-parametric statistical measure used
to study the strength of association between the two ranked variables. This method is applied
to the ordinal set of numbers, which can be arranged in order, i.e. one after the other so that
ranks can be given to each.
In the rank correlation coefficient method, the ranks are given to each individual on the basis
of its quality or quantity, such as ranking starts from position 1st and goes till Nth position for
the one ranked last in the group.
The formula to calculate the rank correlation coefficient is:
Where, R = Rank coefficient of correlation
D = Difference of ranks
N = Number of Observations
The value of R lies between ±1 such as:
R =+1, there is a complete agreement in the order of ranks and move in the same direction.
R=-1, there is a complete agreement in the order of ranks, but are in opposite directions.
R =0, there is no association in the ranks.
9. 9
Question 4: Distinguish between Regression & Correlation tools of analysis.
Answer: Correlation and Regression are the two analysis based on multivariatedistribution.
A multivariate distribution is described as a distribution of multiple variables. Correlation is
described as the analysis which lets us know the association or the absence of the relationship
between two variables ‘x’ and ‘y’. On the other end, Regression analysis, predicts the value
of the dependent variable based on the known value of the independent variable, assuming
that average mathematical relationship between two or more variables.
Key Differences between Correlation and Regression
10. 10
The points given below, explains the difference between correlation and regression in detail:
1. A statistical measure which determines the co-relationship or association of two
quantities is known as Correlation. Regression describes how an independent variable
is numerically related to the dependent variable.
2. Correlation is used to represent the linear relationship between two variables. On the
contrary, regression is used to fit the best line and estimate one variable on the basis
of another variable.
3. In correlation, there is no difference between dependent and independent variables i.e.
correlation between x and y is similar to y and x. Conversely, the regression of y on x
is different from x on y.
4. Correlation indicates the strength of association between variables. As opposed to,
regression reflects the impact of the unit change in the independent variable on the
dependent variable.
5. Correlation aims at finding a numerical value that expresses the relationship between
variables. Unlike regression whose goal is to predict values of the random variable on
the basis of the values of fixed variable.
Question 5: Discuss the steps in testing Hypothesis.
Answer: The word hypothesis was originated from a Greek word hyposthenia whose actual
meaning is to suppose, a proposal. Thus hypothesis is defined as a supposition, assumption or
recognition that is made for the sake of dispute. It is an uncertain clarification/explanation for
the observation, phenomenon and any scientific research that are to be checked and
experienced for more information or a message or an opinion for the certain partial
verification (Browein, 2008).
11. 11
PURPOSE
The purpose of conducting hypothesis is to give an opportunity to different industries,
universities, public laboratories as well as government agencies etc. to have a debate,
presentations and the recent advances made on various researches made by them.
EXPLANATION
As the hypothesis is the prediction of some scientific research and to know about some
further descriptions. Hypothesis doesn’t means that it must be right because hypothesis result
may be right or wrong depending upon the research and wrong results are completely
acceptable in hypothesis. Good hypothesis depends upon the elements and testing of the
research with complete tools. It is a very important part of scientific method and is important
component in every discipline. Basically the hypothesis is done on known data and
information.
ELEMENTS OF A GOOD HYPOTHESIS
A better hypothesis depends upon some factors which are;
• Whether the hypothesis is based on the selective researched topics or not.
• The hypothesis is well tested.
• Does the hypothesis include dependent and independent variables?
STEPS IN HYPOTHESIS TESTING
As the hypothesis is conducted to know whether the research is right or wrong and for that
testing step are conducted for approval or disapproval.
• Stating the research question.
It is the first step in research problem in which the researcher recognizes the population
interest, related variables and defining the parameters.
• Specify null and alternative hypothesis
12. 12
The second step is specifying the type of hypothesis. The null hypothesis is used for the
population and alternative hypothesis is use in terms of direction in case of greater or less.
• Calculate test statistics
Another step is to calculate the statistic view in analogous pattern by using the parameters of
null hypothesis.
• Compute probability and rejection region
In the fourth step, the probability value is calculated which is examined as if the significant
value is more than the null hypothesis is not rejected and vice versa.
• State conclusions
The final step is the conclusion in which descriptions are made. This step consists of two
statements; first statement is about the null and alternative hypothesis and second statement is
about the proposed research questions while determining the first statement.
Question 6: Explain different parametric tests in during hypothesis testing.
Answer: A parametric hypothesis test make assumptions about the underlying distribution of
the population from which the sample is being drawn, and which is being investigated. This
is typically that the population conforms to a normal distribution.
Parametric hypothesis tests include:
Chi Square Test
The Chi-Square 'Goodness of Fit' test is used to test whether a sample is drawn from a
population that conforms to a specified distribution.
The hypothesis is:
H0 the sample conforms to the specified distribution
13. 13
H1 the sample does not conform to the distribution
The test is illustrated by example. An organization has three categories of employees, 'A', 'B'
and 'C'. It collects the following data:
Category # Employees Days Sick
A 100 10
B 60 12
C 40 14
Total 200 36
The organization wants to test the hypothesis:
H0 the proportion of sickness is the same for each category of employees
H1 the proportion of sickness differs between categories
The first step is to form the table. The 'expected' column shows the results that would be
expected if the proportions were equal between categories ie. if the null hypothesis were true:
Category
#
Employees
Days
Well
Expected
Chi-Square
Contribution
Days
Sick
Expected
Chi-Square
Contribution
A 100 90 82.0 0.78 10 18.0 3.56
B 60 48 49.2 0.03 12 10.8 0.13
C 40 26 32.8 1.41 14 7.2 6.42
Total 200 164 164 2.22 36 36 10.11
F Test
The F Test is used to compare the variances of two samples to test the hypothesis that the
samples are drawn from populations with different variances:
H0 the samples are drawn from populations with equal variances
14. 14
H1 the samples are drawn from populations with different variances
The F test is based on the ratio of the variances of the two samples:
1 2 3 4 5 Variance
Sample
A
8.7 9.8 12.2 12.9 9.5 3.327
Sample
B
23.8 21.5 18.3 24.3 22.9 5.788
This gives an F statistic:
One Sample t-Test
The One Sample t-Test is a hypothesis test used to test the mean of a small sample taken
from a population with a normal distribution against a specified value. The hypothesis is:
H0 the population mean equals a specified value
H1 the popular mean is [equal to/less than/greater than] a specified value
sample mean
μ 0 specified value
s sample standard deviation
n sample size
15. 15
The critical value of the t statistic t0 can be found in t distribution tables, or the p-value can
be found using the Excel function:
z-Test
The z-test is a hypothesis test used to test the mean against a specified value. The z-test is
used where the standard deviation is known or the sample is large (greater than about 30).
The population must also conform to a normal distribution. The hypothesis is:
H0 the population mean equals a specified value
H1 the popular mean is [equal to/less than/greater than] a specified value
The test is:
where:
sample mean
μ 0 specified value
s sample standard deviation
n sample size
The p-value can be obtained from Excel using the function:
one-tail test: = 1 - NORMSDIST(Z0)
16. 16
Question 7: Write short note on Chi-Square.
Answer: Chi-Square Test
The Chi-Square test is used to determine if there is a significant relationship between two
nominal (categorical) variables. The frequency of one nominal variable is compared with
different values of the second nominal variable. The data can be displayed in an R*C
contingency table, where R is the row and C is the column. For example, a researcher wants
to examine the relationship between gender (male vs. female) and empathy (high vs. low).
The chi-square test of independence can be used to examine this relationship. If the null
hypothesis is accepted there would be no relationship between gender and empathy. If the
null hypotheses is rejected the implication would be that there is a relationship between
gender and empathy (e.g. females tend to score higher on empathy and males tend to score
lower on empathy).
How to calculate the chi-square statistic by hand. First we have to calculate the expected
value of the two nominal variables. We can calculate the expected value of the two nominal
variables by using this formula:
Where
= expected value
= Sum of the ith column
= Sum of the kth column
N = total number
After calculating the expected value, we will apply the following formula to calculate the
value of the Chi-Square test of Independence:
17. 17
= Chi-Square test of Independence
= Observed value of two nominal variables
= Expected value of two nominal variables
Degree of freedom is calculated by using the following formula:
DF = (r-1)(c-1)
Where
DF = Degree of freedom
r = number of rows
c = number of columns
Hypothesis:
Null hypothesis: Assumes that there is no association between the two variables.
Alternative hypothesis: Assumes that there is an association between the two variables.
Hypothesis testing: It is the same for the Chi-Square test of Independence as it is for other
tests like ANOVA, t-test, etc. If the calculated value of the Chi-Square test is greater than the
table value, we will reject the null hypothesis. If the calculated value is less, then we will
accept the null hypothesis.
Question 8: Bring out the essentials of good project report.
Answer: Essential Characteristics or Features of a Good Report
Report provides factual information depending on which decisions are made. So everyone
should be taken to ensure that a report has all the essential qualities which turn it into a good
report. A good report must have the following qualities:
1. Precision
In a good report, the report writer is very clear about the exact and definite purpose of writing
the report. His investigation, analysis, recommendations and others are directed by this
central purpose. Precision of a report provides the unity to the report and makes it a valuable
document for best usage.
18. 18
2. Accuracy of Facts
Information contained in a report must be based on accurate fact. Since decisions are taken on
the basis of report information, any inaccurate information or statistics will lead to wrong
decision. It will hamper to achieve the organizational goal.
3. Relevancy
The facts presented in a report should not be only accurate but also be relevant. Irrelevant
facts make a report confusing and likely to be misleading to make proper decision.
4. Reader-Orientation
While drafting any report, it is necessary to keep in mind about the person who is going to
read it. That's why a good report is always reader oriented. Reader’s knowledge and level of
understanding should be considered by the writer of report. Well reader-oriented information
qualify a report to be a good one.
5. Simple Language
This is just another essential features of a good report. A good report is written in a simple
language avoiding vague and unclear words. The language of the report should not be
influenced by the writer's emotion or goal. The message of a good report should be self-
explanatory.
6. Conciseness
A good report should be concise but it does not mean that a report can never be long. Rather
it means that a good report or a business report is one that transmits maximum information
with minimum words. It avoids unnecessary detail and includes everything which are
significant and necessary to present proper information.
7. Grammatical Accuracy
19. 19
A good report is free from errors. Any faulty construction of a sentence may make its
meaning different to the reader's mind. And sometimes it may become confusing or
ambiguous.
8. Unbiased Recommendation
Recommendation on report usually make effect on the reader mind. So if recommendations
are made at the end of a report, they must be impartial and objective. They should come as
logical conclusion for investigation and analysis.
9. Clarity
Clarity depends on proper arrangement of facts. A good report is absolutely clear. Reporter
should make his purpose clear, define his sources, state his findings and finally make
necessary recommendation. To be an effective communication through report, A report must
be clear to understand for making communication success.
10. Attractive Presentation
Presentation of a report is also a factor which should be consider for a good report. A good
report provides a catchy and smart look and creates attention of the reader. Structure, content,
language, typing and presentation style of a good report should be attractive to make a clear
impression in the mind of its reader.
The inclusion of above factors, features or characteristics, make a good report to be effective
and fruitful. It also helps to achieve the report goal. A reporter who is making the report,
always should be careful about those factors to make his report a good one.
Question 9: Explain different types of research report.
Answer:Research reports vary greatly in length and type. In each individual case, both the
length and the form are largely dictated by the problems at hand. For instance, business firms
prefer reports in the letter form, just one or two pages in length. Banks, insurance
organizations and financial institutions are generally fond of the short balance-sheet type of
tabulation for their annual reports to their customers and shareholders. Mathematicians prefer
to write the results of their investigations in the form of algebraic notations. Chemists report
their results in symbols and formulae. Students of literature usually write long reports
presenting the critical analysis of some writer or period or the like with a liberal use of
20. 20
quotations from the works of the author under discussion. In the field of education and
psychology, the favorite form is the report on the results of experimentation accompanied by
the detailed statistical tabulations. Clinical psychologists and social pathologists frequently
find it necessary to make use of the case-history form.
Technical Report
In the technical report the main emphasis is on thhe methods employed, assumptions made in
the course of the study, the detailed presentation of the findings including their limitations
and supporting data.
A general outline of a technical report can be as follows:
Summary of results: A brief review of the main findings just in two or three pages. Nature of
the study: Description of the general objectives of study, formulation of the problem in
operational terms, the working hypothesis, the type of analysis and data required, etc.
Methods employed: Specific methods used in the study and their limitations. For instance, in
sampling studies we should give details of sample design viz., sample size, sample selection,
etc. Data: Discussion of data collected, their sources, characteristics and limitations. If
secondary data are used, their suitability to the problem at hand be fully assessed. In case of a
survey, the manner in which data were collected should be fully described. Analysis of data
and presentation of findings: The analysis of data and presentation of the findings of the
study with supporting data in the form of tables and charts be fully narrated. This, in fact,
happens to be the main body of the report usually extending over several chapters.
Conclusions: A detailed summary of the findings and the policy implications drawn from the
results be explained. Bibliography: Bibliography of various sources consulted be prepared
and attached. Technical appendices: Appendices be given for all technical matters relating to
questionnaire, mathematical derivations, elaboration on particular technique of analysis and
the like ones. Index: Index must be prepared and be given invariably in the report at the end.
Popular Report
The popular report is one which gives emphasis on simplicity and attractiveness. The
simplification should be sought through clear writing, minimization of technical, particularly
mathematical, details and liberal use of charts and diagrams. Attractive layout along with
large print, many subheadings, even an occasional cartoon now and then is another
characteristic feature of the popular report. Besides, in such a report emphasis is given on
21. 21
practical aspects and policy implications. We give below a general outline of a popular
report.
The findings and their implications: Emphasis in the report is given on the findings of most
practical interest and on the implications of these findings. Recommendations for action:
Recommendations for action on the basis of the findings of the study is made in this section
of the report. Objective of the study: A general review of how the problem arise is presented
along with the specific objectives of the project under study. Methods employed: A brief and
non-technical description of the methods and techniques used, including a short review of the
data on which the study is based, is given in this part of the report. Results:
Question 10: Write short note on MLA and CMS citation method.
Answer: Citation styles differ mostly in the location, order, and syntax of information about
references. The number and diversity of citation styles reflect different priorities with respect
to concision, readability, dates, authors, publications, and, of course, style.
There are also two major divisions within most citation styles: documentary-note style and
parenthetical style. Documentary-note style is the standard form of documenting sources. It
involves using either footnotes or endnotes, so that information about your sources is readily
available to your readers but does not interfere with their reading of your work. This is
generally considered an abbreviated form of citation, and it does not require footnotes or
endnotes, although it does require the equivalent of a "Works Cited" page at the end of the
paper. It is easier to write, but might interfere with how smoothly your work reads.
With so many different citation styles, how do you know which one is right for your paper?
First, we strongly recommend asking your instructor. There are several factors which go into
determining the appropriate citation style, including discipline (priorities in an English class
might differ from those of a Psychology class, for example), academic expectations (papers
intended for publication might be subject to different standards than mid-term papers), the
research aims of an assignment, and the individual preference of your instructor.
22. 22
APA (American Psychological Association) Style originated in 1929, when a group of
psychologists, anthropologists, and business managers convened and sought to establish a
simple set of procedures, or style rules, that would codify the many components of scientific
writing to increase the ease of reading comprehension.
As with other editorial styles, APA Style consists of rules or guidelines that a publisher
observes to ensure clear and consistent presentation of written material. It concerns uniform
use of such elements as selection of headings, tone, and length, punctuation and
abbreviations, presentation of numbers and statistics, construction of tables and figures,
citation of references, and many other elements that are a part of a manuscript. (Source:
Official APA website)
In-text Citation with APA
The APA style calls for three kinds of information to be included in in-text citations.
The author's last name and the work's date of publication must always appear, and these
items must match exactly the corresponding entry in the references list. The third kind of
information, the page number, appears only in a citation to a direct quotation.
MLA (Modern Language Association)style for documentation is widely used in the
humanities, especially in writing on language and literature. MLA style features brief
parenthetical citations in the text keyed to an alphabetical list of works cited that appears at
the end of the work.
Core Elements
Each entry in the list of works cited is composed of facts common to most works—the MLA
core elements. They are assembled in a specific order.
Containers
The concept of containers is crucial to MLA style. When the source being documented forms
part of a larger whole, the larger whole can be thought of as a container that holds the source.
For example, a short story may be contained in an anthology. The short story is the source,
and the anthology is the container.
Question 11: Explain different ethical norms in Research.
23. 23
Answer: Principle 1. NON-HARMFUL PROCEDURES: The investigator should use no
research procedure that may harm the child either physically or psychologically. The
investigator is also obligated at all times to use the least stressful research procedure
whenever possible. Psychological harm in particular instances may be difficult to define;
nevertheless, its definition and means for reducing or eliminating it remain the responsibility
of the investigator. When the investigator is in doubt about the possible harmful effects of the
research procedures, consultation should be sought from others.
Principle 2. INFORMED CONSENT: Before seeking consent or assent from the child, the
investigator should inform the child of all features of the research that may affect his or her
willingness to participate and should answer the child's questions in terms appropriate to the
child's comprehension. The investigator should respect the child's freedom to choose to
participate in the research or not by giving the child the opportunity to give or not give assent
to participation as well as to choose to discontinue participation at any time. Assent means
that the child shows some form of agreement to participate without necessarily
comprehending the full significance of the research necessary to give informed consent.
Principle 3. PARENTAL CONSENT: The informed consent of parents, legal guardians or
those who act in loco parentis (e.g., teachers, superintendents of institutions) similarly should
be obtained, preferably in writing. Informed consent requires that parents or other responsible
adults be informed of all the features of the research that may affect their willingness to allow
the child to participate. This information should include the profession and institution
affiliation of the investigator.
Principle 4. ADDITIONAL CONSENT: The informed consent of any persons, such as
schoolteachers for example, whose interaction with the child is the subject of the study
should also be obtained. As with the child and parents or guardians informed consent requires
that the persons interacting with the child during the study be informed of all features of the
research which may affect their willingness to participate. All questions posed by such
persons should be answered and the persons should be free to choose to participate or not,
and to discontinue participation at any time.
Principle 5. INCENTIVES: Incentives to participate in a research project must be fair and
must not unduly exceed the range of incentives that the child normally experiences. Whatever
incentives are used, the investigator should always keep in mind that the greater the possible
24. 24
effects of the investigation on the child, the greater is the obligation to protect the child's
welfare and freedom.
Principle 6. DECEPTION: Although full disclosure of information during the procedure of
obtaining consent is the ethical ideal, a particular study may necessitate withholding certain
information or deception. Whenever withholding information or deception is judged to be
essential to the conduct of the study, the investigator should satisfy research colleagues that
such judgment is correct.
Principle 7. ANONYMITY: To gain access to institutional records, the investigator should
obtain permission from responsible authorities in charge of records. Anonymity of the
information should be preserved and no information used other than that for which
permission was obtained.
Principle 8. MUTUAL RESPONSIBILITIES: From the beginning of each research
investigation, there should be clear agreement between the investigator and the parents,
guardians or those who act in loco parentis, and the child, when appropriate, that defines the
responsibilities of each. The investigator has the obligation to honor all promises and
commitments of the agreement.
Question 12: Write a note on Plagiarism.
Answer: Plagiarism is the presentation of another person's work as if it were your own. It is a
serious academic offence and, if proved, could result in disqualification. The word
"plagiarism" comes from the Latin plagiarius, a kidnapper. In academic writing, plagiarism is
considered unethical and in academic essays it is penalised. If there is extensive plagiarism,
an essay will be awarded a mark of zero. Plagiarism can take many forms and ranges from
the copying of a short passage from another source, without indicating that it is a quotation
from someone else, to the failure to acknowledge the real source of an idea contained in your
work. This includes altering the order of words or sentences in a passage so that it does not
appear to be a word-for-word copy. Remember that the person who marks your assignment
and/or dissertation has probably read the same publications and journal articles as you have
and would normally recognise copied passages - and even altered passages - in your work.
25. 25
Very often it is easy to spot copied or re-worked passages as the language and style does not
match your own. It is recognised that you are expected, throughout your course, to deal with
other people's ideas and to justify everything you say by referring to their work. However,
you are also expected to use a proper referencing system to do this and to acknowledge all
sources of information. It is your responsibility to ensure that there is no danger that your
writing could be thought to involve a deliberate attempt to deceive the reader into believing a
borrowed or copied idea or passage is your original work. This includes academic sources
and any use of material obtained from other students. All quotations from other sources,
whether published or unpublished, must be properly acknowledged. The referencing system
required by the course concerned must be followed - please check with your tutor and make
sure that you understand it properly. The normal method in use at QMU is the Harvard
referencing system. The system is described at:You must avoid quoting substantial amounts
of material even though you put them within quotation marks and acknowledge the sources
properly. You are supposed to be using the information to come to your own conclusions.
Common examples of plagiarism:
1. Copying whole passages, word-for word, with your own linking sentences.
2. Altering the shapes of sentences. Remember that plagiarism is a serious offence. Don't be
tempted. In many academic essays you will be expected to explain ideas, theories, evidence
and so on which have been written by other scholars: this will demonstrate that you
understand a body of knowledge.
In such cases you should précis, paraphrase, or summaries: that is, express 2 the other
scholar's work in your own words, making sure you reference the other scholar's work
properly. You can also use quotations, as described above. Errors you should avoid are:
Presenting someone else's idea but not documenting it, so the idea seems to be yours.
Presenting someone else's words without documenting it, so they seem to be part of your
writing. Quoting someone else's words - perhaps even documenting them - but failing to
signal they are a quotation by using quotation marks or indentation. Self-plagiarism –
significant reuse of your own work submitted as assignments in other modules (you cannot
accrue marks more than once for the same material). Note: It is not good enough to simply
place the details of the work you are referring to in the References section, you must
acknowledge other people's work as soon as you refer to it in the main body of your text, for
example by the use of footnotes.
26. 26
You can avoid unintentional plagiarism by following these two rules suggested by Rosen &
Behrens (1992):
1. Whenever you quote the exact words of others, place these words within quotation marks
and properly cite the source.
2. Whenever you paraphrase or summaries the ideas of others, do not use whole phrases,
many of the same words, or sentence structures similar to the original. You must identify the
source of the paraphrased or summarized material: do not assume that you are under no
obligation to credit your source if you simply change the wording of the original statement or
alter the sentence structure. The only exception to this rule is if the information is common
knowledge
Question 13: State the use of SPSS statistics for Data analysis and Reporting.
Answer: SPSS is a Windows based program that can be used to perform data entry and
analysis and to create tables and graphs. SPSS is capable of handling large amounts of data
and can perform all of the analyses covered in the text and much more. SPSS is commonly
used in the Social Sciences and in the business world, so familiarity with this program should
serve you well in the future. SPSS is updated often. This document was written around an
earlier version, but the differences should not cause any problems
Opening SPSS Depending on how the computer you are working on is structured, you can
open SPSS in one of two ways. 1. If there is an SPSS shortcut like this on the desktop, simply
put the cursor on it and double click the left mouse button. 2. Click the left mouse button on
the button on your screen, then put your cursor on Programs or All Programs and left click
the mouse. Select SPSS 17.0 for Windows by clicking the left mouse button. (For a while that
started calling the program PASW Statistics 17, but they seem to have given that up as a
dumb idea when everyone else calls it SPSS. The version number may change by the time
you read this.) Either approach will launch the program.
Data Collection and Organization
27. 27
SPSS is often used as a data collection tool by researchers. The data entry screen in SPSS
looks much like any other spreadsheet software. You can enter variables and quantitative data
and save the file as a data file. Furthermore, you can organize your data in SPSS by assigning
properties to different variables. For example, you can designate a variable as a nominal
variable, and that information is stored in SPSS. The next time you access the data file, which
could be weeks, months or even years, you'll be able to see exactly how your data is
organized.
Data Output
Once data is collected and entered into the data sheet in SPSS, you can create an output file
from the data. For example, you can create frequency distributions of your data to determine
whether your data set is normally distributed. The frequency distribution is displayed in an
output file. You can export items from the output file and place them into a research article
you're writing. Therefore, instead of recreating a table or graph, you can take the table or
graph directly from the data output file from SPSS.
Statistical Tests
The most obvious use for SPSS is to use the software to run statistical tests. SPSS has all of
the most widely used statistical tests built-in to the software. Therefore, you won't have to do
any mathematical equations by hand. Once you run a statistical test, all associated outputs are
displayed in the data output file. You can also transform your data by performing advanced
statistical transformations. This is especially useful for data that is not normally distributed.
28. 28
PART B: INTRODUCTION TO THE CORE TOPIC
Bharti Airtel Limited is an Indian global telecommunications services company based
in New Delhi, India. It operates in 18 countries across South Asia, Africa, and the Channel
Islands. Airtel provides GSM, 3G and 4G LTE mobile services, fixed line broadband and
voice services depending upon the country of operation. It is the largest mobile network
operator in India and the third largest in the world with 325 million subscribers. Airtel was
named India's second most valuable brand in the first ever Brandz ranking by Millward
Brown and WPP plc.
Airtel is credited with pioneering the business strategy of outsourcing all of its business
operations except marketing, sales and finance and building the 'minutes factory' model of
low cost and high volumes. The strategy has since been adopted by several operators. Airtel's
equipment is provided and maintained by Ericsson and Nokia Solutions and
Networks whereas IT support is provided by IBM. The transmission towers are maintained
by subsidiaries and joint venture companies of Bharti including Bharti Infratel and Indus
Towers in India.[] Ericsson agreed for the first time to be paid by the minute for installation
and maintenance of their equipment rather than being paid up front, which allowed Airtel to
provide low call rates of ₹1(1.5¢ US)/minute. Airtel India is the largest provider of mobile
telephony and second largest provider of fixed telephony in India, and is also a provider
of broadband and subscription television services. The brand is operated by several
subsidiaries of Bharti Airtel, with Bharti Hexacom and Bharti Telemedia providing
broadband fixed line services and Bharti Infratel providing telecom passive infrastructure
29. 29
service such as telecom equipment and telecom towers.Bharti Airtel Limited is part of Bharti
Enterprises and is headed by Sunil Bharti Mittal.
Airtel is the first Indian telecom service provider to achieve Cisco Gold Certification.[5] It
also acts as a carrier for national and international long distance communication services. The
company has a submarine cable landing station at Chennai, with a connection to Singapore.
As of September 2016, Airtel has 255.73 million subscribers with a market share of 24.7% in
the Indian telephony market. Airtel was named India' second most valuable brand in the first
ever Brandz ranking by Millward Brown and WPP plc.
Airtel operates in all telecom circles of India. Airtel is the largest operator in rural India, with
256.80 million subscribers as of July 2016.
3G
On 18 May 2010, the 3G spectrum auction was completed and Airtel paid the Government of
India ₹122.95 billion (US$1.8 billion) for spectrum in 13 circles, the most amount spent by
an operator in that auction. Airtel won 3G licences in 13 telecom circles of
India: Delhi, Mumbai, Andhra Pradesh, Karnataka, Tamil Nadu, Uttar Pradesh
(West), Rajasthan, West Bengal, Himachal Pradesh, Bihar, Assam, North East, and Jammu &
Kashmir. Airtel also operates 3G services in Maharashtra & Goa and Kolkata circles through
an agreement with Vodafone and in Gujarat and Punjab through an agreement with Idea. This
gives Airtel a 3G presence in all 22 out of 22 circles in India. Airtel is fined by DoT
3.50 billion for not stopping offering 3G Services through Roaming Pacts outside its
Licensed Zones in Seven Circles.
On 20 September 2010, Bharti Airtel said that it had given contracts to Ericsson India, Nokia
Siemens Networks (NSN) and Huawei Technologies to set up infrastructure for providing 3G
services in the country. These vendors would plan, design, deploy and maintain 3G–HSPA
(third-generation, high-speed packet access) networks in 13 telecom circles where the
company had won 3G licences. While Airtel awarded network contracts for seven 3G circles
to Ericsson India, NSN would manage networks in three circles. Chinese telecom equipment
vendor Huawei Technologies was introduced as the third partner for three circles.
Airtel launched 3G services in Bangalore on 24 January 2011. On 27 January 2011, Airtel
launched 3G in Chennai and Coimbatore in Tamil Nadu. On 27 July 2011, 3G services were
launched in Kerala's 3 largest cities – Kochi, Kozhikode and Thiruvananthapuram.
30. 30
Airtel 3G services are available in 200 cities through its network and in 500 cities through
intra-circle roaming arrangements with other operators. Airtel had about 5.4 million 3G
customers of which 4 million are 3G data customers as of September 2012. Airtel has 3G
licence in all 22 circles.
4G
On 19 May 2010, the broadband wireless access (BWA) or 4G spectrum auction in
India ended. Airtel paid ₹33.1436 billion (US$490 million) for spectrum in 4
circles: Maharashtra and Goa, Karnataka, Punjab and Kolkata.The company was allocated
20 MHz of BWA spectrum in 2.3 GHz frequency band. Airtel's TD-LTE network is built and
operated by ZTE in Kolkata and Punjab, Huawei in Karnataka, and Nokia Siemens
Networks in Maharashtra and Goa. On 10 April 2012, Airtel launched 4G services through
dongles and modems using TD-LTE technology in Kolkata, becoming the first company in
India to offer 4G services. The Kolkata launch was followed by launches in Bangalore (7
May 2012),Pune (18 October 2012), and Chandigarh, Mohali and Panchkula (25 March
2013) Airtel obtained 4G licences and spectrum in the telecom circles
of Delhi, Haryana, Kerala and Mumbai after acquiring Wireless Business Services Private
Limited, a joint venture founded by Qualcomm, which had won BWA spectrum in those
circles in the 4G spectrum auction.
Airtel launched 4G services on mobile from February 2014. The first city to get the service
was Bangalore.Airtel has started their 4G services in Karnal and Yamunanagar in Haryana on
16 June 2015. Airtel 4G trials has been started in Delhi from 18 June 2015.Airtel had
1,20,000 4G subscribers as of May 2014.
As of March 2016, Airtel provides 4G coverage in 350 cities in 15 circles. Airtel extended its
4G network to 15 km off India's coastline, following a request by the Indian Navy.
VoLTE
On 3 November 2016, The Economic Times reported that Airtel had awarded a ₹402 crore
(US$60 million) contract to Nokia to implement Voice over Long-Term Evolution (VoLTE)
technology on the operator's network nationwide. Airtel had previously awarded a smaller
contract to Nokia for trial of VoLTE technology in select circles in early 2016. Airtel
subscribers will be able to place VoLTE calls in areas covered by LTE. If LTE is not
available in the area, the call will fall back to 3G or 2G.[29] Airtel is expected to launch
VoLTE services in early 2017.
31. 31
HISTORY
In 1984, Sunil Mittal started assembling push-button phones in India, which he earlier used to
import from a Taiwan company, Kingtel, replacing the old fashioned, bulky rotary
phones that were in use in the country then. Bharti Telecom Limited (BTL) was incorporated
and entered into a technical tie up with Siemens AG of Germany for manufacture of
electronic push button phones. By the early 1990s, Bharti was making fax machines, cordless
phones and other telecom gear. He named his first push-button phones as 'Mitbrau'.
In 1992, he successfully bid for one of the four mobile phone network licences auctioned
in India. One of the conditions for the Delhi cellular license was that the bidder have some
experience as a telecom operator. So, Mittal clinched a deal with the French telecom
group Vivendi. He was one of the first Indian entrepreneurs to identify the mobile telecom
business as a major growth area. His plans were finally approved by the Government in
1994 and he launched services in Delhi in 1995, when Bharti Cellular Limited (BCL) was
formed to offer cellular services under the brand name Airtel. Within a few years Bharti
became the first telecom company to cross the 2-million mobile subscriber mark. Bharti also
brought down the STD/ISD cellular rates in India under brand name 'India one'.
In 1999, Bharti Enterprises acquired control of JT Holdings, and extended cellular operations
to Karnataka and Andhra Pradesh. In 2000, Bharti acquired control of Skycell
Communications, in Chennai. In 2001, the company acquired control of Spice Cell
in Calcutta. Bharti Enterprises went public in 2002, and the company was listed on Bombay
Stock Exchange and National Stock Exchange of India. In 2003, the cellular phone
operations were re-branded under the single Airtel brand. In 2004, Bharti acquired control of
Hexacom and entered Rajasthan. In 2005, Bharti extended its network to Andaman and
Nicobar. This expansion allowed it to offer voice services all across India.
Airtel launched "Hello Tunes", a Caller ring back tone service (CRBT), in July 2004
becoming to the first operator in India to do so. The Airtel theme song, composed by A.R.
Rahman, was the most popular tune on that year.
32. 32
In May 2008, it emerged that Airtel was exploring the possibility of buying the MTN Group,
a South Africa-based telecommunications company with coverage in 21 countries in Africa
and the Middle East. The Financial Times reported that Bharti was considering
offeringUS$45 billion for a 100% stake in MTN, which would be the largest overseas
acquisition ever by an Indian firm. However, both sides emphasise the tentative nature of the
talks, while The Economist magazine noted, "If anything, Bharti would be marrying up," as
MTN has more subscribers, higher revenues and broader geographic coverage. However, the
talks fell apart as MTN Group tried to reverse the negotiations by making Bharti almost a
subsidiary of the new company. In May 2009, Bharti Airtel again confirmed that it was in
talks with MTN and the companies agreed to discuss the potential transaction exclusively by
31+ July 2009. Talks eventually ended without agreement, some sources stating that this was
due to opposition from the South African government.
In 2009, Bharti negotiated for its strategic partner Alcatel-Lucent to manage the network
infrastructure for the fixed line business. Later, Bharti Airtel awarded the three-year contract
to Alcatel-Lucent for setting up an Internet Protocol access network across the country. This
would help consumers access internet at faster speed and high quality internet browsing on
mobile handsets.
In 2009, Airtel launched its first international mobile network in Sri Lanka. In June 2010,
Bhartil acquired the African business of Zain Telecom for $10.7 billion making it the largest
ever acquisition by an Indian telecom firm. In 2012, Bharti tied up with Wal-Mart, the US
retail giant, to start a number of retail stores across India. In 2014, Bharti planned to
acquire Loop Mobile for ₹7 billion (US$100 million), but the deal was called off later.
Bharti Airtel Limited ("Airtel"), the world's third largest mobile operator with operations in
20 countries across Asia and Africa, today said that its Treasury division has been adjudged
as a highly commended winner of the Top Treasury Team (Asia) Awards at the Adam Smith
Asia Awards 2015.
33. 33
CHAPTER 2 : RESEARCH METHODOLOGY
“The process used to collect information and data for the purpose of making business
decisions. The methodology may include publication research, interviews, surveys
and other research techniques, and could include both present and historical
information.”
Research methodology is a way to systematically solve the research problem. It may
be understood as a science of studying how research is done scientifically. In it we
study the various steps that are generally adopted by a researcher in studying his
research problem along with the logic behind them. It is necessary for the researcher
to know not only the research methods/techniques but also the methodology.
Researchers not only need to know how to develop certain indices or tests, how to
calculate the mean, the mode, the median or the standard deviation or chi-square, how
to apply particular research techniques, but they also need to know which of these
methods or techniques, are relevant and which are not, and what would they mean and
indicate and why. Researchers also need to understand the assumptions underlying
various techniques and they need to know the criteria by which they can decide that
certain techniques and procedures will be applicable to certain problems and others
will not. All this means that it is necessary for the researcher to design his
methodology for his problem as the same may differ from problem to problem. For
example, an architect, who designs a building, has to consciously evaluate the basis of
his decisions, i.e., he has to evaluate why and on what basis he selects particular size,
number and location of doors, windows and ventilators, uses particular materials and
not others and the like. Similarly, in research the scientist has to expose the research
decisions to evaluation before they are implemented. He has to specify very clearly
and precisely what decisions he selects and why he selects them so that they can be
evaluated by others also. From what has been stated above, we can say that research
methodology has many dimensions and research methods do constitute a part of the
34. 34
research methodology. The scope of research methodology is wider than that of
research methods. Thus, when we talk of research methodology we not only talk of
the research methods but also consider the logic behind the methods we use in the
context of our research study and explain why we are using a particular method or
technique and why we are not using others so that research results are capable of
being evaluated either by the researcher himself or by others. Why a research study
has been undertaken, how the research problem has been defined, in what way and
why the hypothesis has been formulated, what data have been collected and what
particular method has been adopted, why particular technique of analyzing data has
been used and a host of similar other questions are usually answered when we talk of
research methodology concerning a research problem or study.