1. NEW ASPECTS of APPLIED INFORMATICS, BIOMEDICAL ELECTRONICS & INFORMATICS and COMMUNICATIONS
A novel Standardized Uptake Value (SUV) calculation of PET
DICOM files using MATLAB.
PAWITRA MASA-AH and SOMPHOB SOONGSATHITANON*
Nuclear Medicine Division, Department of Radiology,
Faculty of Medicine Siriraj Hospital, Mahidol University,
2 Prannok Rd., Bangkoknoi, Bangkok, 10700
THAILAND
*Corresponding author: sissst@mahidol.ac.th
Abstract: - This paper presents a novel SUV calculation scheme for PET DICOM files using
MATLAB and the results are compared with the SUV taken from the well-known application
software from GE healthcare. The performance of the scheme is evaluated by using the DICOM files
taken from the widely used standard PET phantom scan. The results show that the SUV calculation
scheme for PET DICOM file using MATLAB is comparable with the SUV taken from the GE
healthcare application software. The strength of this scheme is that the interchangeability of the
DICOM files can be done conveniently without the special application software from any vendors.
Key-Words: - Positron Emission Tomography combined Computed tomography (PET/CT),
Standardized Uptake Value (SUV), The Digital Imaging and Communications in Medicine
(DICOM)
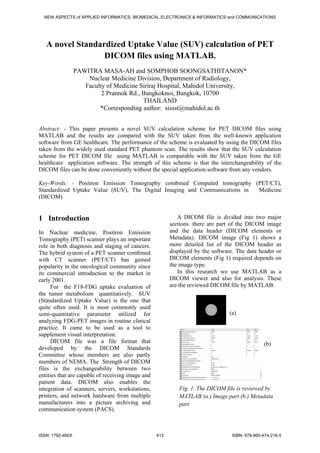
1 Introduction A DICOM file is divided into two major
sections. there are part of the DICOM image
In Nuclear medicine, Positron Emission and the data header (DICOM elements or
Tomography (PET) scanner plays an important Metadata). DICOM image (Fig 1) shows a
role in both diagnosis and staging of cancers. more detailed list of the DICOM header as
The hybrid system of a PET scanner combined displayed by the software. The data header or
with CT scanner (PET/CT) has gained DICOM elements (Fig 1) required depends on
popularity in the oncological community since the image type.
its commercial introduction to the market in In this research we use MATLAB as a
early 2001. DICOM viewer and also for analysis. These
For the F18-FDG uptake evaluation of are the reviewed DICOM file by MATLAB.
the tumor metabolism quantitatively. SUV
(Standardized Uptake Value) is the one that
quite often used. It is most commonly used
semi-quantitative parameter utilized for (a)
analyzing FDG-PET images in routine clinical
practice. It came to be used as a tool to
supplement visual interpretation.
DICOM file was a file format that (b)
developed by the DICOM Standards
Committee whose members are also partly
members of NEMA. The Strength of DICOM
files is the exchangeability between two
entities that are capable of receiving image and
patient data. DICOM also enables the
integration of scanners, servers, workstations, Fig. 1. The DICOM file is reviewed by
printers, and network hardware from multiple MATLAB (a.) Image part (b.) Metadata
manufacturers into a picture archiving and part
communication system (PACS).
ISSN: 1792-460X 413 ISBN: 978-960-474-216-5
2. NEW ASPECTS of APPLIED INFORMATICS, BIOMEDICAL ELECTRONICS & INFORMATICS and COMMUNICATIONS
2 Study Framework varies for every image slice. So the tissue
This is a block diagram in our study that show activity is calculated using formula 1.
the process, After a set of DICOM files
throughout our created scheme, the scheme (1)
yielded the SUVmaximum and SUVmean
Where m is rescale Slope (which is different
in each image slice), SV is the stored value
(Pixel intensity Value), b is rescale intercept
(for PET scan is always Zero) and U is units of
value after conversion (for our study is Bq/ml,
Shown in Unit tag)
The conversion formula above is the
fundamental defined by NEMA, however the
Fig. 2. The Study Framework formula maybe slightly different for each
vendor, In this study we used GE DICOM file.
So the method of calculation is based on GE
3 Calculation of Standardized conformance statement [8]
Uptake Value (SUV). SUVbody weight (kg / ml ) =
Activity Concentration in ROI ( Bq / ml ) (2)
SUV (Standardized Uptake Value) is the one ⎛ Injected Dose( Bq ) ⎞
⎜ ⎟
that quite often used. It is most commonly ⎜ body weight ⎟
⎝ ( kg ) ⎠
used semi-quantitative parameter utilized for
analyzing FDG-PET images in routine clinical
practice. It came to be used as a tool to ⎛
⎜
Pixel Value ⎞
⎜ Im age Scale Factor ⎟ ⎟
supplement visual interpretation. The SUV is ⎝ ⎠
SUV body weight ( kg / ml ) =
⎛ actual activity ⎞
(3)
also used to distinguish between malignant and ⎜
⎜ body weight ⎟ (
⎟ × dose calibratio n factor × 10 6 )
⎝ ⎠
benign tumor. The cut-off value for malignant
lesion is 2.5 and It have largely been proven to
be an oversimplification. Where Pixel Value is Pixel Intensity Value in
In this study, the DICOM files are the Region of Interest (ROI),
main source to analyze and calculate SUV.
The Component of the DICOM file can be
divided into 2 main parts which are the image , Actual activity is Injected activity at the time
and metadata. The image is the part that of scan, Body Weight is Patient Body Weight
displays the information by image and the (kg) and Dose Calibration factor must be
metadata is the part that keep the detail of the multiplied by 10-6 for MBq/ml to Bq/ml
data such as dose of injection, type of scan, conversion.
patient weight, patient name, etc.
We calculate the Standardized Uptake For SUV is practically in the defined
Value (SUV) and the brief meaning of SUV is Volume Of Interest (VOI). We used
the Differential Uptake Value, Dose Uptake MATLAB as a tool in the process. The SUV
Ratio, or Dose Absorption Ratio, For this formula(2) have shown the requirement of data
study we used PET DICOM file that has been which are from image part including metadata
through the attenuation correction. part. Here we used MATLAB to extract these
The Uptake Value is represented by Pixel data.
intensity value in the image and the GE
DICOM file. It collects the data in 16 bit so The steps of the SUV calculation scheme are
that the pixel intensity value is between 0- summarized as follow :
32767.
Therefore, the first process of the SUV Step 1: Extract Pixel Intensity Value in
calculation is the conversion of the pixel Defined ROI (region of interest).
intensity value to the activity concentration. The purpose of extraction is to note
The related attributed tag* for the conversion the obtained pixel intensity value for
is Rescale Slope tag, and Rescale Intercept tag the next step of calculation, So we
(there are from metadata part). These tags extract Mean and Maximum pixel
ISSN: 1792-460X 414 ISBN: 978-960-474-216-5
3. NEW ASPECTS of APPLIED INFORMATICS, BIOMEDICAL ELECTRONICS & INFORMATICS and COMMUNICATIONS
intensity because we need them to Fig. 2. Integral ROIs to VOI
calculate the SUVmean and SUVmax
Step 2: Convert Intensity Pixel Value to
activity concentration (Bq).
After we extracted the desired value,
the conversion of Intensity Pixel
Value to Activity Concentration (Bq)
is the next step. The data in this
conversion based on some of the detail
part (metadata). See formula (2) then
become
Where
The related tag in this part are Rescale
Slope, Rescale Intercept and Units.
Only Rescale slope is individual in
each slice.
Step 3: Calculate SUV in each slice.
Calculate SUV by formula (3) which
the related tag in this part are Total
Dose (0018,1074), Series Date
(0008,0021), Series Time
(0008,0031), Radiophamaceutical
Start Time (0018,1072),
Radiophamaceutical Half Life
(0018,1075) and Patient Weight
(0010,1010)
Step 4: Integral SUV of ROI to VOI
In practical , SUV calculation is
analyze in the Volume of Interest
(VOI). So In this study we calculated
SUV in each slice, summarized them Fig. 3. The SUV calculation Scheme
which is depending on number of
slices and projected the region of
interest into every slices in the 3 Scheme Testing.
volume. Mean that every slices under This SUV calculation Scheme is operated on
the volume has the same size and the PC with installing MATLAB. In order to
position. evaluate the performance of the scheme, it is
compared to the SUV that obtained from the
Well-known application software from GE
healthcare (Xeleris workstation)
Xeleris and MATLAB all allow
interpretation of ROI analysis. Three circular
ROIs were drawn surrounding the region of
FDG uptake. see the demonstration in the fig.
4.
ISSN: 1792-460X 415 ISBN: 978-960-474-216-5
4. NEW ASPECTS of APPLIED INFORMATICS, BIOMEDICAL ELECTRONICS & INFORMATICS and COMMUNICATIONS
[2] Gustavo S.P. Meirelles, Peter kijewski,
Timothy, “Correlation of PET/CT
standardized Uptake Value measurements
between Dedicated workstations and
PACS-integrated workstation system”
Journal of Digital Imaging, Vol 20,
NO.3(September)2007, p.307-313
[3] S.Chicklore, P.Jaye, S.Vijayanatham,
Fig. 4. Example of the 3 sizes ROI drawn D.Gallacher, “Comparing diagnostic
on Phantom transaxial images accuracy of digital images viewed on a
Picture Archiving and Communication
The maximum SUV was recorded and mean System(PACS) diagnostic workstation and
SUVs of the malignant lesion were calculated on a Personal Computer(PC)-Based
and recorded by the Xeleris® workstation and imaging system” St Thomas’ Hospital,
MATLAB. And the Xeleris and MATLAB London, UK
were analyzed together for further studying the [4] ACR-NEMA, “Digital Imaging and
correlation of both system. Communication in Medicine (DICOM)
Data were analyzed using SPSS software. Positron emission tomography image
Correlation of the SUV measurement between objects Supplement 12 ”
the dedicated Xeleris workstations and [5] Aparna Kanakatte, Jayavardhana Gubbi,
MATLAB was measured with Pearson Nallasamy Mani, Tomas Kron, David
correlation coefficient. The comparison was Binns, “A Pilot Study of Automatic Lung
perform with 3 sized-ROI in 45 phantom slice. Tumor Segmentation from Position
Emission Tomography Images using
Standard Uptake Values”, Proceedings of
4 Results the 2007 IEEE symposium on
The result shown that the Correlation between Computational Intelligence in Image and
Xeleris Workstation and MATLAB was very Signal Processing (CIISP 2007), p 363-
good for the SUVmaximum and SUVmean. This is 368
reassuring, Because it mean that the proposed [6] M.Teras, T.Tovanen, J.J.Johnasson,
of the SUV calculation scheme can interpret J.J.Williams, J.Knunti, “Performance of
PET/CT images even though the worker is not the new generation of whole-body PET/CT
on the workstation site. scanners: Discovery STE and Discovery
VCT”, Eur journal Nuclear Molecular
Imaging (2007)34, p.1683-1692
5 Conclusion [7] Mark. T Madsen, “Selecting New PET/CT
These Result indicate that the SUVs from System”, Technology talk, 2004 American
MATLAB analysis could be used interchange College of Ragiology, p.356-358
with PET/CT Xeleris® workstation for [8] GE Medical System, “Technical
interpretation of PET/CT image without losing Publication Advance TM 5.1 Conformance
the capacity to accurately measure the SUV. Statement for DICOM V3.0”, GE
Healthcare, p. 3_17 – 3_21
References: [9] http://qibawiki.rsna.org/
[1] Joseph A. Thie, PhD, “Understanding the [10] GE Medical System, “DiscoverySTE
Standardized Uptake Value, Its Methods, Quick Manual” , GE Healthcare MISM
And Implication for Usage” The journal of Tip application, p. 28-38
Nuclear Medicine, Vo. 45, No.9 p. 1431-
1434
ISSN: 1792-460X 416 ISBN: 978-960-474-216-5

![NEW ASPECTS of APPLIED INFORMATICS, BIOMEDICAL ELECTRONICS & INFORMATICS and COMMUNICATIONS
2 Study Framework varies for every image slice. So the tissue
This is a block diagram in our study that show activity is calculated using formula 1.
the process, After a set of DICOM files
throughout our created scheme, the scheme (1)
yielded the SUVmaximum and SUVmean
Where m is rescale Slope (which is different
in each image slice), SV is the stored value
(Pixel intensity Value), b is rescale intercept
(for PET scan is always Zero) and U is units of
value after conversion (for our study is Bq/ml,
Shown in Unit tag)
The conversion formula above is the
fundamental defined by NEMA, however the
Fig. 2. The Study Framework formula maybe slightly different for each
vendor, In this study we used GE DICOM file.
So the method of calculation is based on GE
3 Calculation of Standardized conformance statement [8]
Uptake Value (SUV). SUVbody weight (kg / ml ) =
Activity Concentration in ROI ( Bq / ml ) (2)
SUV (Standardized Uptake Value) is the one ⎛ Injected Dose( Bq ) ⎞
⎜ ⎟
that quite often used. It is most commonly ⎜ body weight ⎟
⎝ ( kg ) ⎠
used semi-quantitative parameter utilized for
analyzing FDG-PET images in routine clinical
practice. It came to be used as a tool to ⎛
⎜
Pixel Value ⎞
⎜ Im age Scale Factor ⎟ ⎟
supplement visual interpretation. The SUV is ⎝ ⎠
SUV body weight ( kg / ml ) =
⎛ actual activity ⎞
(3)
also used to distinguish between malignant and ⎜
⎜ body weight ⎟ (
⎟ × dose calibratio n factor × 10 6 )
⎝ ⎠
benign tumor. The cut-off value for malignant
lesion is 2.5 and It have largely been proven to
be an oversimplification. Where Pixel Value is Pixel Intensity Value in
In this study, the DICOM files are the Region of Interest (ROI),
main source to analyze and calculate SUV.
The Component of the DICOM file can be
divided into 2 main parts which are the image , Actual activity is Injected activity at the time
and metadata. The image is the part that of scan, Body Weight is Patient Body Weight
displays the information by image and the (kg) and Dose Calibration factor must be
metadata is the part that keep the detail of the multiplied by 10-6 for MBq/ml to Bq/ml
data such as dose of injection, type of scan, conversion.
patient weight, patient name, etc.
We calculate the Standardized Uptake For SUV is practically in the defined
Value (SUV) and the brief meaning of SUV is Volume Of Interest (VOI). We used
the Differential Uptake Value, Dose Uptake MATLAB as a tool in the process. The SUV
Ratio, or Dose Absorption Ratio, For this formula(2) have shown the requirement of data
study we used PET DICOM file that has been which are from image part including metadata
through the attenuation correction. part. Here we used MATLAB to extract these
The Uptake Value is represented by Pixel data.
intensity value in the image and the GE
DICOM file. It collects the data in 16 bit so The steps of the SUV calculation scheme are
that the pixel intensity value is between 0- summarized as follow :
32767.
Therefore, the first process of the SUV Step 1: Extract Pixel Intensity Value in
calculation is the conversion of the pixel Defined ROI (region of interest).
intensity value to the activity concentration. The purpose of extraction is to note
The related attributed tag* for the conversion the obtained pixel intensity value for
is Rescale Slope tag, and Rescale Intercept tag the next step of calculation, So we
(there are from metadata part). These tags extract Mean and Maximum pixel
ISSN: 1792-460X 414 ISBN: 978-960-474-216-5](data:image/gif;base64,R0lGODlhAQABAIAAAAAAAP///yH5BAEAAAAALAAAAAABAAEAAAIBRAA7)