2. International Journal of Management Research and Development (IJMRD) ISSN 2248-938X (Print),
ISSN 2248-9398 (Online) Volume 4, Number 1, January-March (2014)
69
freedom to revise the syllabus with time and follow a schedule which is more suitable for the set
curriculum. Exams are conducted by the Deemed University (Wikipedia).
As of 2005, India has 1346 degree-level engineering institutions. Out of these 1346 approved
engineering colleges, 1116 fall under the self-financing category (http//www.aicte.ernet.in). The
steep increase in the growth of technical colleges in India in the last two decades has led to several
problems with regard to quality of technical education. In order to ensure the quality of technical
education, All India Council for Technical Education (AICTE) has established National Board of
Accreditation (NBA).
1. LITERATURE REVIEW
What do you mean by quality? There is no simple answer to this question, since ‘quality’ like
‘beauty’ is subjective – a matter of personal judgment. Naomi Pfeffer and Anna Coote have even
described it as ‘a slippery concept’ (1991). It is slippery because it has such a variety of meanings
that the word implies different meanings and different things to different people. The word ‘quality’
in the context of engineering education has been used in two different ways. One is as per what the
Webster’s Dictionary defines, namely, grade of excellence, and the other is as per the generic
definition given by Crosby (1984), namely, conformance to requirements, not as goodness. Other
definitions, which are predominantly the variations of the second one, represent adjustments to suit
the area of concern. Some of these are fitness for purpose (Juran, 1988), effectiveness in achieving
institutional goals, and meeting customers’ stated or implied needs.
Eriksen (1995) argued that the primary input is the student (before exposure to a value-added
service) who is subjected to a transformation (the application of a value-added service), which, in
turn, produces an output (the student after exposure to a value-added service). An engineering
institution is a complex system that adds value to students (inputs) who are admitted into the first
year through a series of interrelated processes using its resources (financial, physical and human) to
generate desired outcomes (appropriately trained students)in a given context (regulations related to
approval of programmes, admission procedures, examinations, placement opportunities, and
economic scenario). Some variables are endogenous to the system of concern (engineering college),
and some variables are exogenous (consequences of the context in which the college is operating and
on which the college has no direct influence). The number of variables involved is very large, the
causal relationships among the variables cannot be easily traced nor quantitatively measured, and
many variables do not render themselves to easy measurement. As a result several frameworks have
been proposed for measuring the quality of engineering education. These frameworks differ from
one another in terms of the variables they focus on, and the details they address. One of the
frameworks has been developed by NBA and is used mainly for assessing the quality of an
engineering programme which is a part of the accreditation process.
Some methods have been suggested by Joglekaret al., (1999) to quantitatively assess the
quality of education in technical institutions, which will help to enhance the accountability of
performance evaluation system with the help of input output factors and performance indicators. Rao
(2000) presents a logical approach to rank the technical institutions using graph theory and matrix
approach. Rao and Singh (2002) present a logical procedure to rank the technical institutions using
AHP. Institution performance index is proposed, which evaluates and ranks technical institutions for
a given period of time. Suganthiet al., 1998 proposed a ‘Failure Mode and Effect Analysis’, which
has been used extensively in industries as a proactive tool for education sector. They claimed that
this method could prevent many of the failures in the educational process and improve the standard
of education. Reddy et al., (2004) have illustrated the use of Analytic Hierarchy method for
Performance evaluation of technical institutions. All these proposals are at conceptual level without
any proven applicability.
3. International Journal of Management Research and Development (IJMRD) ISSN 2248-938X (Print),
ISSN 2248-9398 (Online) Volume 4, Number 1, January-March (2014)
70
Accreditation of an engineering educational programme is the primary process used to ensure
the suitability of that programme as the entry route to the engineering profession (Collofello, 2004).
In India, accreditation of the engineering programmes by NBA is mandatory for the engineering
colleges which are approved by AICTE (http://www.nba-aicte.ernet.in/). NBA has formulated the
standards, by which individual programmes in any engineering college can be judged. These are
classified into criteria and variables that measure the quality of different aspects of the programme.
The number of variables chosen to measure the quality was initially 70 (under eight criteria under
three indices (effective from 1-1-2003)), and subsequently the number was reduced to 57 through
redefinition of variables.
1.1Outcome from the studies carried out in India:
Viswanadhan and Rao (2005) have stated that there are some discrepancies in the NBA
assessment processes.When the assessment process involves such a large number of variables (70),
development and usage of a well-structured questionnaire for data collection become impractical.
This reduces the reliability of the process, and hence to be avoided. On the other hand, if we use a
smaller number of variables, it may lead to loss of information and may not be sufficient to explain
the variability of the process. Viswanadhan(2006) proposed a Process – Resources – Outcome –
Management (PROM) Model for the assessment of quality of engineering programmes. The model is
developed through the analysis of accreditation mechanisms of various countries and that of the
National Board of Accreditation (NBA), India. The newly developed framework simplifies the
assessment process. It reduces the number of variables from 70 (of NBA) to 19 factors. The
performances of 160 undergraduate engineering programmes (80 Government – aided engineering
programmes (38-Autonomous, 25-Government, 17-Aided colleges) and 80 Self- financing
engineering programmes (80 Self-financing colleges)) from 13 states of India were analyzed by
Viswanadhanet al., (2005) in terms of the 19 factors coming under the PROM model using NBA
data.
Sahneyet al., (2004) identified the gap between student expectations and perceptions of the
actual service received in selected engineering colleges and management institutions using
SERVQUAL. They also identified the set of minimum quality components that met the requirements
of students using quality function deployment (QFD).
Sakthivelet al., (2005) developed a 5-C Total Quality Management (TQM) model of
academic excellence by establishing the relation between the TQM constructs and students’
satisfaction of academic performance. The 5-C’s were commitment of top management, course
delivery, campus facilities, courtesy and customer feedback and improvement. The sample of
students was taken from ISO and non-ISO engineering institutions from South India. Sakthivel
(2007) measured the overall engineering educational excellence in the Engineering Educational
Institutions (EEI) by considering the students’ perceptions of the level of Commitment of Top
Management and Leadership (CTML) and Education Service Design and Delivery (ESDD). The
variables employed were top management commitment, customer focus, campus facilities, course
delivery, communication, continuous assessment and improvement and congenial learning
environment. The sample of students considered for the study was taken from Government Run
Engineering Colleges (GREC), Privately Funded Engineering Colleges (PFEC) and Privately Funded
Deemed Universities (PFDU) located in South India.
Sayedaet al., (2010) explored the adoption of quality management practices in engineering
educational institutions (EEIs) in India from management’s perspective. They had analyzed the
relationship between TQM dimensions and institutional performance. Institutional performance
(effectiveness) has been measured by five measures of performance, institution reputation and image,
infrastructure quality, faculty excellence, research and industry exposure and stakeholders’
satisfaction.
4. International Journal of Management Research and Development (IJMRD) ISSN 2248-938X (Print),
ISSN 2248-9398 (Online) Volume 4, Number 1, January-March (2014)
71
Shivakumaret al., (2012) investigated the dimensions of TQM, analysed interrelationships
and their combined influence on results achieved in ISO certified engineering institutes located in
three southern states in India namely, Andhra Pradesh, Karnataka and Maharashtra. Their
questionnaire was based on self-assessment philosophy of European Foundation for Quality
Management Excellence Model (EFQM).
Chaudhuriet al., (2011) assessed the baseline or current performance of the engineering
colleges in the West Bengal. The total number of colleges considered for their study was 30 out of
70. They were government and private engineering colleges. Eight enablers (input
variables/constructs/dimensions/factors) considered for their study were Infrastructure, Faculties,
Supporting Staff, Administrators, Curricula/Courses, Placement, Innovation/Research activities and
Students. Stakeholders’/Customer satisfaction was considered as an output variable and it was
defined with the help of three constructs – Guardians’ satisfaction, Employers’ satisfaction and
satisfaction of the society at large.
2. RESEARCH GAP
A good number of studies on quality of education have been taken up by the authors in Indian
engineering colleges. They have provided an in depth analysis of the respective problems. None of
them has addressed the characteristics that differentiate self-financing engineering colleges without
autonomous status and those with autonomous status. The number of self-financing engineering
colleges with autonomous status has increased in India recently (http//www.aicte.ernet.in). The
number of such colleges has increased from 1 in the year 2000 to 17 in the year 2013 in Karnataka
state (http://en.wikipedia.org). The increased number indicates indirectly that the preference for
pursuing engineering education from autonomous colleges by the students has increased.
This leads to a number of research questions: how do various stakeholders (faculty members,
students, student parents, management etc.) perceive the input and outcome dimensions in
autonomous as well as non-autonomous engineering colleges? Is there any difference in the level
how faculty members from both the categories of colleges perceive the quality dimensions provided
by their colleges? Is such a difference significant? How many such dimensions differentiate those
two categories of colleges significantly?
To answer these questions, there is a need for a study, which should spell out the critical
dimensions that differentiate the performance of autonomous engineering colleges from non-
autonomous engineering colleges under self-financing category.
3. OBJECTIVES OF THE STUDY
1. To study the performance of self-financing engineering colleges using faculty perceptions.
2. To test the difference in faculty perceptions between self-financing engineering colleges (i)
without autonomous status and (ii) with autonomous status.
3. To arrive at the significant characteristics that differentiates self-financing engineering
colleges (i) without autonomous status and (ii) with autonomous status.
4. To study the association between the input dimensions and each of the outcome dimensions
selected for study in both the categories of colleges.
4. CONCEPTUALIZATION OF VARIABLES
This study has taken the cue from Viswanadhan et al., (2005) to assess the performance of
self-financing engineering colleges from the faculty members’ perspective. The following is the
conceptualization of quality dimensions through vigorous literature survey.
5. International Journal of Management Research and Development (IJMRD) ISSN 2248-938X (Print),
ISSN 2248-9398 (Online) Volume 4, Number 1, January-March (2014)
72
The terms “factors”, “dimensions”, “critical dimensions” and “constructs” have been used
synonymously in this paper.
As per the advice of Tata et al., (1999) to use pre-tested constructs that will ensure validity
and reliability, this study selected 19 factors as well as the items which were conceptualized by
Viswanadhan (2006) in the PROM model for assessing the performance of self-financing
engineering colleges. As per the PROM model, the factor number 14 is Programme Outcome.
Student Performance (SP) in university examinations, competitive examinations, and company
placement interviews alone is declared as the Programme Outcome. Experts have suggested many
more things as Educational Outcomes. For example, Dr. Radhakrishnan Commission (1947) and
Education Commission (1966) [5] have classified the goals of higher education in India into two
categories viz ‘Academic Excellence’ and ‘Social Responsibility’.
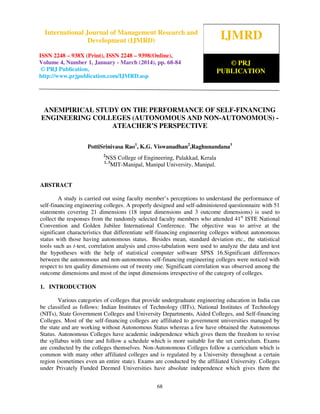
Hence, with respect to engineering education, the ‘Academic Excellence’ can be named more
specifically as ‘Engineering Competence’. In addition to the two goals of ‘Engineering Competence’
and ‘Social Responsibility’, a programme should fulfil the expectations of both the internal and the
external customers. This goal, in the context of an education programme, can be named as
‘Stakeholder Satisfaction’. Importance of this goal (Stakeholder satisfaction) is emphasized in the
criteria of the well-established quality framework, European Foundation for Quality Management
(EFQM), in terms of the two quality characteristics ‘Customer Satisfaction’ and ‘People Satisfaction’
(Figure 1). When we apply EFQM model to an engineering programme, the goals of the programme
are related to the ‘results’ and the factors (NBA criteria for accreditation) are related to the ‘enablers’
of the EFQM. Totally, three types of Educational Outcomes have been considered in our study. They
are: Stakeholder Satisfaction (factor no. 14), Social Responsibility (factor no. 15), and Programme
Performance (factor no. 16). The total number of factors considered finally in our study is 21.
Leadership
10 %
Policy and
strategy
8 %
People
management
9 %
Resources
9 %
Processes
14 %
People
satisfaction
9 %
Impact on society
6 %
Business
results
15 %
Customer
satisfaction
20 %
ENABLERSRESULTS
Figure 1: European Foundation for Quality Management Excellence Model
It is assumed that these 21 factors (dimensions) are sufficient to assess the performance of
self-financing engineering colleges. A sum of 51 variables extracted from the literature is considered
6. International Journal of Management Research and Development (IJMRD) ISSN 2248-938X (Print),
ISSN 2248-9398 (Online) Volume 4, Number 1, January-March (2014)
73
under these 21 factors. Details regarding the 21 dimensions and the variables falling under each
dimension are furnished in the table 1.
Table 1: Details of 21 dimensions and the corresponding variables
Dimension
Number
Code Name of the Dimension Items considered under the dimension
1 IEF Instruction, Evaluation and Feedback
Student performance evaluation, Feedback
about processes, Course objectives,
Curriculum
2 AC Academic Calendar
Academic calendar provision, Planning
(curricular, co-curricular and
extracurricular) activities
3 SYP Supplementary Processes
Support for co-curricular and
extracurricular activities
4 II Institute Initiatives
Initiatives for industrial visits, summer
projects
5 IYI Industry Initiatives
Including industry in decision making
process
6 R&D R&D Activities
Motivation for research, Developing
creativity and innovation
7 FR Financial Resources
Sufficiency of Budgets, Level of utilization
of funds
8 SPR Supplementary Physical Resources
Additional resources on campus-physical
amenities, facilities
9 MPR Main Physical Resources Basic infrastructure, Laboratory equipment
10 FA Faculty Adequacy
Availability of training programs, -Student
– faculty ratio, Availability of experienced
faculty, Guidance
11 SSA Supporting Staff Adequacy Quantity and quality of supporting staff
12 SI Student Intake
Merit of the students, Selection of the
course
13 LF Learning Facilities
Facilities in the library, Teaching aids,
Academic ambience
14 SS Stakeholder Satisfaction
Recognition and rewards on the job, Sense
of achievement, Evaluation processes
awareness, Sensible policies and procedures
15 SR Social Responsibility
Accountability for fees, Promotion of ethics
and moral values
16 PP Programme Performance
Achieving vision and mission, Commitment
to continuous improvement, Campus
recruitments, Performance in competitive
exams, Academic results
17 PM Participatory Management
Feedback from stakeholders, Solving
academic issues
18 LE Leadership Efficiency
Infusing values in stakeholders,
Communicating expectations, Boosting
employee morale
19 CAG Commitment to achieve goals
Ensuring people’s participation, Instilling
passion to learn, Mechanism to check
satisfaction
20 PLM Planning and Monitoring
Monitoring performance and providing
help, Gathering expectations about students,
Synthesizing diverse interests of
stakeholders
21 PAD Performance Appraisal & Development
Appraising and appreciating performance,
Training to overcome inefficiencies
7. International Journal of Management Research and Development (IJMRD) ISSN 2248-938X (Print),
ISSN 2248-9398 (Online) Volume 4, Number 1, January-March (2014)
74
5. CONCEPTUAL MODEL
Some studies concentrate on the institutional inputs and outputs (Cave et al., 1988; Johnes
and Taylor, 1990) while defining the performance of an institution. Sahneyet al., (2004) mentioned
that the education is a transformation process. According to Sahneyet al., inputs include factors
relating to the students, teachers, administration staff, physical facilities and infrastructure. The
processes include activities of teaching, learning, administration. The outputs include examination
results, employment, earnings and satisfaction. The model used in our study is shown below in
Figure 2 which shows the list of independent variables (inputs), dependent variables (outputs) and
their help in assessing the performance of a programme as well as the college.
Figure 2: The proposed model to assess the performance of a programme as well as the performance
of an engineering college
6. HYPOTHESES
Hypotheses are formulated in an attempt to analyze the performance of various self-financing
engineering colleges in India.
Main Hypothesis:
“Performance of self-financing engineering colleges is same irrespective of the category of the
college”.
Sub Hypotheses:
Sub hypotheses for the detailed comparison of performance of self-financing engineering
colleges with respect to different factors are listed below.
1. Instruction, Evaluation & Feedback (IEF) processes are of the same standard in both the
categories of engineering colleges.
2. The implementation of Academic Calendar (AC) in both the categories of engineering colleges
is identical.
3. Equal amount of Supplementary Processes (SP) is there in both the categories of engineering
colleges.
8. International Journal of Management Research and Development (IJMRD) ISSN 2248-938X (Print),
ISSN 2248-9398 (Online) Volume 4, Number 1, January-March (2014)
75
4. There is no difference in the Institute Initiatives (II) for industry interaction in both the
categories of engineering colleges.
5. Industry Initiatives (IyI) for interaction with both categories of colleges are the same.
6. R&D activities (R&D) are at the same level in both categories of engineering colleges.
7. Financial resources (FR) of engineering colleges are at the same level in both categories of
engineering colleges.
8. Supplementary physical resources (SPR) of engineering colleges are at the same level in both
categories of engineering colleges.
9. Main physical resources (MPR) of engineering colleges are at the same level in both categories
of engineering colleges.
10. Faculty adequacy (FA) is at the same level in both categories of engineering colleges.
11. Adequacy of supporting staff (SSA) is the same in both the categories of engineering colleges.
12. There are no differences in the student intake (SI) in the both categories of engineering
colleges.
13. Learning Facilities (LF) are same in both categories of engineering colleges.
14. Stakeholder Satisfaction (SS) is at the same level in both categories of engineering colleges.
15. Social Responsibility (SR) borne by both the categories of engineering colleges is at same level.
16. Programme Performance (PP) is at the same level in both categories of engineering colleges.
17. Equal amount of Participatory Management (PM) exists in both the categories of engineering
colleges.
18. There is no difference in Leadership Efficiency (LE) between the two categories of engineering
colleges.
19. Management commitment to achieve goals (CA) is same in both categories of engineering
colleges.
20. Planning and monitoring (Pln) are at the same level in both categories of engineering colleges.
21. There is no difference in the Performance Appraisal and Development (PAD) system in both
the categories of engineering colleges.
7. METHODOLOGY
7.1 Data collection/respondent profile
The present study is restricted to the self-financing engineering colleges that have deputed
their faculty members for the 41st
ISTE National Annual Convention held at BBSB Engineering
College, Fategarh Sahib, Punjab, from 2nd
to 4th
December, 2011 and Golden Jubilee International
Conference on Recent Advances & Challenges in Energy 2012 – RACE 2012 held at Manipal
Institute of Technology, Manipal, Karnataka during January 2012.While selecting these two
conference venues, non-probabilistic convenience and judgmental sampling technique were used.
However, within each conference, the respondents were selected by stratified random sampling.
Further details regarding the participants and thestates they represented are given below:
9. International Journal of Management Research and Development (IJMRD) ISSN 2248-938X (Print),
ISSN 2248-9398 (Online) Volume 4, Number 1, January-March (2014)
76
Sampling
Unit :
Thirty one self-financing engineering colleges across nine states in India.
Category 1 – Self-financing colleges without autonomous status (coded as non-
autonomous).
Category 2 – Self-financing colleges with autonomous status (coded as
autonomous).
Size of
Sample:
Faculty Members: 83; N1 = 43, N2 = 40. The distribution of 83 faculty members
from 34 colleges across 9 states of India is given in table below.
Category Sample
Size
Geographic
Distribution
Number of Faculty
Respondents
1
(Self -financing
colleges without
autonomous status)
43
Andhra Pradesh 2
Gujarat 2
Karnataka 1
Maharashtra 12
Odisha 1
Punjab 16
Sikkim 1
Tamil Nadu 7
West Bengal 1
2
(Self-financing
colleges with
autonomous status)
40
Karnataka 29
Tamil Nadu 11
A properly designed and self-administered questionnaire (not included in this paper as the
doctoral work of first author is in progress) with 51 questions (51 statements) coded as St1,
St2......St51 in the data set) is used to collect the responses from the randomly selected faculty
members who attended the above said convention or/and conference. Likert-type 5 point scale
(Kothari, 2005) is used to convert (ranging from 1strongly disagree to 5strongly agree) qualitative
nature of the data into quantitative and was processed using statistical computer software IBM SPSS
Statistics 20. Besides mean, standard deviation etc., the statistical tools such as t-test, cross-
tabulation, and correlation analysis are used to test the hypotheses and analyze the data.
Score for each dimension is calculated as follows:
Questions numbered 1, 4, 42, and 50 have fallen under the dimension 1 (refer table 1).
Assume that the rating for these four questions by a respondent is as follows: 4, 1, 4, and 2. Then the
score of that dimension is calculated by finding the mean of 4, 1, 4, and 2; and by rounding-off.
7.2Hypothesis Testing
In this preliminary study, the ‘type of self-financing engineering college’ is considered to be
independent variable and the perception of faculty members (with respect to 51 statements) is
considered to be dependent variable. The independent variable has two categories namely, Self-
financing engineering colleges without autonomous status (coded as non-autonomous) and Self-
financing engineering colleges with autonomous status (coded as autonomous). The independent
variable is qualitative in nature and the dependent variable is quantitative in nature.
The Descriptive Statistics and Independent-Samples t test results for all the 21dimensions are
given in standard format (table 2). The null hypothesis is rejected at 5% significance level when the
corresponding two-tailed p-value is less than 0.05 but higher than 0.01 [7].Table 3shows that non-
autonomous college faculty members were significantly different from autonomous college faculty
members on dimensions 1, 2, 5, 8, 13, 14, 16, 18, 19 and 21 (p<.05). Inspections of the two group
10. International Journal of Management Research and Development (IJMRD) ISSN 2248-938X (Print),
ISSN 2248-9398 (Online) Volume 4, Number 1, January-March (2014)
77
means of these dimensions indicate that the mean perception (level of agreement on these
dimensions) of non-autonomous college faculty members is significantly lower than autonomous
college faculty members. The sub-hypotheses 1, 2,5,8,13,14,16,18,19, and 21 are rejected at 5%
significance level and hence the null hypothesis of equal performance of the two categories of self-
financing engineering colleges is also rejected.
Table 3: Independent Samples T-test results for the perceptions of faculty members of non-
autonomous and autonomous engineering colleges (self-financing) on 21 dimensions.
Dimension No.,
Description
Category of
colleges
Sample
size
Mean
Score
Standard
Deviation
t-statistic df
P-
valueSig.
(2-tailed)
D1 (Instruction, Evaluation
and Feedback Processes)
1.Non Autonomous 43 3.7500 0.57477 -2.135 81 0.036*
2.Autonomous 40 4.0062 0.51418
D2 (Adherence to
Academic Calendar)
1.Non Autonomous 43 4.0349 0.63053 -2.893 81 0.005*
2.Autonomous 40 4.3875 0.45976
D3 (Supplementary
Processes)
1.Non Autonomous 43 3.7907 1.05916 -1.033 a
59.453 a
0.306
2.Autonomous 40 3.9750 0.47972
D4 (Institute Initiatives for
Industry Interactions)
1.Non Autonomous 43 4.0698 0.91014 -0.967 81 0.336
2.Autonomous 40 4.2500 0.77625
D5 (Industry Initiatives for
Industry-Institute
Interaction)
1.Non Autonomous 43 3.2558 1.13585 -2.784a
78.567a
0.007*
2.Autonomous 40 3.8750 0.88252
D6 (Research &
Development Activities)
1.Non Autonomous 43 3.8721 0.87351 -0.778a
75.280a
0.439
2.Autonomous 40 4.0000 0.60975
D7 (Availability &
Utilization of Financial
Resources)
1.Non Autonomous 43 3.4186 1.02313 -1.62a
76.121a
0.872
2.Autonomous 40 3.4500 0.73205
D8 (Adequacy of
Supplementary Physical
Resources)
1.Non Autonomous 43 4.0581 0.80334 -2.187 81 0.032*
2.Autonomous 40 4.4125 0.65913
D9 (Adequacy of Main
Physical Resources)
1.Non Autonomous 43 3.8837 0.92477 -0.686 81 0.495
2.Autonomous 40 4.0125 0.77201
D10 (Adequacy of
Qualified and Experienced
Faculty)
1.Non Autonomous 43 3.7733 0.58456 -1.894 81 0.062
2.Autonomous 40 3.9875 0.42724
D11 (Adequacy of
Supporting Staff )
1.Non Autonomous 43 3.5814 0.95699 -1.191 81 0.237
2.Autonomous 40 3.8250 0.90263
D12 (Quality of Incoming
Students/Students Intake)
1.Non Autonomous 43 2.9419 0.75758 -0.359 81 0.721
2.Autonomous 40 3.0000 0.71611
D13 (Learning Facilities)
1.Non Autonomous 43 3.9147 0.63867 -2.378a
79.439a
0.020*
2.Autonomous 40 4.2167 0.51502
11. International Journal of Management Research and Development (IJMRD) ISSN 2248-938X (Print),
ISSN 2248-9398 (Online) Volume 4, Number 1, January-March (2014)
78
D14 (Stakeholder
Satisfaction)
1.Non Autonomous 43 3.6977 0.59150 -2.333 81 0.0222*
2.Autonomous 40 4.0000 0.58835
D15 (Social Responsibility)
1.Non Autonomous 43 3.5233 0.67128 -0.541 81 0.590
2.Autonomous 40 3.6125 0.82809
D16 (Program
Performance)
1.Non Autonomous 43 3.6605 0.55641 -2.373 81 0.020*
2.Autonomous 40 3.9350 0.49279
D17 (Participatory
Management)
1.Non Autonomous 43 3.6744 0.80092 0.145 81 0.885
2.Autonomous 40 3.6500 0.72678
D18 (Leadership
Efficiency)
1.Non Autonomous 43 3.4651 0.68676 -2.515 81 0.014*
2.Autonomous 40 3.8000 0.50524
D19 (Management
Commitment to achieve
goals)
1.Non Autonomous 43 3.5349 0.67117 -2.597 81 0.011*
2.Autonomous 40 3.90000 0.60482
D20 (Planning and
Monitoring)
1.Non Autonomous 43 3.5271 0.63925 -2.096 81 0.39
2.Autonomous 40 3.8000 0.53801
D21 (Performance
Appraisal & Development)
1.Non Autonomous 43 3.5349 0.73513 -2.900 81 0.005*
2.Autonomous 40 3.9750 0.64001
a
Thet and df were adjusted because variances were not equal.
7.3 Correlation Analysis
Correlation is a measure of relationship between two variables. The correlation coefficient
gives a mathematical value for measuring the strength of the relationship between two variables. It
can take values from -1 to 1. Pearson’s correlation coefficient, p-value for two-tailed test of
significance is shown in tables 4 and 5. From table 4, the interpretations are (in case of non-
autonomous colleges):
The output dimension D14 (Stakeholder Satisfaction) is significantly correlated with all input
dimensions except D11 (Supporting Staff Adequacy).
The output dimension D15 (Social Responsibility) is significantly correlated with all input
dimensions except D4 (Institute Initiatives), D5 (Industry Initiatives) and D12 (Student Intake).
The output dimension D16 (Program Performance) is significantly correlated with all input
dimensions.
Table 4: Correlation between dependent and independent constructs for non-autonomous colleges
(Number of respondents=43)
D14(Stakeholder
Satisfaction)
D15(Social
Responsibility)
D16(Programme
Performance)
D1(Instruction, Evaluation and feedback) .600**
.462**
.640**
D2(Academic calendar) .572**
.518**
.510**
D3(Supplementary Processes) .524**
.408**
.434**
D4(Institute initiatives) .305*
0.27 .302*
D5(Industry Initiatives) .313*
0.226 .404**
12. International Journal of Management Research and Development (IJMRD) ISSN 2248-938X (Print),
ISSN 2248-9398 (Online) Volume 4, Number 1, January-March (2014)
79
D6(R&D Activities) .713**
.553**
.663**
D7(Financial Resources) .430**
.505**
.490**
D8(Supplementary Physical Resources) .357*
.582**
.535**
D9(Main Physical Resources) .386*
.359*
.324*
D10(Faculty Adequacy) .430**
.370*
.556**
D11(Supporting Staff Adequacy) 0.255 .367*
.514**
D12(Student Intake) .312*
0.143 .404**
D13(Learning Facilities) .623**
.680**
.743**
D17(Participatory Management) .497**
.313*
.494**
D18(Leadership Efficiency) .447**
.569**
.602**
D19(Commitment to achieve goals) .487**
.526**
.672**
D20(Planning and Monitoring) .636**
.682**
.743**
D21(Performance Appraisal
&Development)
.716**
.336*
.623**
Table 5: Correlation between dependent and independent constructs for autonomous colleges
(Number of respondents=40)
D14(Stakeholder
Satisfaction)
D15(Social
Responsibility)
D16(Programme
Performance)
D1(Instruction, Evaluation and
feedback)
.318*
0.043 .427**
D2(Academic calendar) .320*
-0.134 0.239
D3(Supplementary Processes) .386*
-0.154 .362*
D4(Institute initiatives) 0.225 -0.025 .459**
D5(Industry Initiatives) 0.21 -0.015 .441**
D6(R&D Activities) .465**
0.013 .563**
D7(Financial Resources) 0.253 -0.139 .382*
D8(Supplementary Physical
Resources)
0.198 0.018 .495**
D9(Main Physical Resources) 0.064 -0.042 0.157
D10(Faculty Adequacy) .465**
-0.014 .313*
D11(Supporting Staff Adequacy) .483**
-0.076 .746**
D12(Student Intake) 0.281 -0.249 0
D13(Learning Facilities) .480**
0.132 .683**
D17(Participatory Management) .420**
0.11 .379*
D18(Leadership Efficiency) .561**
0.188 .551**
D19(Commitment to achieving
goals)
.540**
0.168 .465**
D20(Planning and Monitoring) .425**
0.205 .588**
D21(Performance Appraisal &
Development)
.528**
0.018 .352*
From table 5, the interpretations are (in case of autonomous colleges):
Output dimension D14 (Stakeholder Satisfaction) is significantly correlated with all input
dimensions except D4 (Institute Initiatives), D5 (Industry Initiatives), D7 (Financial Resources), D8
(Supplementary Physical Resources), D9 (Main Physical Resources) and D12 (Student Intake).
Output dimension D15 (Social Responsibility) is not correlated with all input dimensions.
13. International Journal of Management Research and Development (IJMRD) ISSN 2248-938X (Print),
ISSN 2248-9398 (Online) Volume 4, Number 1, January-March (2014)
80
Output dimension D16 (Program Performance) is significantly correlated with all input dimensions
except D2 (Academic Calendar), D9 (Main Physical Resources) and D12 (Student Intake).
8. CONCLUSIONS
1. The hypothesis testing indicates that the faculty members working in two categories of self-
financing engineering colleges perceive the ten quality dimensions differently. Those quality
dimensions are: Instruction, Evaluation and Feedback Processes, Adherence to Academic Calendar,
Industry Initiatives, Adequacy of Supplementary Physical Resources, Learning Facilities,
Stakeholder Satisfaction, Program Performance, Leadership Efficiency, Commitment to achieving
goals, Performance Appraisal & Development.
2. Mean value (table.3) of the responses for the dimensions numbered 1, 2,5,8,13,14,16,18,19
and 21 from both the categories of self-financing engineering colleges gives an indication that
(i) Instruction, Evaluation & Feedback processes are of higher standard in autonomous colleges
(mean value 4.0062) when compared with non-autonomous colleges (mean value 3.75)
(ii) (ii) Adherence to Academic Calendar is high in autonomous colleges (mean value 4.3875)
when compared with non- autonomous colleges (mean value 4.0349)
(iii) Industry Initiatives for Industry-Institute Interaction is high in autonomous colleges (mean
value 3.8750) when compared with non-autonomous colleges (mean value 3.2558)
(iv) Adequacy of Supplementary Physical Resources are more in autonomous colleges (mean
value 4.4125) when compared with non-autonomous colleges (mean value 4.0581).
(v) Learning Facilities are more in autonomous colleges (mean value 4.2167) when compared
with non-autonomous colleges (mean value 3.9147).
(vi) Stakeholder Satisfaction is high in autonomous colleges (mean value 4.0000) when compared
with non-autonomous colleges (mean value 3.6977).
(vii) Program Performance is at the higher level in autonomous colleges (mean value 3.9350)
when compared with non- autonomous colleges (mean value 3.6605).
(viii) Leadership Efficiency is high in autonomous colleges (mean value 3.8000) when compared
with non-autonomous colleges (mean value 3.4651).
(ix) Management Commitment to achieve goals is high in autonomous colleges (mean value
3.9000) when compared with non-autonomous colleges (mean value 3.5349).
(x) Performance Appraisal & Development system is strong in autonomous colleges (mean value
3.9750) when compared with non- autonomous colleges (mean value 3.5349).
9. ANALYSIS OF RESULTS AND SUGGESTIONS
From table 3, it is concluded that the ten out of twenty one dimensions are differentiating the
performance of two categories of self-financing engineering colleges. All ten dimensions are found
stronger in colleges with autonomous status when compared with non-autonomous colleges. For
further analysis cross-tabulation is done on all the 21dimensional scores. The results are shown in
table.5.
(1) More number of respondents (46.5%) from non-autonomous colleges are observed in
“Agree” class when compared to the number of respondents (30%) from autonomous colleges under
the Dimension 2 i.e., Adherence to Academic Calendar. The reason could be: Faculty members from
non-autonomous colleges are of the opinion that they are able to complete the teaching of total
portions in spite of having more number of public holidays.
(2) A large number of respondents from both the non-autonomous colleges (23.2%) as well as
autonomous colleges (22.5%) are observed in “Neutral” class under the Dimension 5. The reason
could be: the type of efforts Industry-Institute Interaction Cell of the college is putting is not known
14. International Journal of Management Research and Development (IJMRD) ISSN 2248-938X (Print),
ISSN 2248-9398 (Online) Volume 4, Number 1, January-March (2014)
81
generally to the faculty members from teaching departments. This is a bad sign. Suggestion: College
authorities should put enough efforts in interacting with industries through its Industry-Institute
Interaction Cell. It is important at the same time to create the awareness among teaching departments
regarding the efforts that the Industry-Institute Cell is putting and its initiated programs.
(3) A good number of respondents are observed in “Strongly Agree” class from both the
autonomous colleges (62.5%) as well as non-autonomous colleges (48.8%) under the Dimension 8.
The multiple reasons can be understood by looking at the items falling under this dimension.
Probable reasons are:
(a) Number of copies of prescribed text book found in non-autonomous college libraries is higher
than the variety of reference books. The reverse is true in autonomous college libraries.
(b) The transportation facilities available in non-autonomous colleges in general are higher than
that in autonomous colleges.
(c) Residential facilities found in autonomous colleges are vast in comparison with non-
autonomous colleges.
(d) Internet facility available in autonomous colleges is wider when compared with the non-
autonomous colleges.
(4) Highest respondents are found in “Neutral” class under the Dimension 12. The reasons could
be:
(a) Students are admitted through multiple channels in both autonomous and non-autonomous
categories of colleges. It is becoming difficult to ensure the entry of only merited students. So,
the respondents were in dilemma in commenting on the quality of student’s intake
(b) Faculty members from both the categories of engineering colleges are unable to confirm that
their students have taken up engineering studies by looking at the interest exhibited by students
in class room learning now-a-days.
Suggestion: Under these circumstances, it would be better if colleges shift their focus from
“Teacher Centred Approach” to “Learner Centred Approach”.
(5) The number of self-financing engineering colleges offering rewards in terms of monetary
incentives to its faculty members is more in autonomous category when compared with non-
autonomous category. Peer reviewed journal publications, consultancy works, and research
publications are a few items on the performance appraisal format enabling their faculty members to
earn monetary incentives. Faculty members earning such monetary incentives are very few in
number in both the category colleges. This fact is evident from the percentage of faculty members
falling under “strongly agree” class in Dimension 14.
A considerable number of faculty members have fallen in “neutral class” under Dimension 14
from both the non-autonomous (25.6%) and autonomous status (17.5%) category colleges. This point
infers that either the awareness among the faculty members regarding the monetary incentives
facility is poor or the faculty members are considering the amount of monetary incentives offered are
insignificant. Suggestion: College managements need to create the awareness among its faculty
members regarding the monetary incentives facility through its heads of the departments. Such an
attempt would definitely motivate the faculty members in both the category colleges.
(6) In non-autonomous as well as autonomous category self-financing engineering colleges (a)
class committee meetings are conducted regularly (b) feedback is collected from students regarding
their faculty member’s performance inside the class as well as the personal characteristics exhibited
by the faculty members inside and outside the class.
In addition to the above mentioned items (a) and (b), autonomous colleges have many other
items like objectives to be achieved in “Employee Performance Measurement System” Forms. In the
beginning of each semester, head of the department discusses in detail the performance expectations
with each faculty member in one to one meetings. This is evident from the percentage faculty
members falling under “Agree” and “Strongly Agree” classes in Dimension 18.
15. International Journal of Management Research and Development (IJMRD) ISSN 2248-938X (Print),
ISSN 2248-9398 (Online) Volume 4, Number 1, January-March (2014)
82
(7) College management from both the categories of colleges is collecting feedback from the 8th
semester students especially, regarding their satisfaction with reference to the facilities provided by
the college. Faculty members are not at all involved in either distributing the forms or in collecting
the filled feedback forms from students. Probably this is the reason why more faculty members are
found under “Neutral” class (27.7%) than under “Strongly Agree” class (9.6%) in Dimension 19.
Suggestion: College managements shall involve their faculty members in distributing the students’
satisfaction feedback form and in collecting the same. This small attempt helps the college in
developing good relations between their faculty members and students. This in turn may also help
the college in long run in getting funds, equipment, projects, and even jobs for current students from
alumni. College management may even address their current students regarding the feedback and
suggestions given by their alumni and to what extent those suggestions have been implemented.
Such an attempt can make their students feel proud. When they realize that their suggestions are
sought by the college, their involvement in the developmental activities of the college will definitely
improve.
(8) Information is collected by the college managements from different stakeholders like alumni,
parents, corporate etc. This information is used in developing the curriculum. The curriculum is
developed (a) at the college level in case of autonomous category colleges (b) at the university level
in case of non-autonomous colleges. This means that number of faculty involving in curriculum
development from autonomous colleges is much more when compared to non-autonomous colleges.
This could be the reason why there is a drastic difference in number of faculty members falling in
“Agree” class from autonomous colleges when compared with the non-autonomous colleges under
Dimension 20.
(9) Student’s feedback on faculty member’s performance and pass percentage in end semester
exams are the two indices calculated and considered during the performance appraisal process in
both the categories of colleges. Faculty members with poor feedback are asked to sit in the senior
faculty member’s classes. This is also a common practice in both the categories of colleges. This
could be the main reason why there is no much difference in the number of faculty members falling
under “Agree” class in Dimension 21.
In addition to the above mentioned two indices, many other indices are included in
“Performance Evaluation Form” in autonomous colleges. In some of the colleges, faculty members
are graded based on the total score obtained during appraisal and are also rewarded monetarily. The
colleges offering such monetary incentives are found more in number in autonomous category than
in non-autonomous category. That could be the reason why more number of faculty members is
found in autonomous college category (37.5%) than in non-autonomous category (11.6%) under
“Strongly Agree” class in Dimension 21. Suggestion: Heads of the departments may prepare the
skills matrix based on the feedback scores of their faculty members while teaching various subjects.
Subjects may be allotted based on this matrix after discussing enough with their faculty members.
10. REFERENCES
1. Cave, M., Hanney, S., Kogan, M. And Travett, G. (1988), The Use of Performance Indicators
in Higher Education: A Critical Analysis of Developing Practice, Jessica Kingsley, London.
2. Chaudhuri, D., Mukhopadhyay, A.R. and Ghosh, S.K (2009), “Assessment of engineering
colleges through application of the Six Sigma metrics in a State of India”, International Journal
of Quality & Reliability Management, Vol. 28 No. 9, pp. 969-1002.
3. Collofello. J. (2004). “Applying Lessions Learned from Software Process Assessments to
ABET Accreditation”, 34th
ASEEIEEE Frontiers in Education Conference, T3G-24 to T3G-
26.
4. Crosby, P.B. (1984). “Quality without tears”, McGraw- Hill, New York.
16. International Journal of Management Research and Development (IJMRD) ISSN 2248-938X (Print),
ISSN 2248-9398 (Online) Volume 4, Number 1, January-March (2014)
83
5. ENDREC (1970). “Education and National Development – Report of the Education
Commission”, 1964-66, New Delhi.
6. Eriksen, S.D. (1995). "TQM and the transformation from an élite to a mass system of higher
education in the UK", Quality Assurance in Education, Vol. 3 No. 1.
7. Gaur, A.S., Gaur, S.S. (2009), Statistical Methods for Practice and Research, A guide to data
analysis using SPSS, SAGE Publication.
8. Joglekar, M.V., Sahasrabudhe, S.S., and Sushama, S.K. (1999). “Performance Evaluation of
Technical Education Institute as a System for Technical Quality”, The Indian journal of
technical education, Oct-Dec.
9. Johnes, J. And Taylor, J. (1990), Performance Indicators in Higher Education, SRHE and Open
University Press, Buckingham.
10. Juran, J. M. (1998). “Quality control Handbook”’ McGraw – Hill, New York.
11. Pfeffer, N. And Coote, A. (1991), Is Quality Good For You? A Critical review of Quality
Assurance in the Welfare Services, Institute of Public Policy Research, London.
12. Rao, V. R. (2000). “Graph theory and matrix approach for the performance evaluation of
technical institutions”, The Indian journal of technical education, Vol. 23, No.2, pp 27-33,
April – June.
13. Rao, V. R., and Singh, D. (2002). “Analytic Hierarchy Process (AHP) for the performance
evaluation of technical institutions”, The Indian journal of technical education Vol. 25, No.4,
pp 59 – 66, October – December.
14. Reddy, B.K., Ayachit, N.H., and Venkatesha, M.K. (2004). “A Theoretical Method for
Performance Evaluation of Technical Institutions – Analytic Hierarchy Process Approach”,
The Indian Journal of Technical Education, vol.27, No.1, pp 19 - 25.
15. Sahney, S., Banwet, D.K. and Karunes, S. (2004), “Conceptualizing total quality management
in higher education”, The TQM Magazine, Vol. 16, No. 2, pp. 145-159.
16. Sahney, S., Banwet, D.K. and Karunes, S. (2004), “A SERVQUAL and QFD approach to total
quality education: A Student perspective”, International Journal of Productivity and
Performance Management, Vol. 53, No. 2, pp.143-166.
17. Sakthivel, P.B. (2007), “Top management commitment and overall engineering educational
excellence”, The TQM Magazine, Vol. 19, pp. 259-73.
18. Sakthivel, P.B., Rajendran, G. And Raju, R. (2005), “TQM implementation and students
satisfaction of academic performance”, The TQM Magazine, Vol. 17, pp. 573-89.
19. Suganthi, L., Samuel, A. A., and Jagadeesan, T. R. (1998) “Failure Mode and Effect Analysis
as a Preventive Tool for Quality Improvement in Education”, the Indian Journal of Technical
Education, Vol.21, No.3, pp. 46 - 50.
20. Shivakumar, B., Virupaxi, B., and Basavaraj, K. (2012) “TQM dimensions and their
interrelationships in ISO certified engineering institutes of India”, benchmarking: An
International Journal, Vol. 19 No. 2, pp. 177-192.
21. Tata, J., Prasad, S. and Thorn, R. (1999), “The influence of organizational structure on the
effectiveness of TQM programs”, Journal of Managerial Issues, Vol. 11 No. 4, pp. 440-53.
22. Viswanadhan, K.G. (2005). “Assessment of Quality of Undergraduate Engineering
Programmes in India”, PhD thesis, IISc, Bangalore.
23. Viswanadhan, K.G. (2006), “PROCESS-RESOURCE-OUTCOME-MANAGEMENT (PROM)
MODEL FOR ASSESSMENT OF QUALITY OF ENGINEERING PROGRAMMES IN
INDIA”, Proceedings of the 36th
Annual Convention of Indian Society for Technical Education
and National Seminar held at Bannari Amman Institute of Technology, Kodamangalam,
Tamilnadu, India, and December.
17. International Journal of Management Research and Development (IJMRD) ISSN 2248-938X (Print),
ISSN 2248-9398 (Online) Volume 4, Number 1, January-March (2014)
84
24. Viswanadhan, K.G. and Rao, N.J. (2005), “Accreditation and continuous assessment of quality
of engineering programmes – a mechanism based on distance mode”, paper presented at the
ICDE International Conference, New Delhi, and 19-23 November.
25. Viswanadhan, K.G., Rao, N.J., Mukhopadhya, C. (2005), “Impact of privatization on
engineering education –A study through the analysis of performance of Self-financing
engineering programmes in India”, Journal of Services Research, Special issue, December, pp.
109-129.