
Recommandé
Recommandé
Contenu connexe
Tendances
Tendances (20)
En vedette
En vedette (20)
Similaire à Water Impurity Measurement System using Microwaves
Similaire à Water Impurity Measurement System using Microwaves (20)
Dernier
Dernier (20)
Water Impurity Measurement System using Microwaves
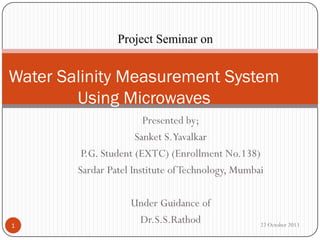
- 1. Project Seminar on Water Salinity Measurement System Using Microwaves Presented by; Sanket S.Yavalkar P.G. Student (EXTC) (Enrollment No.138) Sardar Patel Institute of Technology, Mumbai 1 Under Guidance of Dr.S.S.Rathod 22 October 2013
- 2. Contents Aim and Objectives Project Motivation Literature Survey Water Salinity System Introduction Need of Work Antennas Design of Patch Antenna Parametric Study of Patch Antenna Salinity and Various Salinity Measurement Systems Microwaves Based Water Salinity Measurement System Proposed System 2 Conclusion 22 October 2013
- 3. Aim To design the patch antenna to use it for Salinity Measurement System Objective To study antennas. Study Salinity Measurement Systems. Study and Design a Patch Antenna. Use that antenna for Measuring Salinity of Water. 3
- 4. Project Motivation Actual Photograph of Bore-well of water Water to be Tested 4 22 October 2013
- 5. Literature Survey Patch Antennas James Maxwell and Ruolph Hertz are the one who described the electromagnetic waves in 18th century [1-2]. Antennas are the one which are first studied and developed by Guglielmo Marconi in the first few years of 20th century [3]. In year 1979, the microstrip patch antennas were proposed by, Munson R. with Joy E., in which they proposed the planer endfire antennas [4]. The present technology of printed antennas points to use of available structures and designs. 5 22 October 2013
- 6. Literature Survey Salinity Measurement System First published work was by famous chemist Robert Boyle in 17th century about “Observations and Experiments on Saltiness of SeaWater,” cleared up some ideas about salt. In 18th century, Mist chemists Hitherto had evaporated the water to find out salt contents. Between 1843 and 1865 the Danish chemist, J.G.Forchhammer published several milestone papers on the compostion of sea water. His techniques were gravimetric; he did not use the evaporation method. He used data from all over the world, and compared his results for these different waters. Forchhammer introduced the word „Salinity‟. 6 22 October 2013
- 7. In the years 1873-1876 H.M.S. Challenger sailed almost 69,000 miles about the world making oceanography observations. Seventy-seven salinity samples were collected from various depths. They were analysed by W.Dittmar, in “the most extensive sea water analysis performed before, or since.” The concepts noted above were generally accepted by the late 19th century but the man behind the coefficients of chlorine and specific gravity were uncertain. Chlorine content of the samples was determined by titration using the Mohr method by the Swedish chemist, S. P. L. Sorensen in 1901. The equation relating salinity and chlorinity (S=1.805CL+0.030) was stated by him from his observations. 7 22 October 2013
- 8. Knudsen determined the specific weights of the samples. C. Forch determined the volume expansion of sea water. In a remarkably short time the results of these studies were published in the famous "Hydrographical Tables", of 1901 relating chlorinity, salinity and density of sea water.These tables have been in use for seventy years Since 1955 salinity determination by measuring the electrical conductivity of sea water has come into prominence until at present many more determinations of salinity are made by the conductivity measurements than by chemical titrations. The latest instruments are almost as sensitive as the best laboratory salinometers but because of the operating environment are rated by the manufacturer as giving an accuracy of about 0.01‰ in salinity. [5] 8 22 October 2013
- 10. Need of Work Effect of use of salty water Agriculture Agriculture is not possible on saline Land. Society Quality of Construction Dams Construction Health kidney disease kidney stones high blood pressure 10 Saline Land(Courtesy : Google Image) Use of Saline Water for Construction ( Courtesy : Google Image )22 October 2013
- 11. Salinity Measurement Systems 11 22 October 2013
- 12. Microwave Based Salinity Measurement System 12 22 October 2013
- 13. Antenna is transducers (it converts one from of energy in to another) that transmit or receive electromagnetic waves (has electric and magnetic field component which oscillate in phase perpendicular to each other and to the direction of energy propagation). Antenna???
- 14. Comparison Of Different Antenna Radiation Power Gain Polarization Patterns Dipole Broadside Low Low Linear Multi Element Broadside Low/medium Low Linear Broadside Medium Medium/high Linear/circular Broadside High High Linear/circular Yagi Antenna Endfire Medium/high Medium/high Linear Slotted Antenna Broadside Low/medium Low/medium Linear Microstrip Endfire Medium Medium Linear/circular Dipole Flat Panel antenna Parabolic Dish Antenna antenna
- 15. Basic form of Patch Antenna
- 16. Design of Patch Antenna 16
- 17. Transmission Line Model 17 22 October 2013
- 19. Design of Patch Antenna Antenna Specifications Parameters Length Width 45 mm Ground Plane Length 110 mm Ground Plane Width 90 mm Height 1.56 mm Substrate FR4 Dielectric Constant 4.47 Loss Tangent 0.02 Resonance Frequency 19 55.5 mm 1.57 GHz
- 20. Parametric Study of Patch Antenna Effect of Height Effect of Width Effect of Dielectric Constant Effect of Loss Tangent Effect of Feed Location 20 22 October 2013
- 21. Effect of Height 0 -2 Return Loss (dB) -4 -6 -8 -10 -12 -14 -16 Height = 3 mm Height = 1.5 mm -18 -20 1.48 1.50 1.52 1.54 1.56 1.58 1.60 1.62 Frequency (GHz) Discussion : With an increase in h from 1.5 mm to 3 mm, the following effects are observed: •Resonance frequency decreases •The BW of the antenna increases •BW is directly proportional to height(h)
- 22. Effect of Width 0 -2 Return Loss (dB) -4 -6 -8 -10 -12 Width = 44.5 Width = 43.5 -14 -16 -18 1.4 1.5 1.6 1.7 1.8 1.9 2.0 2.1 Frequency (GHz) Discussion : With an increase in W from 43.5 mm to 44.5 mm, the following effects are observed: • Resonance frequency decreases from 1.64 GHz to 1.57 GHz • BW of the antenna increases
- 23. Effect of Dielectric Constant 0 -2 Return Loss (dB) -4 -6 -8 -10 -12 r =1 r =2.2 r =4.4 -14 -16 -18 1.48 1.50 1.52 1.54 1.56 1.58 1.60 1.62 Frequency (GHz) Discussion: Єr is decreased to 1, the resonance frequency increases. A better comparison of effect of Єr is obtained when the antenna is designed to operate in the same frequency range for different values of Єr .
- 24. Effect of Loss Tangent 0 Return Loss (dB) -5 -10 -15 -20 tan = 0.02 tan = 0.001 -25 -30 -35 1.48 1.50 1.52 1.54 1.56 1.58 1.60 1.62 Frequency (GHz) Discussion: It is observed that lesser the loss tangent the less the loss in the probe. 24 22 October 2013
- 25. Effect of Feed Location 0 -2 Return Loss (dB) -4 -6 feed at (10,6) feed at (10,12) feed (10,7) feed (10,8) feed (10,9) feed (10,10) -8 -10 -12 -14 -16 -18 1.560 1.565 1.570 1.575 1.580 Frequency (GHz) • The feed point at (10,8)giving most negative RL
- 26. Conclusion From Parametric Study of Above Design of Antenna Change In Parameters Feed Location Height Width εr Loss Tangent 26 Resonance Frequency No shift Bandwidth Increases Decreases Decreases Increases Increases Decreases Decreases Decreases No Chage
- 27. Manufactured Antenna Parameters Length Width 45 mm Ground Plane Length 110 mm Ground Plane Width 90 mm Height 1.56 mm Substrate FR4 Dielectric Constant 4.47 Loss Tangent 0.02 Resonance Frequency 27 55.5 mm 1.57 GHz
- 28. Measured Results 0 Return Loss (dB) -10 -20 -30 -40 -50 1.555 Simulated Results Measured Results 1.560 1.565 1.570 1.575 Frequency (GHz) Frequency (GHz) 28 Resonance Frequency Bandwidth Simulated Results 1.5710GHz Measured Results 1.5760GHz +5MHz 1.11% 1.27% -0.16% Error 1.580 1.585
- 29. Salinity and Unit to Measure Salinity 29
- 30. Salinity Measurement Methods 1. Gravimetric Determination 1. 2. 3. Take a known amount of salty water. Evaporate it to dryness Weigh the remaining salts Limitations : 1. Residue left after evaporation is a complex mixture of salts together with some water of hydration bound to the solids, plus a small amount of organic material 2. So produces unreliable results 30
- 33. Use of Microwaves for salinity Measurement 33
- 34. Use of Microwaves for salinity Measurement Salt is composed of sodium chloride (NaCl) Pure water is poor conductor of electricity. But the ions of NaCl with water increases conductivity of 34 water. So skin depth decreases as salt percentage in water increases. EM waves totally degrade after a distance equal to skin depth One can measure attenuation of EM waves using various instruments like network analyser, spectrum analyser, etc. We can build up a relation in attenuation of EM waves with percentage salt content in water.
- 35. Methodology Transmitting Antenna Sample Holder/Cavity Signal Generator Spectrum Analyser Receiving Antenna Water Samples Analog Input File Firmware/ Software 35
- 36. Procedure : Take pure form of water or take water whose contents are known Take a patch antenna having cavity above its conducting patch. Use as a receiver. Use another antenna without cavity as a transmitting antenna Measure the attenuation with air in cavity. Store Result for Reference. Pour the Pure form of water in the cavity Measure the attenuation Store Result for Reference Pour known quantity of salt (sample 1..n )in pure water Measure as many samples as one can to have many references for calibration. 36 Use calibrated data as a reference during actual measuring of salinity at field.
- 37. Apparatus Required Transmitting Antenna and Receiving Antenna Spectrum Analyser Signal Generator Sample Holder 37
- 39. Results and Discussion Sample Without Water Sample 1 Sample 2 Sample 3 Sample 4 Sample 5 39 % of Attensalt in uation water (dBm) -10.35 0 2.5 5 7.5 10 -30.04 -34.86 -35.98 -38.24 -44.23
- 40. Proposed Indigenous offline Water Salinity System 1.57 GHz Oscillator 1.50 GHz Oscillator Power Amplifier Mixer Isolator LNA Patch Antenna Rx Patch Antenna Tx Sample Holder/ Cavity BPF 1.57GHz BPF 70MHz IF Amplifier Coupler 1 A1 DC Ampl. Ampl. Detector Data Acquisition Unit Computer 40
- 42. Applications Salinity Measurement 2. Impurity of Water Measurement 3. Soil Moisture Measurement 4. Grains Moisture Measurement 1. 42 22 October 2013
- 43. Conclusion Patch antenna is studied and designed. Analytical Study of Patch Antenna. Parametric study of patch antenna. Various Salinity Measurement System are studied. Implementation of Microwave based Offline Salinity Measurement System using Patch antennas. Offline Salinity Measurement System is proposed. 43
- 44. Future Work A better calibration scheme will make the system better. The use system can be further expanded by using it not only for salt measurement but also impurity measurement in water. 44
- 45. Publications 1. 2. 3. 45 S.S.Yavalkar, R.T.Dahatonde, S.S.Rathod, S.B.Deosarkar, “Comparative Analysis of Bandwidth Enhancement of Microstrip Patch Antenna using Various Geometries,” IOSR Journal,Vol.3, Issue 4, pp.Sep.2012 S.S.Yavalkar, R.T.Dahatonde, S.S.Rathod, S.B.Deosarkar, “Parametric Study of Rectanguar Microstrip Antenna,” IOSR Journal,Vol.5, Issue 2,pp.4953,Apr. 2013. S.S.Yavalkar, R.T.Dahatonde, S.S.Rathod, “Water Salinity Measurement Using Patch Antennas,” INDICON-2013, Mumbai, (communicated) 22 October 2013
- 46. References [1] Maxwell James Clerk, “A dynamic Theory of Electromagnetic Field,” Philosophical Transaction of the Royal Society of London,1865. [2] Heinrich Hertz, “Electric Waves: Being Researches on the Propagation of Electric Action with Finite Velocity Through Space,” Dover Publications, 1893. [3] Bondyopadhyay,K. Prebir, "Guglielmo Marconi – The father of long distance radio communication – An engineer's tribute,"25th European Microwave Conference,pp.879, 1995. [4] Munson, R. Joy, E., “Microstrip antenna technology at ball aerospace systems, Boulder, Colorado,” Antennas and Propagation IEEE society newsletter, Vol.21 pp.4 6, June 1979. [5] E.R.Walkar, Salinity in Physical Oceanography, Pacific Marine Science Report,Institute of Ocean Science,Victoria B.C., pp.21-76, Sept. 1976. [6] Practical Salinity Scale, Unesco,1979 [7] Ghassemi F., Jakeman A.J., Nix H.A., Stalinisation of land and water resources: Human causes, extent, management and case studies, UNSW Press, Sydney, Australia, and CAB 46 22 October 2013
- 47. Thank You !!! 47
- 50. Effect of Feed Location 0 -2 Return Loss (dB) -4 -6 feed at (10,6) feed at (10,12) feed (10,7) feed (10,8) feed (10,9) feed (10,10) -8 -10 -12 -14 -16 -18 1.560 1.565 1.570 1.575 1.580 Frequency (GHz) Discussion : 50 • Minimum Return Loss (RL) occurs at feed-location (10,8). •There is only one feed point where RL is minimum. 22 October 2013
- 51. Effect of height 0 -2 Return Loss (dB) -4 -6 -8 Height = 3 mm Height = 1.5 mm -10 -12 -14 -16 -18 -20 1.48 1.50 1.52 1.54 1.56 1.58 1.60 1.62 Frequency (GHz) 51 Discussion : With an increase in h from 1.5 mm to 3 mm, the following effects are observed: •Resonance frequency decreases •The BW of the antenna increases 22 October 2013 •BW is directly proportional to height(h)
- 52. Effect of Dielectric Constant 0 -2 Return Loss (dB) -4 r =1 r =2.2 r =4.4 -6 -8 -10 -12 -14 -16 -18 1.48 1.50 1.52 1.54 1.56 1.58 1.60 1.62 Frequency (GHz) 52 Discussion: Єr is decreased to 1, the resonance frequency increases. A better comparison of effect of Єr is obtained when the antenna is designed to 22 operate in the same frequency range for different values of ЄrOctober 2013 .
- 53. Effect of Width Discussion: •The resonance frequency decreases from 1.64 GHz to 1.57 GHz due to the increase in ∆L and Єe. •The BW of the antenna increases; however, it is not very evident from these plots, because the feed point is not optimum for the different 22 October 2013 53 widths
- 54. Effect of Shape Parameters RMSA L-Shape S-Shape Geometry Return Loss Bandwidth 54 -20 dB 30MHz -15 dB 35MHz -30dB 40 MHz 22 October 2013
- 55. Effect of Shapes 55 22 October 2013
- 56. Fractal Antenna Design 1. Iteration 1 2. Iteration 2 56 22 October 2013
- 57. 3. Iteration 3 57 22 October 2013
- 58. Plan of Work Current Work Till now different BW enhancement methods were studied and implemented. The methods till studied are : 1. Use of thicker substrate or use of stacked patches. 2. Use of slots. 3. Fractal design of patch. Remaining Work There are still some more methods to be studied for enhance the BW. These are like : 1. Suspended design of fractal. 2. Monopole patch antenna. 58 22 October 2013
- 59. Thank You !!! 59 22 October 2013
- 60. Analysis of RMSA using Transmission line Model 60 22 October 2013