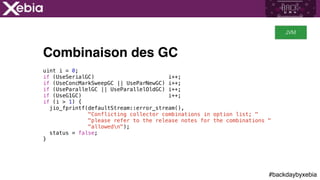
Télécharger en tant que PDF, PPTX


![#backdaybyxebia
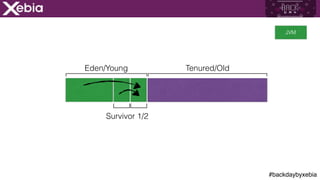
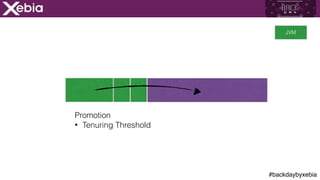
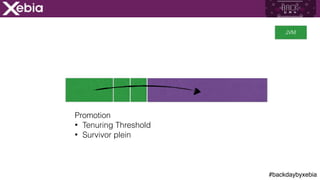
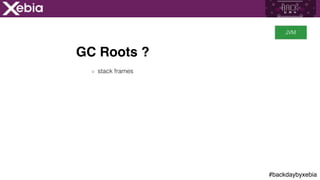
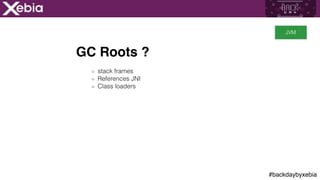
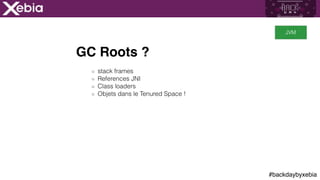
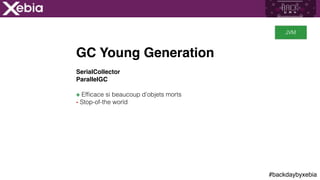
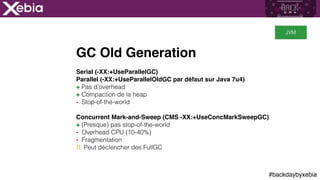
JMH
public class JMHSample_03_States {
@State(Scope.Thread)
public static class ThreadState {
volatile double x = Math.PI;
}
@Benchmark
public void measureUnshared(ThreadState state) {
state.x++;
}
public static void main(String[] args) throws RunnerException {
Options opt = new OptionsBuilder()
.include(JMHSample_03_States.class.getSimpleName())
.warmupIterations(5)
.measurementIterations(5)
.threads(4)
.forks(1)
.build();
new Runner(opt).run();
}
}
APP](https://image.slidesharecdn.com/backday-xebia-chercher-performance-150605075804-lva1-app6891/85/Backday-xebia-Chercher-la-performance-efficacement-66-320.jpg)


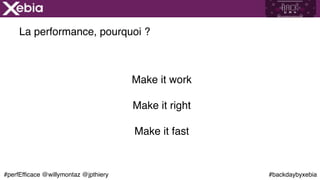
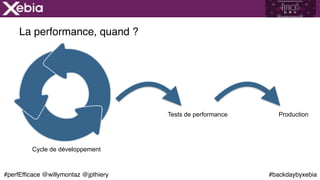
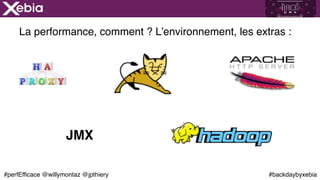
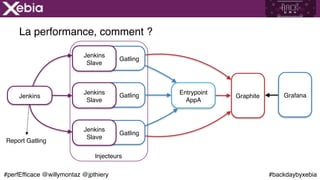
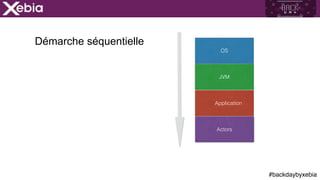
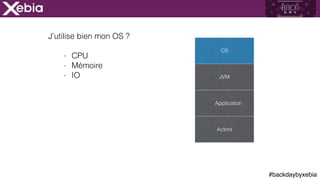
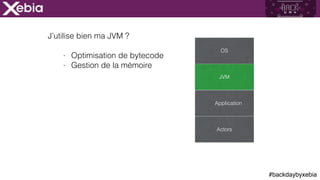
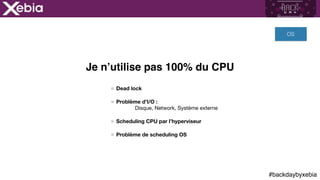
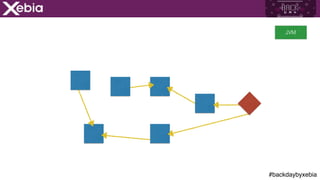
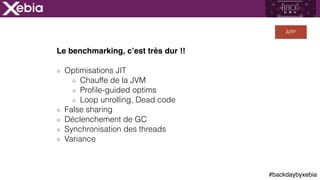
Le document traite de l'optimisation de la performance des applications Java, en abordant des concepts clés tels que les tests de performance, l'utilisation efficace de la mémoire et les stratégies de garbage collection. Il met en lumière les problèmes fréquents rencontrés dans les applications, notamment la mauvaise utilisation des collections et l'absence de cache, tout en proposant des conseils pratiques pour améliorer la performance. Plusieurs outils et techniques, tels que JMX, Gatling et VisualVM, sont recommandés pour diagnostiquer et optimiser les performances.


