SlideShare une entreprise Scribd logo
1  sur  1
Télécharger pour lire hors ligne
Business sectors in change. The Netherlands, province of Flevoland and Flevoland municipalities, 2000-2010, jobs
share per sector in total economy (%), measured in jobs (fulltime and parttime). Sorted on size of business sectors for province of Flevoland.


                                  Netherlands          Flevoland              Almere           Dronten              Lelystad           NO-polder               Urk               Zeewolde
                             %

                             30                                                         25,1
                                                                     21,0                                                       20,7
                                                17,3                                                       16,6                                     16,2                                    16,5
                             20
                                                                                                                                                                        11,4
business and
                             10
financial services
                             0


                            30
                                                                     19,8               21,5               21,3                                                                             21,5
                                                17,4                                                                            18,0                16,3                17,2
                            20

                            10
trade
                             0


                            30
                                                                                                                                18,2
                            20                  15,8                 13,7               13,6               11,8                                     13,4
                                                                                                                                                                         9,1
                            10                                                                                                                                                              6,4
care sector
                             0


                            30                                                                                                                                          26,6


                            20
                                                11,7                                                                                                11,8
industrial sector                                                    9,2
                                                                                        6,7                 8,4                 8,7                                                         10,4
                            10

                             0


                            30

                            20

                                                6,8                  6,8                7,6                 7,3                 6,1                 6,4
                            10                                                                                                                                           5,5                4,4
education
                             0


                            30

                            20
                                                                                                                                 8,4
                            10                   5,5                 5,2                5,4
                                                                                                            3,1                                      2,7                 2,6                 2,7
government
                             0


                            30

                            20
                                                                                                                                                                                             10,0
                                                                                                            7,4
                            10                   4,3                 4,7                4,3                                      4,1                 3,3                 2,8
remaining services
                             0


                            30

                            20
                                                                                                                                                                           8,2
                            10                   6,2                 4,6                                    5,7                  4,8                 4,6
                                                                                         4,1                                                                                                 4,3
construction
                             0


                            30

                            20                                                                                                                       16,2
                                                                                                            10,7
agriculture and             10                                       4,5
                                                                                                                                                                           8,7                8,4
                                                 3,0                                                                             1,3
fishery                                                                                  0,4
                             0


                            30

                            20
                                                                                                                                                                                             10,3
                            10                   5,2                 3,8                 3,5                                                         4,0                   3,8
                                                                                                             2,3                 3,1
transport
                             0


                            30

                            20

information and             10                                                           5,1
                                                 3,2                 3,8                                                         3,3
                                                                                                             2,3                                     2,1                   1,4                2,5
communication
                             0


                            30

                            20

                            10                   4,3                  2,9                                    3,2                 3,2
                                                                                         2,8                                                          2,9                  2,7                2,5
hotel and catering
                             0

                                              100                    100                100                 100                 100                 100                  100                100


The visualization is most effective when printed in colour on A4 paper (portrait).
This visualization is part of a forhtcoming publication about the development of jobs and businesses in the province of Flevoland (2011). Free to use with acknowledgement.
colophon: Province of Flevoland I Department of Economy & Society I Research & Statistics I Joshua de Haseth I onderzoek@flevoland.nl I www.flevoland.nl/feitenencijfers

Contenu connexe

Similaire à Business sectors in change, Flevoland 2010

Yolanda plantas arquitectura lam 4
Yolanda plantas arquitectura lam 4Yolanda plantas arquitectura lam 4
Yolanda plantas arquitectura lam 4yolandaruizr
 
Palestra de Guga Stocco, Vp de negócios do Buscapé no Soclday 2
Palestra de Guga Stocco, Vp de negócios do Buscapé no Soclday 2Palestra de Guga Stocco, Vp de negócios do Buscapé no Soclday 2
Palestra de Guga Stocco, Vp de negócios do Buscapé no Soclday 2eCRM123
 
L'innovation technologique au service du crédit à la consommation
L'innovation technologique au service du crédit à la consommationL'innovation technologique au service du crédit à la consommation
L'innovation technologique au service du crédit à la consommationCA Consumer Finance
 
2011 RAPPORT ANNUEL RECTICEL - CORP.
2011 RAPPORT ANNUEL RECTICEL - CORP.2011 RAPPORT ANNUEL RECTICEL - CORP.
2011 RAPPORT ANNUEL RECTICEL - CORP.Recticel NV/SA
 
Parapendio Jonny Pilot
Parapendio Jonny PilotParapendio Jonny Pilot
Parapendio Jonny PilotModellismo.it
 
Mediametrie Le Mobile 2.0 Edition 2009
Mediametrie Le Mobile 2.0 Edition 2009Mediametrie Le Mobile 2.0 Edition 2009
Mediametrie Le Mobile 2.0 Edition 2009servicesmobiles.fr
 
Integrating the PLE Concept in Teaching Activities
Integrating the PLE Concept in Teaching ActivitiesIntegrating the PLE Concept in Teaching Activities
Integrating the PLE Concept in Teaching ActivitiesLaurent Moccozet
 

Similaire à Business sectors in change, Flevoland 2010 (8)

Yolanda plantas arquitectura lam 4
Yolanda plantas arquitectura lam 4Yolanda plantas arquitectura lam 4
Yolanda plantas arquitectura lam 4
 
Palestra de Guga Stocco, Vp de negócios do Buscapé no Soclday 2
Palestra de Guga Stocco, Vp de negócios do Buscapé no Soclday 2Palestra de Guga Stocco, Vp de negócios do Buscapé no Soclday 2
Palestra de Guga Stocco, Vp de negócios do Buscapé no Soclday 2
 
L'innovation technologique au service du crédit à la consommation
L'innovation technologique au service du crédit à la consommationL'innovation technologique au service du crédit à la consommation
L'innovation technologique au service du crédit à la consommation
 
2011 RAPPORT ANNUEL RECTICEL - CORP.
2011 RAPPORT ANNUEL RECTICEL - CORP.2011 RAPPORT ANNUEL RECTICEL - CORP.
2011 RAPPORT ANNUEL RECTICEL - CORP.
 
Page0305
Page0305Page0305
Page0305
 
Parapendio Jonny Pilot
Parapendio Jonny PilotParapendio Jonny Pilot
Parapendio Jonny Pilot
 
Mediametrie Le Mobile 2.0 Edition 2009
Mediametrie Le Mobile 2.0 Edition 2009Mediametrie Le Mobile 2.0 Edition 2009
Mediametrie Le Mobile 2.0 Edition 2009
 
Integrating the PLE Concept in Teaching Activities
Integrating the PLE Concept in Teaching ActivitiesIntegrating the PLE Concept in Teaching Activities
Integrating the PLE Concept in Teaching Activities
 

Business sectors in change, Flevoland 2010

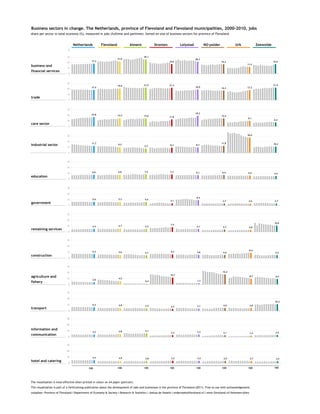
  • 1. Business sectors in change. The Netherlands, province of Flevoland and Flevoland municipalities, 2000-2010, jobs share per sector in total economy (%), measured in jobs (fulltime and parttime). Sorted on size of business sectors for province of Flevoland. Netherlands Flevoland Almere Dronten Lelystad NO-polder Urk Zeewolde % 30 25,1 21,0 20,7 17,3 16,6 16,2 16,5 20 11,4 business and 10 financial services 0 30 19,8 21,5 21,3 21,5 17,4 18,0 16,3 17,2 20 10 trade 0 30 18,2 20 15,8 13,7 13,6 11,8 13,4 9,1 10 6,4 care sector 0 30 26,6 20 11,7 11,8 industrial sector 9,2 6,7 8,4 8,7 10,4 10 0 30 20 6,8 6,8 7,6 7,3 6,1 6,4 10 5,5 4,4 education 0 30 20 8,4 10 5,5 5,2 5,4 3,1 2,7 2,6 2,7 government 0 30 20 10,0 7,4 10 4,3 4,7 4,3 4,1 3,3 2,8 remaining services 0 30 20 8,2 10 6,2 4,6 5,7 4,8 4,6 4,1 4,3 construction 0 30 20 16,2 10,7 agriculture and 10 4,5 8,7 8,4 3,0 1,3 fishery 0,4 0 30 20 10,3 10 5,2 3,8 3,5 4,0 3,8 2,3 3,1 transport 0 30 20 information and 10 5,1 3,2 3,8 3,3 2,3 2,1 1,4 2,5 communication 0 30 20 10 4,3 2,9 3,2 3,2 2,8 2,9 2,7 2,5 hotel and catering 0 100 100 100 100 100 100 100 100 The visualization is most effective when printed in colour on A4 paper (portrait). This visualization is part of a forhtcoming publication about the development of jobs and businesses in the province of Flevoland (2011). Free to use with acknowledgement. colophon: Province of Flevoland I Department of Economy & Society I Research & Statistics I Joshua de Haseth I onderzoek@flevoland.nl I www.flevoland.nl/feitenencijfers