

Recommandé
Recommandé
Contenu connexe
En vedette
Plus de Enviroair Industries
Plus de Enviroair Industries (18)
Maximiser reseaux
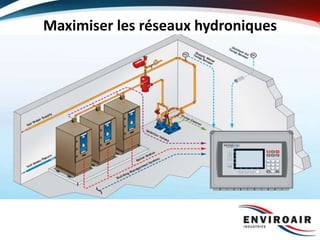
- 1. 1 Maximiser les réseaux hydroniques
- 2. 2 Sommaire de la présentation • Évolution et optimisation des composantes des systèmes hydroniques – Élimination d’air – Réservoirs d’expansion – Systèmes de pompage – Vannes de contrôle • Optimisation des réseaux de chauffage – Réseaux Primaire – Réseaux Primaire / Secondaire – Réseaux Primaire variable – Réseaux Primaire variable / secondaire variable
- 3. 2400 GPM 2400 GPM 1980 GPM (83% charge) 2 pompes en opération Pompe Simple Pompes en parallèle Profil de charge Ligne bleue = Profil au design Ligne rouge = Profil véritable Pourcentage de la charge Nombred’heuresparannée
- 4. VFD VFD
- 7. Pour la présentation complète, communiquez avec votre représentant. 514-738-9865
Notes de l'éditeur
- The purpose of this presentation is to: Define Free Cooling, Discuss the different types of free cooling systems that have, and are being used, along with the advantages and disadvantages of each, Walk thru the design of a typical free cooling system while developing an understanding of the factors affecting performance and cost, and Go thru “tips” for successful operation.
- We setup our example with a 2,400 GPM secondary pumping station. The first two graphs are the 100% pump on the left, and the 50/50/50 on the right. The bell curve represents our building load profile. The blue line is the ‘’design’’ profile, whereas the red line is the ‘’Actual’’ profile line (notice the red line has a lower peak, and is to the left a little). What the graph on the right is showing us is that starting at 83% load, we start running on one pump (2 redundant).