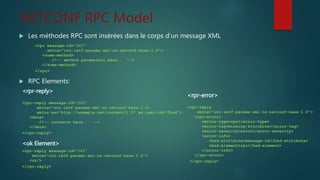
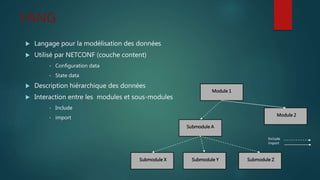
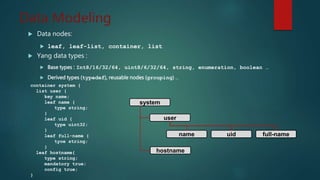
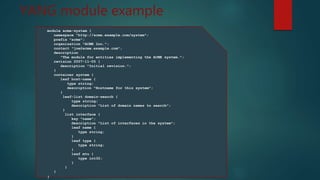
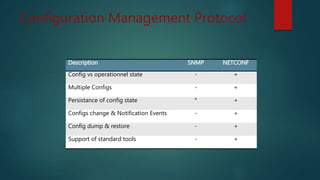
Le document discute du protocole NETCONF et de YANG pour la gestion des configurations réseau, soulignant la séparation entre l'état de configuration et l'état opérationnel et les mécanismes de gestion de la persistance. Il décrit des opérations clés tels que <get-config>, <edit-config>, et <commit> ainsi que l'architecture basée sur XML et les messages sécurisés. YANG est présenté comme un langage de modélisation des données pour décrire de manière hiérarchique la configuration et l'état des données.
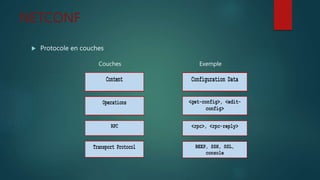
![NETCONF Transport
Messages encodé en XML
Messages crypté en SSH
Netconf over SSH, SOAP, BEEP
Authentification, intégrité et confidentialité
Orienté connexion TCP
Plusieurs ports TCP sont définit : 830, 831, 832, 833, 6513 / tcp
<?xml version="1.0" encoding="UTF-8"?>
<hello xmlns="urn:ietf:params:xml:ns:netconf:base:1.0">
<capabilities>
<capability>urn:ietf:params:netconf:base:1.0</capability>
</capabilities>
</hello>]]>]]>](https://image.slidesharecdn.com/netconfetyang-160706010945/85/Netconf-et-Yang-6-320.jpg)